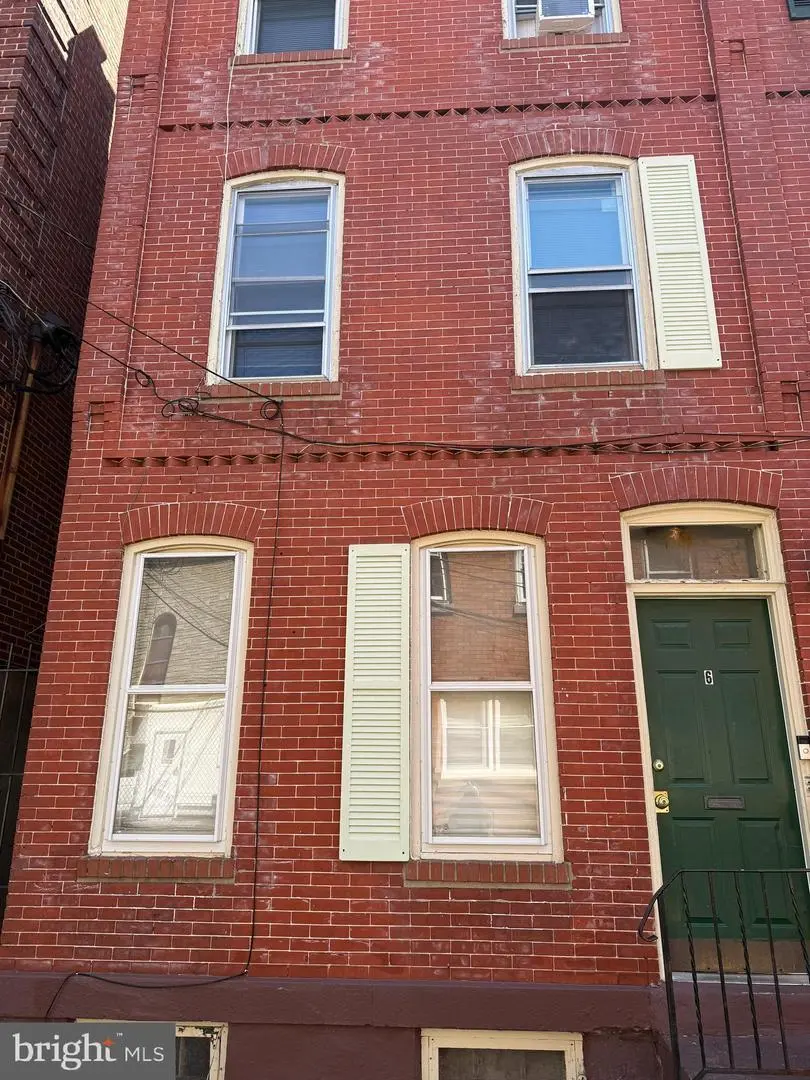
6 Peace St · Trenton, NJ
Flood risk 4/10 · Minor
- FEMA flood zone
- X (unshaded)
- Chance of flooding over 30 yrs
- 0.23%
- Est. flood insurance / yr
- $507 – $1,088
Fire risk 1/10 · Minimal
- Est. fire insurance / yr
- $526 – $976
Heat risk 7/10 · Major
- Hot days now (above 103°F)
- 7 days/yr
- Hot days in 30 yrs
- 15 days/yr
Wind risk 6/10 · Moderate
- Chance of severe wind over 30 yrs
- 27.0%
Air-quality risk 5/10 · Moderate
- Unhealthy air days now
- 6 days/yr
- Unhealthy air days in 30 yrs
- 8 days/yr
Risk factors via First Street. Map © Google.
Why this score? — see what drove the C- grade
The composite is a weighted blend of 9 inputs, each scored 0–100. Each bar is that input's sub-score; the figure is the points it added to the 100-point composite (weight × sub-score).
- Cash flow +20.5/30.0
- ARV discount +7.5/15.0
- DSCR +6.5/10.0
- 1% rule +5.2/10.0
- Appreciation +5.0/10.0
- Livability +3.8/5.0
- Rent growth +2.5/5.0
- Condition / age +2.5/5.0
- Schools +0.7/10.0
$260,000
🖨 Deal sheet 📄 Offer letter ✓ Due diligence
Listing remarks MLS
Attention Investors: Turnkey, cash-flowing multi-family opportunity!This solid brick, two-family property is in excellent condition with no known repairs needed a truly low-maintenance addition to your portfolio. refreshed in 2023. Located just steps away form the state building. The building boasts hardwood floors throughout and is fully occupied by outstanding, current tenants.Unit 1: A comfortable first-floor, 1-bedroom, 1-bathroom layout featuring exclusive access to a private backyard.Unit 2: A spacious, multi-level unit spanning the second and third floors. It features an eat-in kitchen, a large bathroom, and a generous living room accented with built-in shelves. The top floor houses two nice-sized bedroomsThe property includes a full, unfished basement. Tenants pay for their own electric, while the owner covers heat and water. With reliable rental income already in place, this building is ready to generate revenue from day one!
Key facts
- Private backyard
- Hardwood floors
- 1,050 sq ft lot
Tags
Property features AI
Finance
- Financial info: Two total units (multi-family); Assessed improvement value reported; Assessed land value reported; No rent control
Exterior
- Utilities: Public water; Public sewer (public septic); Natural gas available for hot water
- Home design: End of row/townhouse; Combination of flat and pitched roof; Fee simple ownership
- Construction: Brick construction; Concrete perimeter foundation; Built year per assessor
- Exterior features: Lot measures approximately 17.5 x 60 feet; No tidal water
Interior
- Bedrooms: One 1-bedroom unit and one 2-bedroom unit (multi-unit property)
- Heating & cooling: Radiator heating; Oil-fired heat; Natural gas hot water
- Interior features: Full basement; Multiple exit points (2+ access exits); Good overall condition; 8 total rooms
Neighborhood map
What this means for you Summary
Snapshot
- This is a 6-bed/?-bath single-family listed at $260k.
Deal economics
- At list price, monthly cash flow is $341 ($4k/yr) — positive.
- The deal already cash-flows at list — no discount required.
- Meets the 1% rule at list price ($3k rent vs $260k).
- Recommended offer: $244k (6.0% below list) — sets the bar for market timing.
- Cap rate 7.9% vs local median 6.3% in Trenton — meaningfully above typical; check what's discounted (condition, days-on-market, listing class) to confirm the premium yield is real.
Location & tenants
- Location reads 76/100 on livability (#133 in NJ, #3,533 nationally) — a middle-class / working-renter tenant base. Strengths: amenities A+, commute A+, health & safety A+; Watch: schools F, crime F, employment F.
- Trenton Public School District (urban): math 2% / reading 16% proficiency, ranked #471 of 472 in NJ (top 100%) — low school quality limits family demand, transient renter base, plan for 1-2y turnover; 80% free/reduced lunch — lower-income household profile, screen leases tightly.
- Market conditions: 4 active listings in the ZIP; 4 comparable units currently listed for rent nearby; rentals leasing fast (median 13d on market — plan ~1-2 weeks tenant-placement turnaround); 2,256 units permitted in Mercer County in 2024 (1,303 in 5+ unit buildings).
Forward outlook
- In year one you build about $10k of equity ($2k loan paydown + $8k appreciation (3.0% local appreciation)).
- Mercer County population projected at +4% by 2050 — modest demand growth; plan on rents tracking national, not racing it.
- At projected returns (3.0% appreciation + 3.0% rent growth), your $73k cash investment doubles in ~5 years — after that, you're playing with house money.
- By year 4, paydown + projected appreciation supports a ~$33k cash-out refi (75% LTV) — recoverable capital for the next deal without selling this one.
Negotiation context
- It's been on market 66 days — a 6% lower offer ($244k) is reasonable based on typical stale-listing flexibility.
- 11 sale attempts since 25y ago; this cycle's ask has dropped $70k (21%) from the opening price — seller is motivated, your offer sets the floor, not the list.
- Current owner paid $89k; list at $260k implies a 192% gain — meaningful room to come down on a strong offer.
Risks & watch-outs
- Watch-outs: built in 1887 — expect roof / HVAC / electrical / plumbing capex.
- Climate carrying-cost: major wind risk, 27% chance of damaging wind over 30y; extreme-heat days projected 7→15/yr by 2055 (HVAC capex compounding) — expect insurance premiums to compound above CPI over the hold.
Questions for the listing agent
- It's been on market 66 days. Have you received any prior offers? Is the seller open to a 6% concession, seller financing, or rate buy-down credit?
- Built in 1887 — when were the roof, HVAC, electrical panel, plumbing, and water heater last replaced?
- Why hasn't it sold? Are there any deal-killer items the seller is aware of (foundation, flood, title, zoning, code violations)?
- Is there a deadline driving the sale (1031 exchange, divorce, estate, relocation)? That informs how much negotiation room exists.
- Schools are F-rated, which usually means shorter tenancies and higher turnover. Who's the typical renter profile here, and what's been the actual vacancy rate?
- Crime grade is F in this area — have there been break-ins, vandalism, or insurance claims at this property in the last 3 years? What carrier currently insures it and at what premium?
- What's the average days-on-market for RENTAL listings here right now (not sales)? A rising rental-DOM trend means longer vacancies and softer asking-rent achievability than the comps imply.
- What's the recent tenant-quality profile in this submarket — average credit score on applications, eviction rate, late-payment / NSF rate, and stable-employment percentage? A property-management company in the area should have these aggregated.
- How much new for-sale + rental construction is in the pipeline within 1–3 miles? Heavy new supply typically softens prices + rents 12–24 months out; constrained supply supports both.
Investment metrics
- 1% rule
- 1.02% ✓
- Cap rate
- 7.87%
- Cash-on-cash
- 5.62%
- DSCR
- 1.25
- GRM
- 8.2
CMA / ARV
- ARV (on-the-fly)
- $121,296
- Comps found
- 1
Show comp detail 1 sale within ~0.75 mi
| Address | Dist | Beds/Ba | Sqft | Sold | Price | $/sf | Match |
|---|---|---|---|---|---|---|---|
| 216 Brunswick Ave | 0.66mi | 5/3.0 (-1) | 1,704 (+7%) | 6mo | $130,000 | $76 | 48 |
Match score weights: distance 35% · size 25% · config 20% · recency 20%. Top-matched comps best support the ARV.
Projected returns pro-forma
3.0% appreciation · 3.0% rent growth · sell at horizon
- IRR
- 12.8%
- Equity multiple
- 1.73×
- Total profit
- $53,062
- Equity at exit
- $116,907
- IRR
- 14.7%
- Equity multiple
- 3.18×
- Total profit
- $158,507
- Equity at exit
- $180,168
Cash invested: $72,800 (down + closing). Projections, not guarantees.
Landlord ↔ Tenant lean methodology
- Overall (STATE)
- 21 Tenant-Leaning
- State New Jersey
- 21 Tenant-Leaning · D+6
- County
- — inherits STATE
- City
- — inherits STATE
ZIP-level market 08608
- Active inventory
- 4
- Price-to-rent
- 8.2×
Monthly cashflow live
- Estimated rent
- $2,654 medium interval (Pro) →
- Mortgage (P&I)
- −$1,363
- Tax from tax record
- −$284 /mo · $3,404/yr
- Insurance
- −$108
- HOA
- −$0
- Vacancy / Maint / Mgmt
- −$557
- Net cashflow
- $341
Break-even live
UW: 25.0% down · 7.5% · 30yr · 1.5% tax · 5.0% vac · 8.0% maint · 8.0% mgmt
Financing live
Cash to close
- Down payment
- $65,000
- Closing costs
- $7,800
- Reserves months
- —
- Total cash needed
- —
Loan-product check · same deal, 3 products live
Conventional
25% down · 7.5% · 30yr
- Down + closing
- —
- Monthly P&I
- —
- Monthly cashflow
- —
- DSCR
- —
- Eligible?
- —
Personal DTI + credit; lowest rate.
DSCR
20% down · 8.5% · 30yr
- Down + closing
- —
- Monthly P&I
- —
- Monthly cashflow
- —
- DSCR
- —
- Eligible?
- —
No personal income docs; deal must DSCR.
Hard money
10% down · 12.0% · 12mo
- Down + closing
- —
- Monthly P&I
- —
- Monthly cashflow
- —
- DSCR
- —
- Eligible?
- —
Short-term bridge; refi at stabilization.
Rent comps 4 comps
| Address | Beds | Baths | Sqft | Rent | $/sqft | DOM | Units | Dist |
|---|---|---|---|---|---|---|---|---|
| 223 Spring St Trenton, NJ | 6.0 | 2.0 | 1490 | $2,700 | $1.81 | 4d | 1 | 0.54mi |
| 510 W Hanover St Trenton, NJ | 5.0 | 1.0 | 1200 | $2,200 | $1.83 | 13d | 1 | 0.66mi |
| 649 W State St Trenton, NJ | 5.0 | 2.0 | 1870 | $2,900 | $1.55 | 12d | 1 | 1.14mi |
| 510 N Hermitage Ave Trenton, NJ | 5.0 | 1.5 | 1316 | $2,500 | $1.90 | 12d | 1 | 1.21mi |
Listing history 43 events
-
2026-06-18days on market $260,000 Active 66 DOM
-
2026-06-17days on market $260,000 Active 65 DOM
-
2026-06-16days on market $260,000 Active 64 DOM
-
2026-06-15days on market $260,000 Active 63 DOM
-
2026-06-14days on market $260,000 Active 61 DOM
-
2026-06-10days on market $260,000 Active 58 DOM
-
2026-06-09days on market $260,000 Active 57 DOM
-
2026-06-08days on market $260,000 Active 56 DOM
-
2026-06-07days on market $260,000 Active 55 DOM
-
2026-06-03days on market $260,000 Active 51 DOM
-
2026-06-02days on market $260,000 Active 50 DOM
-
2026-06-01days on market $260,000 Active 49 DOM
-
2026-05-31days on market $260,000 Active 48 DOM
-
2026-05-30days on market $260,000 Active 47 DOM
-
2026-05-20price $260,000
-
2026-05-08price $260,000 948-char remark
Show marketing remark (948 chars)
Attention Investors: Turnkey, cash-flowing multi-family opportunity!This solid brick, two-family property is in excellent condition with no known repairs needed a truly low-maintenance addition to your portfolio. refreshed in 2023. Located just steps away form the state building. The building boasts hardwood floors throughout and is fully occupied by outstanding, current tenants.Unit 1: A comfortable first-floor, 1-bedroom, 1-bathroom layout featuring exclusive access to a private backyard.Unit 2: A spacious, multi-level unit spanning the second and third floors. It features an eat-in kitchen, a large bathroom, and a generous living room accented with built-in shelves. The top floor houses two nice-sized bedroomsThe property includes a full, unfished basement. Tenants pay for their own electric, while the owner covers heat and water. With reliable rental income already in place, this building is ready to generate revenue from day one!
-
2026-04-23price $280,000 948-char remark
Show marketing remark (948 chars)
Attention Investors: Turnkey, cash-flowing multi-family opportunity!This solid brick, two-family property is in excellent condition with no known repairs needed a truly low-maintenance addition to your portfolio. refreshed in 2023. Located just steps away form the state building. The building boasts hardwood floors throughout and is fully occupied by outstanding, current tenants.Unit 1: A comfortable first-floor, 1-bedroom, 1-bathroom layout featuring exclusive access to a private backyard.Unit 2: A spacious, multi-level unit spanning the second and third floors. It features an eat-in kitchen, a large bathroom, and a generous living room accented with built-in shelves. The top floor houses two nice-sized bedroomsThe property includes a full, unfished basement. Tenants pay for their own electric, while the owner covers heat and water. With reliable rental income already in place, this building is ready to generate revenue from day one!
-
2026-04-13$330,000 Active
-
2026-04-09$330,000 Active 948-char remark
Show marketing remark (948 chars)
Attention Investors: Turnkey, cash-flowing multi-family opportunity!This solid brick, two-family property is in excellent condition with no known repairs needed a truly low-maintenance addition to your portfolio. refreshed in 2023. Located just steps away form the state building. The building boasts hardwood floors throughout and is fully occupied by outstanding, current tenants.Unit 1: A comfortable first-floor, 1-bedroom, 1-bathroom layout featuring exclusive access to a private backyard.Unit 2: A spacious, multi-level unit spanning the second and third floors. It features an eat-in kitchen, a large bathroom, and a generous living room accented with built-in shelves. The top floor houses two nice-sized bedroomsThe property includes a full, unfished basement. Tenants pay for their own electric, while the owner covers heat and water. With reliable rental income already in place, this building is ready to generate revenue from day one!
-
2020-02-14status Pending
-
2020-02-14historical
-
2020-02-07$125,000 Active
-
2018-02-05soldstatus $89,000
-
2018-01-31soldstatus $89,000 Sold
-
2018-01-31soldstatus $89,000
-
2017-08-24historical Contingent - Other
-
2017-06-19$99,000 Active
-
2017-06-18$99,000
-
2014-12-31historical
-
2014-01-06$95,000
-
2013-08-22historical
-
2013-01-22$100,000
-
2012-08-29historical
-
2012-02-29$100,000
-
2011-11-30historical
-
2011-04-23$109,000
-
2010-07-31historical
-
2010-01-31$120,000
-
2002-09-16soldstatus $50,000
-
2002-09-05soldstatus $50,000
-
2002-05-29historical
-
2001-11-01$50,000
-
1986-02-28soldstatus $120,000
ⓘ Source: listings_history table (triggers on properties + properties_extension) + one-shot
backfill from property_details.listing_events for pre-trigger history.
Tax reassessment forecast NJ · Partial reset (capped growth)
- Current annual tax
- $3,404 · $284/mo
- Projected year-2 tax
- $4,939 · $412/mo
- Expected delta
- +$1,535/yr (+$128/mo · 45.1%)
ⓘ Screening estimate from a state-policy table — verify with the county assessor before closing.
Climate risk First Street
- Flood 4/10 Moderate FEMA zone X (unshaded) · 23% chance over 30 yrs
- Wildfire 1/10 Low
- Heat 7/10 Severe 7 d/yr ≥103°F today · 15 d/yr by 30 yrs out
- Wind 6/10 Major 27% chance of damaging wind over 30 yrs
- Air quality 5/10 Major 6 unhealthy d/yr today · 8 by 30 yrs out
Nearby sold comps map
Loading sold comps map…
Walkable amenities ~0.75 mi
Loading nearby amenities…
Taxation est. · year 1
- Rental income
- $31,848
- − Mortgage interest
- −$14,564
- − Property taxes
- −$3,404
- − Insurance
- −$1,300
- − Repairs & maintenance
- −$2,548
- − Management
- −$2,548
- − Depreciation
- −$7,564
- Taxable loss
- −$80
- Est. tax savings @ 24.0%
- +$19
- After-tax cash flow
- $4,113/yr
For passive investors: Depreciation is non-cash, so a rental often shows a tax loss while cash-flowing — sheltering income. Rental losses are passive: they offset passive income freely, and up to $25,000/yr can offset ordinary (W-2) income if you actively participate and your MAGI is under $100k (phasing out to $0 by $150k); unused losses carry forward. On sale, claimed depreciation is recaptured at up to 25%, and gains may owe capital-gains tax (a 1031 exchange can defer both). Figures are a year-1 estimate at your 24.0% rate — not tax advice; consult a CPA.
Schools (NCES district)
- District
- Trenton Public School District
- NCES district ID
- 3416290
- Math proficiency
- 2% ▼ -8.00%
- Reading proficiency
- 16% ▼ -4.00%
- Median HH income
- $35,078
- Composite
- 7.31/100
- National rank
- #9956
- State rank
- #471 of 472 in NJ
Livability — Trenton
- Score
- 76/100
- State rank
- #133
- US rank
- #3533
Category grades
Schools grade is shown separately in the Schools card above.
Census & demographics
- Census place
- Trenton, NJ
- County
- Mercer County · 327,655 people
- City population
- 177,819
- Metro
- Trenton-Princeton, NJ
- Population (ZIP)
- 1,250
- Household income
- $61,201
- Rent vs Own
- Severe rent burden
- 107.0
Population outlook (Mercer County) Hauer SSP2
- Today (2025)
- 381,395 people
- By 2030
- 384,640 · +0.9%
- By 2040
- 391,431 · +2.6%
- By 2050
- 397,845 · +4.3%
- By 2075
- 417,281 · +9.4%
- By 2100
- 420,327 · +10.2%
Race, ethnicity, and origin ACS 2023
- Neighborhood character
- Diverse neighborhood (Simpson 0.57)
- Race & ethnicity
- Black 57% Hispanic / Latino 31% Two or more races 7% White 5% Native American 2%
- Hispanic origin (detail)
- Puerto Rican 3% Dominican 8%
- Common ancestry
- Hispanic 12%
- Foreign-born
- 27% · Canada, Jamaica
- Languages at home
- 70% English-only · Spanish 24% Arabic 6%
Political lean MEDSL · Mercer
- 2024 margin
- Solid D (+33.9) · D 65.9% · R 32.0% · Other 2.1%
- 2008→2024 swing
- -2.2pp toward R · 2008: 36.1pp · 2024: 33.9pp
- All cycles
- 2024: D+33.9 2020: D+40.0 2016: D+36.2 2012: D+36.8 2008: D+36.1
Not yet ingested
- Civics
- —
Market trends
- HPI YoY
- —
- Current HPI
- —
- Rent YoY
- —
- Metro
- Trenton-Princeton, NJ
- State GDP YoY
- ▲ 2.05%
- F500 in state
- 34
Industry mix (Fortune 500 HQ in NJ)
| Industry | F500 HQs | Revenue |
|---|---|---|
| Consumer Goods | 3 | $31B |
|
||
| Pharmaceuticals | 2 | $153B |
|
||
| Technology | 2 | $21B |
|
||
| Insurance | 2 | $20B |
|
||
| Healthcare | 2 | $19B |
|
||
| Financial Services | 1 | $70B |
|
||
Price history
+116.7% since first listed29 events — show timeline
- 2026-05-20 Price Changed $260,000 BRIGHT MLS
- 2026-05-08 Price Changed $260,000 GSMLS
- 2026-04-23 Price Changed $280,000 GSMLS
- 2026-04-13 Listed $330,000 BRIGHT MLS
- 2026-04-09 Listed $330,000 GSMLS
- 2020-02-14 Pending — BRIGHT MLS
- 2020-02-14 Listing Removed — BRIGHT MLS
- 2020-02-07 Listed $125,000 BRIGHT MLS
- 2018-02-05 Sold (Public Records) $89,000 Public Records
- 2018-01-31 Sold (MLS) $89,000 BRIGHT MLS
- 2018-01-31 Sold (MLS) $89,000 TREND
- 2017-08-24 Contingent — TREND
- 2017-06-19 Listed $99,000 TREND
- 2017-06-18 Listed $99,000 BRIGHT MLS
- 2014-12-31 Listing Removed — BRIGHT MLS
- 2014-01-06 Listed $95,000 BRIGHT MLS
- 2013-08-22 Listing Removed — BRIGHT MLS
- 2013-01-22 Listed $100,000 BRIGHT MLS
- 2012-08-29 Listing Removed — BRIGHT MLS
- 2012-02-29 Listed $100,000 BRIGHT MLS
- 2011-11-30 Listing Removed — BRIGHT MLS
- 2011-04-23 Listed $109,000 BRIGHT MLS
- 2010-07-31 Listing Removed — BRIGHT MLS
- 2010-01-31 Listed $120,000 BRIGHT MLS
- 2002-09-16 Sold (Public Records) $50,000 Public Records
- 2002-09-05 Sold (MLS) $50,000 BRIGHT MLS
- 2002-05-29 Listing Removed — BRIGHT MLS
- 2001-11-01 Listed $50,000 BRIGHT MLS
- 1986-02-28 Sold (Public Records) $120,000 Public Records
Property tax history
+3.9%/yrLatest (2025): $3,404 · +1.5% YoY. Source: county tax records.
Cash-flow waterfall
monthlySold comps — $/sqft
last 12 mo · ≤1 miLoading sold comps…