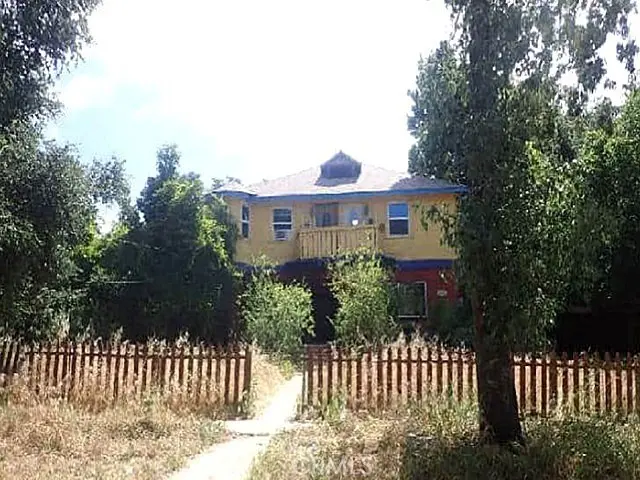
1944 El Sereno Ave · Pasadena, CA
Flood risk 3/10 · Minor
- FEMA flood zone
- X (unshaded)
- Chance of flooding over 30 yrs
- 0.1%
- Est. flood insurance / yr
- $507 – $1,088
Fire risk 1/10 · Minimal
- Est. fire insurance / yr
- $659 – $1,223
Heat risk 6/10 · Moderate
- Hot days now (above 97°F)
- 7 days/yr
- Hot days in 30 yrs
- 21 days/yr
Wind risk 1/10 · Minimal
- Chance of severe wind over 30 yrs
- —
Air-quality risk 6/10 · Moderate
- Unhealthy air days now
- 10 days/yr
- Unhealthy air days in 30 yrs
- 11 days/yr
Risk factors via First Street. Map © Google.
Why this score? — see what drove the D+ grade
The composite is a weighted blend of 9 inputs, each scored 0–100. Each bar is that input's sub-score; the figure is the points it added to the 100-point composite (weight × sub-score).
- ARV discount +15.0/15.0
- Cash flow +10.9/30.0
- Schools +4.6/10.0
- Livability +3.6/5.0
- Rent growth +3.5/5.0
- DSCR +3.2/10.0
- Condition / age +2.5/5.0
- 1% rule +1.9/10.0
- Appreciation +0.0/10.0
$1,077,700
🖨 Deal sheet (PDF) 📄 Offer letter ✓ Due diligence
Listing remarks
Discover the possibilities in this 2,518 sq ft residence located in Pasadena. Built in 1911, this single-family home offers 5 bedrooms, 2 bathroom, with a partially finished basement. The property sits on an approximately 19,007 sq ft rectangular lot and includes exterior features such as a fenced yard, patio/slab, and a fireplace, providing usable outdoor and interior utility. Exterior observation indicates the property is in average condition with typical wear for it's age. Positioned in a suburban setting with access to the 210 freeway, schools, shopping, and employment centers, the location supports everyday convenience and connectivity. . Buyers check City, County, Zoning, Tax, and
Key facts
- Fenced yard
- Patio slab
- Fireplace
Tags
Property features AI
Finance
- Other: Zoned Single Family Residential
- Financial info: Total units: 1; Lot described as 0-1 unit/acre (per assessor data); Lot and living area sourced from assessor; Assessments: Unknown
- HOA & community: Suburban neighborhood
Exterior
- Utilities: Public sewer; District/public water
- Home design: Single-family house; Two stories; No accessory dwelling unit; Entry facing first level
- Construction: Built year sourced from appraiser; Other construction materials; Other roof type; No common walls
- Exterior features: No pool
Interior
- Kitchen: No appliances listed
- Bedrooms: Five bedrooms on the main level
- Bathrooms: Two full bathrooms (main level)
- Heating & cooling: Forced air heating; Central air conditioning; Living room fireplace
- Interior features: Two levels; Main entry on the first level; Living room
- Laundry & utility: No laundry facilities listed
Neighborhood map
What this means for you Summary
Snapshot
- This is a 5-bed/2.0-bath single-family listed at $1.08M.
Deal economics
- At list price, monthly cash flow is $-479 ($-6k/yr) — negative.
- To cash-flow at today's rent, offer at most $993k (7.9% below list).
- To meet the 1% rule (rent ≥ 1% of price), the offer needs to be $745k (30.9% below list).
- Recommended offer: $745k (30.9% below list) — sets the bar for 1% rule.
- Cap rate 5.8% vs local median 1.5% in Pasadena — top-decile yield for the area; either an underpriced asset or a hidden risk that comps aren't pricing in. Stress-test before assuming the spread holds.
Location & tenants
- Location reads 72/100 on livability (#181 in CA) — a middle-class / working-renter tenant base. Strengths: amenities A+, commute A+, employment A+; Watch: health & safety D+, crime F, cost of living F.
- Pasadena Unified (urban): math 42% / reading 60% proficiency, ranked #123 of 517 in CA (top 24%) — acceptable for families but not a draw, mixed tenant base, ~2y average lease.
- Zoned schools: Jackson Elementary (628 students, 63% FRL); Octavia E. Butler Magnet (513 students, 89% FRL); John Muir High (math 24% / reading 75%, grade D+, #332 of 1,170 statewide, top 30%, 1,012 students, 85% FRL) — zoned schools average 79% FRL vs 55% district-wide (24 pts higher); higher-poverty schools than district average — tighter screening recommended.
- Market conditions: Rents rising (+3.9%/yr); 37 active listings in the ZIP; 2 comparable units currently listed for rent nearby; solid renter incomes; 19,697 units permitted in Los Angeles County in 2024 (9,426 in 5+ unit buildings).
- At $7,447/mo this rent would consume 95% of the median local household income ($94k/yr) (locally 1402% of renters already pay >50% of income on rent) — very limited rent-growth headroom before tenants either downsize or default.
Forward outlook
- Local home prices are declining (-3.0%/yr); year-one equity from $7k of loan paydown is wiped out by about $32k of value loss. Plan a longer hold.
- Los Angeles County population projected at +9% by 2050 — modest demand growth; plan on rents tracking national, not racing it.
Negotiation context
- It's been on market 37 days — a 3% lower offer ($1.05M) is reasonable based on typical stale-listing flexibility.
- 11 sale attempts since 2y ago; this cycle's ask has dropped $162k (13%) from the opening price — seller is motivated, your offer sets the floor, not the list.
- Current owner paid $128k; list at $1.08M implies a 742% gain — meaningful room to come down on a strong offer.
Risks & watch-outs
- Watch-outs: built in 1911 — expect roof / HVAC / electrical / plumbing capex.
- Climate carrying-cost: extreme-heat days projected 7→21/yr by 2055 (HVAC capex compounding) — expect insurance premiums to compound above CPI over the hold.
Questions for the listing agent
- What do current leases actually rent for vs. the listed asking? Can we see a recent rent roll and the last 12 months of T-12 income?
- It's been on market 37 days. Have you received any prior offers? Is the seller open to a 31% concession, seller financing, or rate buy-down credit?
- Built in 1911 — when were the roof, HVAC, electrical panel, plumbing, and water heater last replaced?
- Is there a deadline driving the sale (1031 exchange, divorce, estate, relocation)? That informs how much negotiation room exists.
- Schools are D-rated, which usually means shorter tenancies and higher turnover. Who's the typical renter profile here, and what's been the actual vacancy rate?
- Crime grade is F in this area — have there been break-ins, vandalism, or insurance claims at this property in the last 3 years? What carrier currently insures it and at what premium?
- The area grade is low — what's the realistic commute time and amenity access for the typical tenant pool here? Any planned neighborhood developments (good or bad) we should know about?
- What's the average days-on-market for RENTAL listings here right now (not sales)? A rising rental-DOM trend means longer vacancies and softer asking-rent achievability than the comps imply.
- What's the recent tenant-quality profile in this submarket — average credit score on applications, eviction rate, late-payment / NSF rate, and stable-employment percentage? A property-management company in the area should have these aggregated.
- How much new for-sale + rental construction is in the pipeline within 1–3 miles? Heavy new supply typically softens prices + rents 12–24 months out; constrained supply supports both.
Investment metrics
- 1% rule
- 0.69% ✗
- Cap rate
- 5.76%
- Cash-on-cash
- -1.91%
- DSCR
- 0.92
- GRM
- 12.1
CMA / ARV
- ARV (median comp)
- $1,487,077
- List price
- $1,077,700
- Delta
- -27.53%
- Verdict
- UNDERPRICED
- Comps
- 20 within 1.0 mi
Show comp detail 4 sales within ~0.75 mi
| Address | Dist | Beds/Ba | Sqft | Sold | Price | $/sf | Match |
|---|---|---|---|---|---|---|---|
| 1764 N Raymond Ave | 0.27mi | 5/2.0 | 2,450 (-3%) | 7mo | $1,150,000 | $469 | 77 |
| 1955 N Los Robles Ave | 0.57mi | 5/3.0 | 2,670 (+6%) | 0mo | $1,910,000 | $715 | 59 |
| 1725 N Marengo Ave | 0.39mi | 5/4.0 | 2,327 (-8%) | 13mo | $1,725,000 | $741 | 51 |
| 345 Figueroa Dr | 0.66mi | 4/4.0 (-1) | 2,156 (-14%) | 13mo | $1,625,000 | $754 | 22 |
Match score weights: distance 35% · size 25% · config 20% · recency 20%. Top-matched comps best support the ARV.
Projected returns pro-forma
-3.0% appreciation · 3.93% rent growth · sell at horizon
- IRR
- -18.6%
- Equity multiple
- 0.34×
- Total profit
- $-198,693
- Equity at exit
- $160,689
- IRR
- -9.7%
- Equity multiple
- 0.39×
- Total profit
- $-185,183
- Equity at exit
- $93,180
Cash invested: $301,756 (down + closing). Projections, not guarantees.
Landlord ↔ Tenant lean methodology
- Overall (STATE)
- 18 Strongly Tenant-Friendly
- State California
- 18 Strongly Tenant-Friendly · D+13
- County
- — inherits STATE
- City
- — inherits STATE
ZIP-level market 91103
- Rents YoY
- 3.9%
- Active inventory
- 37
- Price-to-rent
- 12.1×
Monthly cashflow live
- Estimated rent
- $7,447 medium interval (Pro) →
- Mortgage (P&I)
- −$5,652
- Tax from tax record
- −$262 /mo · $3,142/yr
- Insurance
- −$449
- HOA
- −$0
- Vacancy / Maint / Mgmt
- −$1,564
- Net cashflow
- $-479
Break-even live
Sensitivity live
| Price | -10% $131 | -5% $-174 | +0% $-479 | +5% $-784 | +10% $-1,090 |
|---|---|---|---|---|---|
| Rent | -10% $-1,068 | -5% $-774 | +0% $-479 | +5% $-185 | +10% $109 |
| Rate | -1.0pp $63 | -0.5pp $-205 | base $-479 | +0.5pp $-759 | +1.0pp $-1,043 |
UW: 25.0% down · 7.5% · 30yr · 1.5% tax · 5.0% vac · 8.0% maint · 8.0% mgmt
Financing live
Cash to close
- Down payment
- $269,425
- Closing costs
- $32,331
- Reserves months
- —
- Total cash needed
- —
Loan-product check · same deal, 3 products live
Conventional
25% down · 7.5% · 30yr
- Down + closing
- —
- Monthly P&I
- —
- Monthly cashflow
- —
- DSCR
- —
- Eligible?
- —
Personal DTI + credit; lowest rate.
DSCR
20% down · 8.5% · 30yr
- Down + closing
- —
- Monthly P&I
- —
- Monthly cashflow
- —
- DSCR
- —
- Eligible?
- —
No personal income docs; deal must DSCR.
Hard money
10% down · 12.0% · 12mo
- Down + closing
- —
- Monthly P&I
- —
- Monthly cashflow
- —
- DSCR
- —
- Eligible?
- —
Short-term bridge; refi at stabilization.
Rent comps 2 comps
| Address | Beds | Baths | Sqft | Rent | $/sqft | DOM | Units | Dist |
|---|---|---|---|---|---|---|---|---|
| 2163 Santa Rosa Ave Altadena, CA | 5.0 | 4.0 | 2400 | $8,750 | $3.65 | 45d | 1 | 0.75mi |
| 514 W Washington Blvd Pasadena, CA | 4.0 | 3.5 | 3544 | $8,900 | $2.51 | 9d | 1 | 0.83mi |
Listing history 36 events
-
2026-06-21days on market $1,077,700 Active 37 DOM
-
2026-06-18days on market $1,077,700 Active 34 DOM
-
2026-06-17days on market $1,077,700 Active 33 DOM
-
2026-06-16days on market $1,077,700 Active 32 DOM
-
2026-06-15days on market $1,077,700 Active 31 DOM
-
2026-06-13days on market $1,077,700 Active 29 DOM
-
2026-06-13days on market $1,077,700 Active 28 DOM
-
2026-06-09days on market $1,077,700 Active 25 DOM
-
2026-06-08pricedays on market $1,077,700 Active 24 DOM
-
2026-06-07days on market $1,240,200 Active 23 DOM
-
2026-06-04days on market $1,240,200 Active 20 DOM
-
2026-06-03days on market $1,240,200 Active 19 DOM
-
2026-06-02days on market $1,240,200 Active 18 DOM
-
2026-06-01days on market $1,240,200 Active 17 DOM
-
2026-05-31days on market $1,240,200 Active 16 DOM
-
2026-05-15$1,240,200 Active 756-char remark
-
2026-04-29$800,000 Active
-
2026-03-19status Pending Sale
-
2026-03-19historical
-
2026-03-19$800,000 Active
-
2026-03-18historical
-
2026-02-05$1,400,000 Active
-
2026-02-04historical
-
2026-01-08price $1,350,000
-
2025-12-16status Active
-
2025-12-03status Pending Sale
-
2025-10-03$1,550,000 Active
-
2025-09-23historical
-
2025-06-27status Active
-
2025-06-27price $1,600,000
-
2025-06-10status Active
-
2025-05-10status Active
-
2025-04-09$900,000 Active
-
2024-11-14Active
-
2001-01-09soldstatus $128,000
-
1999-09-21soldstatus $140,000
ⓘ Source: listings_history table (triggers on properties + properties_extension) + one-shot
backfill from property_details.listing_events for pre-trigger history.
Tax reassessment forecast CA · Resets to sale price
- Current annual tax
- $3,142 · $262/mo
- Projected year-2 tax
- $8,191 · $683/mo
- Expected delta
- +$5,049/yr (+$421/mo · 160.7%)
ⓘ Screening estimate from a state-policy table — verify with the county assessor before closing.
Climate risk First Street
- Flood 3/10 Moderate FEMA zone X (unshaded) · 10% chance over 30 yrs
- Wildfire 1/10 Low
- Heat 6/10 Major 7 d/yr ≥97°F today · 21 d/yr by 30 yrs out
- Wind 1/10 Low
- Air quality 6/10 Major 10 unhealthy d/yr today · 11 by 30 yrs out
Nearby sold comps map
Loading sold comps map…
Walkable amenities ~0.75 mi
Loading nearby amenities…
Taxation est. · year 1
- Rental income
- $89,362
- − Mortgage interest
- −$60,368
- − Property taxes
- −$3,142
- − Insurance
- −$5,388
- − Repairs & maintenance
- −$7,149
- − Management
- −$7,149
- − Depreciation
- −$31,351
- Taxable loss
- −$25,186
- Est. tax savings @ 24.0%
- +$6,045
- After-tax cash flow
- $291/yr
For passive investors: Depreciation is non-cash, so a rental often shows a tax loss while cash-flowing — sheltering income. Rental losses are passive: they offset passive income freely, and up to $25,000/yr can offset ordinary (W-2) income if you actively participate and your MAGI is under $100k (phasing out to $0 by $150k); unused losses carry forward. On sale, claimed depreciation is recaptured at up to 25%, and gains may owe capital-gains tax (a 1031 exchange can defer both). Figures are a year-1 estimate at your 24.0% rate — not tax advice; consult a CPA.
Schools (NCES district)
- District
- Pasadena Unified
- NCES district ID
- 0629940
- Math proficiency
- 42% ▲ 7.00%
- Reading proficiency
- 60% ▲ 15.00%
- Median HH income
- $73,762
- Composite
- 45.82/100
- National rank
- #2557
- State rank
- #123 of 517 in CA
Livability — Pasadena
- Score
- 72/100
- State rank
- #181
- US rank
- #5981
Category grades
Schools grade is shown separately in the Schools card above.
Census & demographics
- Census place
- Pasadena, CA
- County
- Los Angeles County · 9,444,647 people
- City population
- 151,001
- Metro
- Los Angeles-Long Beach-Anaheim, CA
- Population (ZIP)
- 25,142
- Household income
- $93,660
- Rent vs Own
- Severe rent burden
- 1402.0
Population outlook (Los Angeles County) Hauer SSP2
- Today (2025)
- 10,940,515 people
- By 2030
- 11,256,481 · +2.9%
- By 2040
- 11,729,929 · +7.2%
- By 2050
- 11,948,407 · +9.2%
- By 2075
- 11,818,114 · +8.0%
- By 2100
- 10,842,928 · -0.9%
Race, ethnicity, and origin ACS 2023
- Neighborhood character
- Highly diverse neighborhood (Simpson 0.70)
- Race & ethnicity
- Hispanic / Latino 45% White 24% Black 14% Asian 12% Two or more races 12%
- Hispanic origin (detail)
- Mexican 32%
- Common ancestry
- Portuguese 1% Lithuanian 1% Slovak 1%
- Foreign-born
- 30% · Canada, China, South Korea
- Languages at home
- 50% English-only · Spanish 38% Tagalog/Filipino 3% Other Indo-European 3%
Political lean MEDSL · Los Angeles
- 2024 margin
- Solid D (+32.9) · D 64.8% · R 31.9% · Other 3.3%
- 2008→2024 swing
- -7.4pp toward R · 2008: 40.4pp · 2024: 32.9pp
- All cycles
- 2024: D+32.9 2020: D+44.2 2016: D+48.0 2012: D+40.0 2008: D+40.4
Not yet ingested
- Civics
- —
Market trends
- HPI YoY
- ▼ -1048.65%
- Current HPI
- 475.0792
- Rent YoY
- ▲ 3.93%
- Metro
- Los Angeles-Long Beach-Anaheim, CA
- State GDP YoY
- ▲ 3.21%
- F500 in state
- 116
Industry mix (Fortune 500 HQ in CA)
| Industry | F500 HQs | Revenue |
|---|---|---|
| Technology | 27 | $1,492B |
|
||
| Financial Services | 3 | $174B |
|
||
| Retail | 3 | $44B |
|
||
| Insurance | 3 | $26B |
|
||
| Media / Entertainment | 2 | $115B |
|
||
| Pharmaceuticals / Biotech | 2 | $62B |
|
||
Price history
+669.8% since first listed22 events — show timeline
- 2026-06-08 Price Changed $1,077,700 CRMLS
- 2026-05-15 Listed $1,240,200 CRMLS
- 2026-04-29 Listed $800,000 CRMLS
- 2026-03-19 Pending — CRMLS
- 2026-03-19 Listing Removed — CRMLS
- 2026-03-19 Listed $800,000 CRMLS
- 2026-03-18 Listing Removed — CRMLS
- 2026-02-05 Listed $1,400,000 CRMLS
- 2026-02-04 Listing Removed — CRMLS
- 2026-01-08 Price Changed $1,350,000 CRMLS
- 2025-12-16 Relisted — CRMLS
- 2025-12-03 Pending — CRMLS
- 2025-10-03 Listed $1,550,000 CRMLS
- 2025-09-23 Listing Removed — CRMLS
- 2025-06-27 Relisted — CRMLS
- 2025-06-27 Price Changed $1,600,000 CRMLS
- 2025-06-10 Relisted — CRMLS
- 2025-05-10 Relisted — CRMLS
- 2025-04-09 Listed $900,000 CRMLS
- 2024-11-14 Listed — TheMLS
- 2001-01-09 Sold (Public Records) $128,000 Public Records
- 1999-09-21 Sold (Public Records) $140,000 Public Records
Property tax history
+2.3%/yrLatest (2025): $3,142 · +6.7% YoY. Source: county tax records.
Cash-flow waterfall
monthlySold comps — $/sqft
last 12 mo · ≤1 miLoading sold comps…