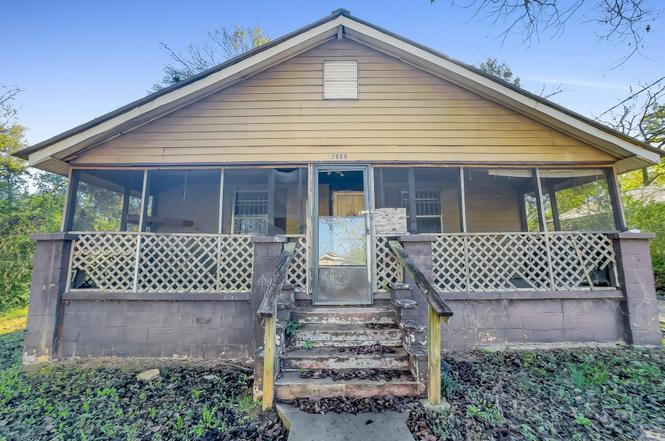
2009 Dawson Ave · Lipscomb, AL
Flood risk 1/10 · Minimal
- FEMA flood zone
- X (unshaded)
- Chance of flooding over 30 yrs
- 0.0%
- Est. flood insurance / yr
- $507 – $1,088
Fire risk 3/10 · Minor
- Est. fire insurance / yr
- $916 – $1,700
Heat risk 7/10 · Major
- Hot days now (above 107°F)
- 7 days/yr
- Hot days in 30 yrs
- 19 days/yr
Wind risk 6/10 · Moderate
- Chance of severe wind over 30 yrs
- 27.0%
Air-quality risk 3/10 · Minor
- Unhealthy air days now
- 2 days/yr
- Unhealthy air days in 30 yrs
- 5 days/yr
Risk factors via First Street. Map © Google.
Why this score? — see what drove the B grade
The composite is a weighted blend of 9 inputs, each scored 0–100. Each bar is that input's sub-score; the figure is the points it added to the 100-point composite (weight × sub-score).
- Cash flow +30.0/30.0
- ARV discount +15.0/15.0
- 1% rule +10.0/10.0
- DSCR +10.0/10.0
- Livability +3.4/5.0
- Condition / age +2.5/5.0
- Schools +1.8/10.0
- Rent growth +1.7/5.0
- Appreciation +0.0/10.0
$32,500
🖨 Deal sheet (PDF) 📄 Offer letter ✓ Due diligence
Listing remarks
Discover 2009 Dawson Ave, a promising investment opportunity for savvy buyers and investors alike. This charming residential home offers a blend of potential and practicality, making it an ideal addition to your real estate portfolio. Ideal for those looking to renovate or generate rental income. Conveniently located near local amenities and schools, enhancing its appeal for future tenants or buyers. Don’t miss the chance to explore and realize the possibilities this property presents. Schedule your showing today!
Key facts
- 6,969 sq ft lot
- Built 1950
- Listed 88 days
Neighborhood map
What this means for you Summary
Snapshot
- This is a 2-bed/1.0-bath single-family listed at $32k.
Deal economics
- At list price, monthly cash flow is $610 ($7k/yr) — positive.
- The deal already cash-flows at list — no discount required.
- Meets the 1% rule at list price ($1k rent vs $32k).
- Recommended offer: $31k (6.0% below list) — sets the bar for market timing.
Location & tenants
- Location reads 67/100 on livability (#76 in AL) — a middle-class / working-renter tenant base. Strengths: crime A+, commute A+, cost of living A+; Watch: amenities F, employment F, health & safety F.
- Jefferson County (suburban): math 9% / reading 32% proficiency, ranked #104 of 129 in AL (top 81%) — low school quality limits family demand, transient renter base, plan for 1-2y turnover.
- Zoned schools: Lipscomb Elementary School (math 8% / reading 27%, grade F, #486 of 627 statewide, top 79%, 259 students, 96% FRL); Mcadory Middle School (math 2% / reading 33%, grade F, #199 of 257 statewide, top 77%, 854 students, 74% FRL); Mcadory High School (math 8% / reading 17%, grade F, #237 of 305 statewide, top 78%, 1,162 students, 72% FRL) — zoned schools average 81% FRL vs 49% district-wide (32 pts higher); higher-poverty schools than district average — tighter screening recommended.
- Market conditions: Rents falling (-3.1%/yr); 116 active listings in the ZIP; 25 comparable units currently listed for rent nearby; rentals at typical pace (median 26d on market — plan ~3-4 weeks tenant-placement turnaround); 44% of comp listings sitting > 30 days — soft ceiling on asking rent; lower-income renter base — watch delinquency; 2,114 units permitted in Jefferson County in 2024 (556 in 5+ unit buildings).
- This rent runs 36% of the median local income ($35k/yr) — at the standard rent-burdened threshold; future hikes will face affordability resistance.
Forward outlook
- Local home prices are declining (-3.0%/yr); year-one equity from $225 of loan paydown is wiped out by about $975 of value loss. Plan a longer hold.
- Jefferson County population projected to shrink 4% by 2050 — rents likely to lag national; underwrite the cash flow, not the appreciation.
- At projected returns (-3.0% appreciation + 0.0% rent growth), your $9k cash investment doubles in ~2 years — after that, you're playing with house money.
Negotiation context
- It's been on market 88 days — a 6% lower offer ($31k) is reasonable based on typical stale-listing flexibility.
- Current owner paid $19k; list at $32k implies a 75% gain — meaningful room to come down on a strong offer.
Risks & watch-outs
- Watch-outs: built in 1950 — expect roof / HVAC / electrical / plumbing capex.
- Climate carrying-cost: major wind risk, 27% chance of damaging wind over 30y; extreme-heat days projected 7→19/yr by 2055 (HVAC capex compounding) — expect insurance premiums to compound above CPI over the hold.
Questions for the listing agent
- It's been on market 88 days. Have you received any prior offers? Is the seller open to a 6% concession, seller financing, or rate buy-down credit?
- Built in 1950 — when were the roof, HVAC, electrical panel, plumbing, and water heater last replaced?
- Why hasn't it sold? Are there any deal-killer items the seller is aware of (foundation, flood, title, zoning, code violations)?
- Is there a deadline driving the sale (1031 exchange, divorce, estate, relocation)? That informs how much negotiation room exists.
- Schools are F-rated, which usually means shorter tenancies and higher turnover. Who's the typical renter profile here, and what's been the actual vacancy rate?
- What's the average days-on-market for RENTAL listings here right now (not sales)? A rising rental-DOM trend means longer vacancies and softer asking-rent achievability than the comps imply.
- What's the recent tenant-quality profile in this submarket — average credit score on applications, eviction rate, late-payment / NSF rate, and stable-employment percentage? A property-management company in the area should have these aggregated.
- How much new for-sale + rental construction is in the pipeline within 1–3 miles? Heavy new supply typically softens prices + rents 12–24 months out; constrained supply supports both.
Investment metrics
- 1% rule
- 3.25% ✓
- Cap rate
- 28.81%
- Cash-on-cash
- 80.41%
- DSCR
- 4.58
- GRM
- 2.6
CMA / ARV
- ARV (on-the-fly)
- $58,464
- Comps found
- 9
Show comp detail 9 sales within ~0.75 mi
| Address | Dist | Beds/Ba | Sqft | Sold | Price | $/sf | Match |
|---|---|---|---|---|---|---|---|
| 724 Illinois Rd | 0.35mi | 3/1.5 (+1) | 1,008 (0%) | 8mo | $110,000 | $109 | 70 |
| 830 Burwell St | 0.52mi | 3/1.5 (+1) | 1,011 (+0%) | 3mo | $80,000 | $79 | 66 |
| 5121 Molton Gray Dr | 0.52mi | 2/1.0 | 1,040 (+3%) | 13mo | $33,500 | $32 | 60 |
| 5741 King Dr | 0.61mi | 3/1.0 (+1) | 1,009 (+0%) | 14mo | $45,000 | $45 | 55 |
| 5737 King Dr | 0.60mi | 3/1.5 (+1) | 1,056 (+5%) | 15mo | $43,000 | $41 | 45 |
| 932 Airview St | 0.69mi | 3/1.0 (+1) | 1,026 (+2%) | 19mo | $46,500 | $45 | 44 |
| 908 Burwell St | 0.61mi | 3/1.0 (+1) | 864 (-14%) | 12mo | $124,900 | $145 | 33 |
| 734 New Hill Ct | 0.68mi | 2/1.0 | 889 (-12%) | 20mo | $65,500 | $74 | 32 |
| 932 Burwell St | 0.69mi | 3/1.0 (+1) | 864 (-14%) | 15mo | $50,000 | $58 | 27 |
Match score weights: distance 35% · size 25% · config 20% · recency 20%. Top-matched comps best support the ARV.
Projected returns pro-forma
-3.0% appreciation · 0.0% rent growth · sell at horizon
- IRR
- 77.2%
- Equity multiple
- 4.35×
- Total profit
- $30,492
- Equity at exit
- $4,846
- IRR
- 80.0%
- Equity multiple
- 8.11×
- Total profit
- $64,672
- Equity at exit
- $2,810
Cash invested: $9,100 (down + closing). Projections, not guarantees.
Landlord ↔ Tenant lean methodology
- Overall (STATE)
- 90 Strongly Landlord-Friendly
- State Alabama
- 90 Strongly Landlord-Friendly · R+15
- County
- — inherits STATE
- City
- — inherits STATE
ZIP-level market 35020
- Home prices YoY
- -24.2%
- Rents YoY
- -3.1%
- Active inventory
- 116
- Price-to-rent
- 2.6×
Monthly cashflow live
- Estimated rent
- $1,055 high interval (Pro) →
- Mortgage (P&I)
- −$170
- Tax from tax record
- −$40 /mo · $478/yr
- Insurance
- −$14
- HOA
- −$0
- Vacancy / Maint / Mgmt
- −$222
- Net cashflow
- $610
Break-even live
Sensitivity live
| Price | -10% $628 | -5% $619 | +0% $610 | +5% $601 | +10% $591 |
|---|---|---|---|---|---|
| Rent | -10% $526 | -5% $568 | +0% $610 | +5% $651 | +10% $693 |
| Rate | -1.0pp $626 | -0.5pp $618 | base $610 | +0.5pp $601 | +1.0pp $593 |
UW: 25.0% down · 7.5% · 30yr · 1.5% tax · 5.0% vac · 8.0% maint · 8.0% mgmt
Financing live
Cash to close
- Down payment
- $8,125
- Closing costs
- $975
- Reserves months
- —
- Total cash needed
- —
Loan-product check · same deal, 3 products live
Conventional
25% down · 7.5% · 30yr
- Down + closing
- —
- Monthly P&I
- —
- Monthly cashflow
- —
- DSCR
- —
- Eligible?
- —
Personal DTI + credit; lowest rate.
DSCR
20% down · 8.5% · 30yr
- Down + closing
- —
- Monthly P&I
- —
- Monthly cashflow
- —
- DSCR
- —
- Eligible?
- —
No personal income docs; deal must DSCR.
Hard money
10% down · 12.0% · 12mo
- Down + closing
- —
- Monthly P&I
- —
- Monthly cashflow
- —
- DSCR
- —
- Eligible?
- —
Short-term bridge; refi at stabilization.
Rent comps 25 comps
| Address | Beds | Baths | Sqft | Rent | $/sqft | DOM | Units | Dist |
|---|---|---|---|---|---|---|---|---|
| 830 Burwell St Birmingham, AL | 3.0 | 1.5 | 1011 | $1,200 | $1.19 | 45d | 1 | 0.50mi |
| 5704 14th St S Bessemer, AL | 2.0 | 2.0 | 1024 | $850 | $0.83 | 17d | 1 | 0.63mi |
| 5709 13th St S Bessemer, AL | 3.0 | 1.0 | 1120 | $1,200 | $1.07 | 45d | 1 | 0.66mi |
| 6001 Ivy St Birmingham, AL | 3.0 | 1.0 | 906 | $950 | $1.05 | 45d | 1 | 1.04mi |
| 4009 Grasselli Ave SW Birmingham, AL | 3.0 | 1.0 | 875 | $900 | $1.03 | 25d | 1 | 1.11mi |
| 5703 Avenue O Unit O Bessemer, AL | 2.0 | 1.0 | 936 | $800 | $0.85 | 45d | 1 | 1.13mi |
| 1721 Collier Dr Birmingham, AL | 2.0 | 1.0 | 925 | $800 | $0.86 | 45d | 1 | 1.14mi |
| 4120 George Ave SW Birmingham, AL | 2.0 | 1.0 | 944 | $850 | $0.90 | 25d | 1 | 1.15mi |
| 537 Grant St Birmingham, AL | 3.0 | 1.0 | 1444 | $1,200 | $0.83 | 25d | 1 | 1.18mi |
| 520 Brewer Dr Bessemer, AL | 3.0 | 1.0 | 1040 | $1,100 | $1.06 | 5d | 1 | 1.20mi |
| 3640 Wenonah Rd SW Birmingham, AL | 3.0 | 2.0 | 1100 | $1,195 | $1.09 | 13d | 1 | 1.21mi |
| 3640 Wenonah Rd SW Birmingham, AL | 3.0 | 2.0 | 1100 | $1,195 | $1.09 | 25d | 1 | 1.21mi |
| 36 Wilkes Cir Birmingham, AL | 2.0 | 1.0 | 762 | $875 | $1.15 | 45d | 1 | 1.21mi |
| 517 Grant St Birmingham, AL | 3.0 | 1.0 | 912 | $850 | $0.93 | 25d | 1 | 1.22mi |
| 5912 Owen St Bessemer, AL | 3.0 | 1.5 | 1192 | $1,300 | $1.09 | 45d | 1 | 1.22mi |
| 4029 Walnut Ave SW Birmingham, AL | 2.0 | 1.0 | 1300 | $1,369 | $1.05 | 5d | 1 | 1.23mi |
| 5906 5th St S Bessemer, AL | 2.0 | 1.0 | 916 | $900 | $0.98 | 25d | 1 | 1.25mi |
| 925 Woodward Rd Birmingham, AL | 2.0 | 2.0 | 1104 | $950 | $0.86 | 45d | 1 | 1.31mi |
| 923 Woodward Rd Birmingham, AL | 3.0 | 1.0 | 1273 | $1,200 | $0.94 | 25d | 1 | 1.31mi |
| 3720 Howard Ave SW Birmingham, AL | 3.0 | 1.0 | 1092 | $1,200 | $1.10 | 25d | 1 | 1.36mi |
| 546 Selma Rd Bessemer, AL | 3.0 | 1.0 | 888 | $900 | $1.01 | 45d | 1 | 1.40mi |
| 5107 5th St N Bessemer, AL | 2.0 | 1.0 | 775 | $950 | $1.23 | 45d | 1 | 1.42mi |
| 3729 Pine Ave SW Birmingham, AL | 3.0 | 1.0 | 1067 | $1,100 | $1.03 | 23d | 1 | 1.43mi |
| 222 4th Ave Birmingham, AL | 3.0 | 1.0 | 1300 | $1,050 | $0.81 | 45d | 1 | 1.46mi |
| 3736 Oak Ave SW Birmingham, AL | 3.0 | 2.0 | 984 | $1,050 | $1.07 | 25d | 1 | 1.47mi |
Listing history 6 events
-
2025-03-03status Pending
-
2025-01-23price $32,500
-
2025-01-15price $34,000
-
2025-01-08price $36,000
-
2024-12-05$40,000 Active
-
1988-12-01soldstatus $18,600
ⓘ Source: listings_history table (triggers on properties + properties_extension) + one-shot
backfill from property_details.listing_events for pre-trigger history.
Tax reassessment forecast AL · Resets to sale price
- Current annual tax
- $478 · $40/mo
- Projected year-2 tax
- $478 · $40/mo
- Expected delta
- $0/yr ($0/mo · 0.0%)
ⓘ Screening estimate from a state-policy table — verify with the county assessor before closing.
Climate risk First Street
- Flood 1/10 Low FEMA zone X (unshaded) · 0% chance over 30 yrs
- Wildfire 3/10 Moderate
- Heat 7/10 Severe 7 d/yr ≥107°F today · 19 d/yr by 30 yrs out
- Wind 6/10 Major 27% chance of damaging wind over 30 yrs
- Air quality 3/10 Moderate 2 unhealthy d/yr today · 5 by 30 yrs out
Nearby sold comps map
Loading sold comps map…
Walkable amenities ~0.75 mi
Loading nearby amenities…
Taxation est. · year 1
- Rental income
- $12,662
- − Mortgage interest
- −$1,821
- − Property taxes
- −$478
- − Insurance
- −$162
- − Repairs & maintenance
- −$1,013
- − Management
- −$1,013
- − Depreciation
- −$945
- Taxable income
- $7,229
- Est. tax owed @ 24.0%
- −$1,735
- After-tax cash flow
- $5,582/yr
For passive investors: Depreciation is non-cash, so a rental often shows a tax loss while cash-flowing — sheltering income. Rental losses are passive: they offset passive income freely, and up to $25,000/yr can offset ordinary (W-2) income if you actively participate and your MAGI is under $100k (phasing out to $0 by $150k); unused losses carry forward. On sale, claimed depreciation is recaptured at up to 25%, and gains may owe capital-gains tax (a 1031 exchange can defer both). Figures are a year-1 estimate at your 24.0% rate — not tax advice; consult a CPA.
Schools (NCES district)
- District
- Jefferson County
- NCES district ID
- 0101920
- Math proficiency
- 9% ▼ -24.00%
- Reading proficiency
- 32% ▼ -5.00%
- Median HH income
- $51,712
- Composite
- 18.4/100
- National rank
- #8937
- State rank
- #104 of 129 in AL
Livability — Lipscomb
- Score
- 67/100
- State rank
- #76
- US rank
- #10121
Category grades
Schools grade is shown separately in the Schools card above.
Census & demographics
- Census place
- Lipscomb, AL
- County
- Jefferson County · 527,445 people
- Metro
- Birmingham-Hoover, AL
- Population (ZIP)
- 24,892
- Household income
- $35,362
- Rent vs Own
- Severe rent burden
- 1001.0
Population outlook (Jefferson County) Hauer SSP2
- Today (2025)
- 669,185 people
- By 2030
- 669,694 · +0.1%
- By 2040
- 661,388 · -1.2%
- By 2050
- 643,086 · -3.9%
- By 2075
- 577,267 · -13.7%
- By 2100
- 474,758 · -29.1%
Race, ethnicity, and origin ACS 2023
- Neighborhood character
- Predominantly Black (74%)
- Race & ethnicity
- Black 74% Hispanic / Latino 13% White 11% Two or more races 6%
- Hispanic origin (detail)
- Mexican 10%
- Foreign-born
- 5% · Canada
- Languages at home
- 89% English-only · Spanish 11%
Political lean MEDSL · Jefferson
- 2024 margin
- D (+10.4) · D 54.6% · R 44.2% · Other 1.2%
- 2008→2024 swing
- +5.4pp toward D · 2008: 5.1pp · 2024: 10.4pp
- All cycles
- 2024: D+10.4 2020: D+13.2 2016: D+7.2 2012: D+6.0 2008: D+5.1
Not yet ingested
- Civics
- —
Market trends
- HPI YoY
- ▼ -57.54%
- Current HPI
- 179.7702
- Rent YoY
- ▼ -3.12%
- Metro
- Birmingham-Hoover, AL
- State GDP YoY
- ▲ 2.94%
- F500 in state
- 4
Industry mix (Fortune 500 HQ in AL)
| Industry | F500 HQs | Revenue |
|---|---|---|
| Financial Services | 1 | $8B |
|
||
| Healthcare | 1 | $5B |
|
||
Price history
+74.7% since first listed6 events — show timeline
- 2025-03-03 Pending — Greater Alabama MLS
- 2025-01-23 Price Changed $32,500 Greater Alabama MLS
- 2025-01-15 Price Changed $34,000 Greater Alabama MLS
- 2025-01-08 Price Changed $36,000 Greater Alabama MLS
- 2024-12-05 Listed $40,000 Greater Alabama MLS
- 1988-12-01 Sold (Public Records) $18,600 Public Records
Property tax history
+4.3%/yrLatest (2025): $478 · +0.0% YoY. Source: county tax records.
Cash-flow waterfall
monthlySold comps — $/sqft
last 12 mo · ≤1 miLoading sold comps…