 🏷️ Likely Rental
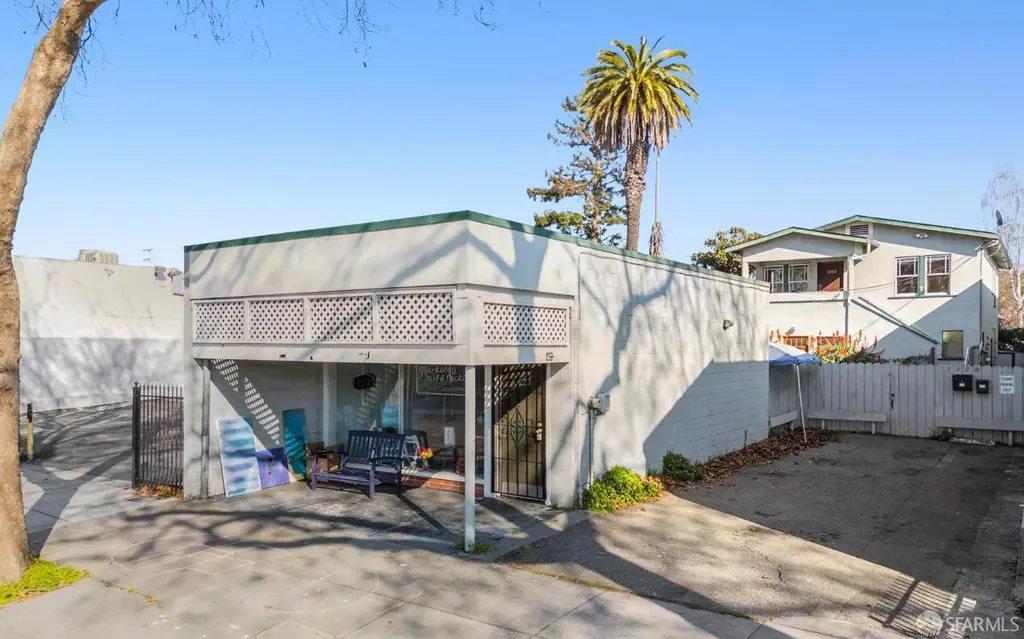
2221-2223 San Pablo Ave · Berkeley, CA
Flood risk No data
- FEMA flood zone
- —
- Chance of flooding over 30 yrs
- —
- Est. flood insurance / yr
- —
Fire risk No data
- Est. fire insurance / yr
- —
Heat risk No data
- Hot days now (above threshold)
- —
- Hot days in 30 yrs
- —
Wind risk No data
- Chance of severe wind over 30 yrs
- —
Air-quality risk No data
- Unhealthy air days now
- —
- Unhealthy air days in 30 yrs
- —
Risk factors via First Street. Map © Google.
Why this score? — see what drove the D grade
The composite is a weighted blend of 9 inputs, each scored 0–100. Each bar is that input's sub-score; the figure is the points it added to the 100-point composite (weight × sub-score).
- ARV discount +15.0/15.0
- Cash flow +7.5/30.0
- Schools +5.7/10.0
- Livability +3.9/5.0
- Rent growth +3.4/5.0
- Condition / age +2.2/5.0
- 1% rule +2.1/10.0
- DSCR +1.6/10.0
- Appreciation +0.0/10.0
$829,000
🖨 Deal sheet (PDF) 📄 Offer letter ✓ Due diligence
Multi-family units
County records classify this as Multi-Family (2-4 Unit). Listing-text estimate: 2 units. confirmed
Listing remarks MLS
2223 San Pablo Avenue is an Add Value owner‑user opportunity offering a street‑front retail space and a residential unit in Berkeley's Poets Corner. The flexible mixed‑use layout allows a buyer to occupy, customize, or re‑tenant immediately. The property features clear value‑add potential, with deferred maintenance providing room for upgrades, modernization, and long‑term repositioning. Located along the active San Pablo Avenue corridor minutes to Downtown, BART, and Fourth Street this site delivers strong visibility, steady traffic, and long‑term upside in a supply‑constrained market.
Key facts
- Mixed use layout
- Value add potential
- Strong visibility
Tags
Neighborhood map
What this means for you Summary
Snapshot
- This is a 2 × 1-bed/1-bath units multifamily listed at $829k. Condition is rated fair.
Deal economics
- At list price, monthly cash flow is $-1k ($-13k/yr) — negative. Per door: $-525/mo.
- To cash-flow at today's rent, offer at most $677k (18.3% below list).
- To meet the 1% rule (rent ≥ 1% of price), the offer needs to be $592k (28.5% below list).
- Recommended offer: $592k (28.5% below list) — sets the bar for 1% rule.
- Cap rate 4.8% vs local median 2.0% in Berkeley — top-decile yield for the area; either an underpriced asset or a hidden risk that comps aren't pricing in. Stress-test before assuming the spread holds.
Location & tenants
- Location reads 77/100 on livability (#74 in CA, #2,860 nationally) — a middle-class / working-renter tenant base. Strengths: amenities A+, commute A+, employment A+; Watch: crime F, cost of living F.
- Berkeley Unified (urban): math 61% / reading 67% proficiency, ranked #175 of 1,400 in CA (top 12%) — acceptable for families but not a draw, mixed tenant base, ~2y average lease.
- Zoned schools: Malcolm X Elementary (459 students, 29% FRL); Martin Luther King Middle (871 students, 20% FRL); Berkeley High (math 74% / reading 98%, grade A, #25 of 1,170 statewide, top 2%, 3,204 students, 23% FRL).
- Zoned-school proficiency averages 86% at this address vs 64% district-wide (+22 pts) — the actual schools serving this property are materially stronger than the Berkeley Unified average implies; a family-tenant draw the district grade alone would hide.
- Market conditions: Rents rising (+3.6%/yr); 43 active listings in the ZIP; 14 comparable units currently listed for rent nearby; rentals at typical pace (median 17d on market — plan ~3-4 weeks tenant-placement turnaround); solid renter incomes; 1,742 units permitted in Alameda County in 2024 (856 in 5+ unit buildings).
- At $5,924/mo this rent would consume 71% of the median local household income ($100k/yr) (locally 1183% of renters already pay >50% of income on rent) — very limited rent-growth headroom before tenants either downsize or default.
Forward outlook
- Local home prices are declining (-3.0%/yr); year-one equity from $6k of loan paydown is wiped out by about $25k of value loss. Plan a longer hold.
- Alameda County population projected at +34% by 2050 — long-run rental-demand tailwind backs the buy-and-hold thesis.
Negotiation context
- It's been on market 92 days — a 9% lower offer ($754k) is reasonable based on typical stale-listing flexibility.
Risks & watch-outs
- Watch-outs: built in 1920 — expect roof / HVAC / electrical / plumbing capex.
Questions for the listing agent
- What do current leases actually rent for vs. the listed asking? Can we see a recent rent roll and the last 12 months of T-12 income?
- It's been on market 92 days. Have you received any prior offers? Is the seller open to a 29% concession, seller financing, or rate buy-down credit?
- Can we see the unit-by-unit rent roll, current vacancy, and any below-market leases? What's the average tenancy length?
- What capital expenditures (roof, boiler, parking lot, exteriors) have been made in the last 5 years, and what's planned in the next 2?
- Have any recent inspections been done? Can we get a copy of the seller's disclosures and any deferred-maintenance estimates?
- Built in 1920 — when were the roof, HVAC, electrical panel, plumbing, and water heater last replaced?
- Why hasn't it sold? Are there any deal-killer items the seller is aware of (foundation, flood, title, zoning, code violations)?
- Is there a deadline driving the sale (1031 exchange, divorce, estate, relocation)? That informs how much negotiation room exists.
- Schools are A-rated — typically a magnet for longer-tenancy family renters. What's the average tenant stay here, and is there a school-zone premium baked into asking?
- Crime grade is F in this area — have there been break-ins, vandalism, or insurance claims at this property in the last 3 years? What carrier currently insures it and at what premium?
- The area grade is low — what's the realistic commute time and amenity access for the typical tenant pool here? Any planned neighborhood developments (good or bad) we should know about?
- What's the average days-on-market for RENTAL listings here right now (not sales)? A rising rental-DOM trend means longer vacancies and softer asking-rent achievability than the comps imply.
- What's the recent tenant-quality profile in this submarket — average credit score on applications, eviction rate, late-payment / NSF rate, and stable-employment percentage? A property-management company in the area should have these aggregated.
- How much new apartment / multifamily construction is in the pipeline within 1–3 miles? Heavy new supply (>2% of stock underway) typically softens rents 12–24 months out; light construction supports rent growth.
Investment metrics
- 1% rule
- 0.71% ✗
- Cap rate
- 4.77%
- Cash-on-cash
- -5.42%
- DSCR
- 0.76
- GRM
- 11.7
CMA / ARV
- ARV (median comp)
- $1,302,578
- List price
- $829,000
- Delta
- -36.36%
- Verdict
- UNDERPRICED
- Comps
- 20 within 1.0 mi
Show comp detail 3 sales within ~0.75 mi
| Address | Dist | Beds/Ba | Sqft | Sold | Price | $/sf | Match |
|---|---|---|---|---|---|---|---|
| 816 Addison St | 0.38mi | 4/2.0 | 2,088 (-7%) | 6mo | $1,250,000 | $599 | 61 |
| 2514-2516 Mathews St | 0.39mi | 5/3.0 (+1) | 2,177 (-3%) | 9mo | $2,100,000 | $965 | 56 |
| 1347 University Ave | 0.43mi | 4/4.0 | 2,362 (+5%) | 15mo | $925,000 | $392 | 47 |
Match score weights: distance 35% · size 25% · config 20% · recency 20%. Top-matched comps best support the ARV.
Projected returns pro-forma
-3.0% appreciation · 3.65% rent growth · sell at horizon
- IRR
- -24.8%
- Equity multiple
- 0.15×
- Total profit
- $-197,161
- Equity at exit
- $123,607
- IRR
- -18.8%
- Equity multiple
- -0.04×
- Total profit
- $-241,144
- Equity at exit
- $71,677
Cash invested: $232,120 (down + closing). Projections, not guarantees.
Landlord ↔ Tenant lean methodology
- Overall (CITY)
- 0 Strongly Tenant-Friendly
- State California
- 18 Strongly Tenant-Friendly · D+13
- County
- — inherits STATE
- City Berkeley
- 0 Strongly Tenant-Friendly · D+78
ZIP-level market 94702
- Rents YoY
- 3.6%
- Active inventory
- 43
- Price-to-rent
- 23.3×
Monthly cashflow live
- Estimated rent
- $5,924 high interval (Pro) →
- Mortgage (P&I)
- −$4,347
- Tax est. 1.5%
- −$1,036 /mo · $12,435/yr
- Insurance
- −$345
- HOA
- −$0
- Vacancy / Maint / Mgmt
- −$1,244
- Net cashflow
- $-1,049
Break-even live
Sensitivity live
| Price | -10% $-476 | -5% $-763 | +0% $-1,049 | +5% $-1,336 | +10% $-1,622 |
|---|---|---|---|---|---|
| Rent | -10% $-1,517 | -5% $-1,283 | +0% $-1,049 | +5% $-815 | +10% $-581 |
| Rate | -1.0pp $-632 | -0.5pp $-838 | base $-1,049 | +0.5pp $-1,264 | +1.0pp $-1,482 |
2-unit breakdown (identical units grouped — click to expand)
| Units | Beds | Baths | Est. rent |
|---|---|---|---|
| 2× units | 1 | 1 | $5,924 |
| #1 | 1 | 1 | $2,962 |
| #2 | 1 | 1 | $2,962 |
| Total (2 units) | $5,924 | ||
UW: 25.0% down · 7.5% · 30yr · 1.5% tax · 5.0% vac · 8.0% maint · 8.0% mgmt
Financing live
Cash to close
- Down payment
- $207,250
- Closing costs
- $24,870
- Reserves months
- —
- Total cash needed
- —
Loan-product check · same deal, 3 products live
Conventional
25% down · 7.5% · 30yr
- Down + closing
- —
- Monthly P&I
- —
- Monthly cashflow
- —
- DSCR
- —
- Eligible?
- —
Personal DTI + credit; lowest rate.
DSCR
20% down · 8.5% · 30yr
- Down + closing
- —
- Monthly P&I
- —
- Monthly cashflow
- —
- DSCR
- —
- Eligible?
- —
No personal income docs; deal must DSCR.
Hard money
10% down · 12.0% · 12mo
- Down + closing
- —
- Monthly P&I
- —
- Monthly cashflow
- —
- DSCR
- —
- Eligible?
- —
Short-term bridge; refi at stabilization.
Rent comps 14 comps
| Address | Beds | Baths | Sqft | Rent | $/sqft | DOM | Units | Dist |
|---|---|---|---|---|---|---|---|---|
| 1122 University Ave Berkeley, CA | 5.0 | 1.0–4.0 | 1129 | $5,617 | $4.97 | 0d | 17 | 0.21mi |
| 1034 Grayson St Unit 1 Berkeley, CA | 3.0 | 3.0 | 1498 | $6,475 | $4.32 | 45d | 1 | 0.71mi |
| 2726 Wallace St Berkeley, CA | 3.0 | 3.0 | 1856 | $6,300 | $3.39 | 4d | 1 | 0.72mi |
| 1415 10th St Berkeley, CA | 3.0 | 3.5 | 1477 | $3,650 | $2.47 | 13d | 1 | 0.87mi |
| 1316 Russell St Berkeley, CA | 4.0 | 2.5 | 2200 | $8,500 | $3.86 | 0d | 1 | 0.92mi |
| 1730 Francisco St Berkeley, CA | 5.0 | 3.5 | 2250 | $8,000 | $3.56 | 26d | 1 | 0.99mi |
| 1308 Stannage Ave Berkeley, CA | 3.0 | 1.0 | 1497 | $4,200 | $2.81 | 17d | 1 | 1.01mi |
| 1114 Talbot Ave Albany, CA | 3.0 | 2.0 | 1569 | $4,700 | $3.00 | 20d | 1 | 1.25mi |
| 2038 Parker St Berkeley, CA | 3.0 | 1.0–2.5 | 1118 | $6,921 | $6.19 | 0d | 17 | 1.31mi |
| 2108 Berkeley Way Berkeley, CA | 1.0–3.0 | 1.0–2.0 | 965 | $8,100 | $8.39 | 0d | 1 | 1.33mi |
| 2175 Dwight Way Unit 01 Berkeley, CA | 5.0 | 3.0 | 1500 | $6,750 | $4.50 | 20d | 1 | 1.39mi |
| 1039 Evelyn Ave Unit B Albany, CA | 3.0 | 2.0 | 2032 | $5,450 | $2.68 | 4d | 1 | 1.39mi |
| 2185 Dwight Way Unit 04 Berkeley, CA | 5.0 | 3.0 | 1449 | $6,750 | $4.66 | 20d | 1 | 1.40mi |
| 1251 63rd St Emeryville, CA | 3.0 | 2.0 | 1400 | $4,750 | $3.39 | 26d | 1 | 1.48mi |
Listing history 16 events
-
2026-06-21days on market $829,000 Active 92 DOM
-
2026-06-18days on market $829,000 Active 89 DOM
-
2026-06-17days on market $829,000 Active 88 DOM
-
2026-06-16days on market $829,000 Active 87 DOM
-
2026-06-15days on market $829,000 Active 86 DOM
-
2026-06-13days on market $829,000 Active 84 DOM
-
2026-06-13days on market $829,000 Active 83 DOM
-
2026-06-09days on market $829,000 Active 80 DOM
-
2026-06-08days on market $829,000 Active 79 DOM
-
2026-06-07days on market $829,000 Active 78 DOM
-
2026-06-04days on market $829,000 Active 75 DOM
-
2026-06-03days on market $829,000 Active 74 DOM
-
2026-06-02days on market $829,000 Active 73 DOM
-
2026-06-01days on market $829,000 Active 72 DOM
-
2026-05-31days on market $829,000 Active 71 DOM
-
2026-03-21$829,000 Active 592-char remark
Show marketing remark (592 chars)
2223 San Pablo Avenue is an Add Value owner‑user opportunity offering a street‑front retail space and a residential unit in Berkeley's Poets Corner. The flexible mixed‑use layout allows a buyer to occupy, customize, or re‑tenant immediately. The property features clear value‑add potential, with deferred maintenance providing room for upgrades, modernization, and long‑term repositioning. Located along the active San Pablo Avenue corridor minutes to Downtown, BART, and Fourth Street this site delivers strong visibility, steady traffic, and long‑term upside in a supply‑constrained market.
ⓘ Source: listings_history table (triggers on properties + properties_extension) + one-shot
backfill from property_details.listing_events for pre-trigger history.
Nearby sold comps map
Loading sold comps map…
Walkable amenities ~0.75 mi
Loading nearby amenities…
Taxation est. · year 1
- Rental income
- $71,088
- − Mortgage interest
- −$46,437
- − Property taxes
- −$12,435
- − Insurance
- −$4,145
- − Repairs & maintenance
- −$5,687
- − Management
- −$5,687
- − Depreciation
- −$24,116
- Taxable loss
- −$27,419
- Est. tax savings @ 24.0%
- +$6,581
- After-tax cash flow
- $-6,008/yr
For passive investors: Depreciation is non-cash, so a rental often shows a tax loss while cash-flowing — sheltering income. Rental losses are passive: they offset passive income freely, and up to $25,000/yr can offset ordinary (W-2) income if you actively participate and your MAGI is under $100k (phasing out to $0 by $150k); unused losses carry forward. On sale, claimed depreciation is recaptured at up to 25%, and gains may owe capital-gains tax (a 1031 exchange can defer both). Figures are a year-1 estimate at your 24.0% rate — not tax advice; consult a CPA.
Condition & rehab AI · 13 photos
The property is in fair condition with some minor repairs and maintenance needed. Painting the exterior walls and pruning the trees would significantly increase its value.
Repairs flagged
- Minor exterior paint — There is some discoloration and wear visible on the exterior walls.
- Minor landscaping — There is some minor wear and tear visible in the landscaping.
Value-add opportunities
- Both paint exterior walls — Painting the exterior walls will improve the curb appeal and increase the property's value.
- Both prune trees — Pruning the trees will improve the landscaping and increase the property's value.
Renovation cost estimate screening
| Repair item | Severity | Est. cost |
|---|---|---|
| exterior paint · There is some discoloration and wear visible on the exterior walls. | Minor | $500–3,000 |
| landscaping · There is some minor wear and tear visible in the landscaping. | Minor | $500–3,000 |
| Total estimated repair cost · 2 items | $1,000–6,000 |
Value-add ROI direction
- Both paint exterior walls — Painting the exterior walls will improve the curb appeal and increase the property's value. ↑
- Both prune trees — Pruning the trees will improve the landscaping and increase the property's value. ↑
ⓘ Cost ranges are severity-bucket heuristics (US national rule-of-thumb). Get contractor quotes + a written scope before underwriting a rehab budget.
Schools (NCES district)
- District
- Berkeley Unified
- NCES district ID
- 0604740
- Math proficiency
- 61% ▲ 2.00%
- Reading proficiency
- 67% ▲ 2.00%
- Median HH income
- $66,202
- Composite
- 57.37/100
- National rank
- #2288
- State rank
- #175 of 1400 in CA
Livability — Berkeley
- Score
- 77/100
- State rank
- #74
- US rank
- #2860
Category grades
Schools grade is shown separately in the Schools card above.
Census & demographics
- Census place
- Berkeley, CA
- County
- Alameda County · 1,614,355 people
- City population
- 121,632
- Metro
- San Francisco-Oakland-Berkeley, CA
- Population (ZIP)
- 17,635
- Household income
- $99,775
- Rent vs Own
- Severe rent burden
- 1183.0
Population outlook (Alameda County) Hauer SSP2
- Today (2025)
- 1,928,884 people
- By 2030
- 2,069,146 · +7.3%
- By 2040
- 2,338,405 · +21.2%
- By 2050
- 2,586,608 · +34.1%
- By 2075
- 3,061,911 · +58.7%
- By 2100
- 3,234,133 · +67.7%
Race, ethnicity, and origin ACS 2023
- Neighborhood character
- Highly diverse neighborhood (Simpson 0.71)
- Race & ethnicity
- White 48% Black 15% Asian 14% Two or more races 13% Hispanic / Latino 12%
- Hispanic origin (detail)
- Mexican 8%
- Common ancestry
- Romanian 3% Lithuanian 2% Italian 2%
- Foreign-born
- 19% · Canada, China, Vietnam
- Languages at home
- 78% English-only · Spanish 8% Chinese 3% Other Indo-European 3%
Political lean MEDSL · Alameda
- 2024 margin
- Solid D (+53.6) · D 74.6% · R 21.0% · Other 4.4%
- 2008→2024 swing
- -5.9pp toward R · 2008: 59.5pp · 2024: 53.6pp
- All cycles
- 2024: D+53.6 2020: D+62.5 2016: D+64.4 2012: D+59.8 2008: D+59.5
Not yet ingested
- Civics
- —
Market trends
- HPI YoY
- ▼ -1257.77%
- Current HPI
- 327.4724
- Rent YoY
- ▲ 3.65%
- Metro
- San Francisco-Oakland-Berkeley, CA
- State GDP YoY
- ▲ 3.21%
- F500 in state
- 116
Industry mix (Fortune 500 HQ in CA)
| Industry | F500 HQs | Revenue |
|---|---|---|
| Technology | 27 | $1,492B |
|
||
| Financial Services | 3 | $174B |
|
||
| Retail | 3 | $44B |
|
||
| Insurance | 3 | $26B |
|
||
| Media / Entertainment | 2 | $115B |
|
||
| Pharmaceuticals / Biotech | 2 | $62B |
|
||
Price history
1 event — show timeline
- 2026-03-21 Listed $829,000 San Francisco MLS
Cash-flow waterfall
monthlySold comps — $/sqft
last 12 mo · ≤1 miLoading sold comps…