 Fourplex
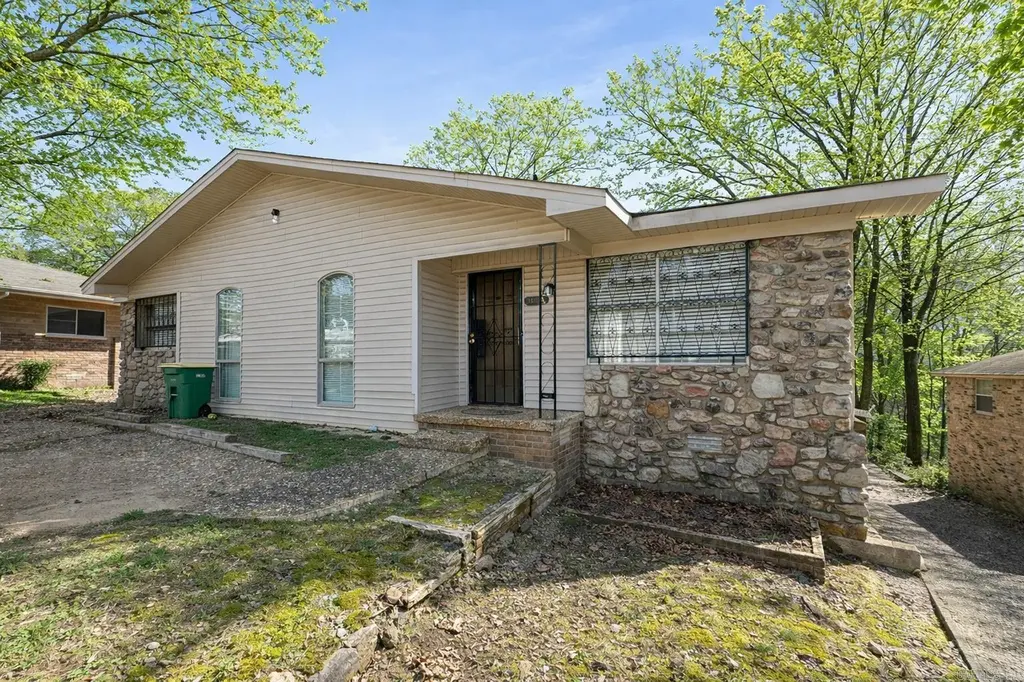
507 Mimi Ln · Little Rock, AR
Flood risk 1/10 · Minimal
- FEMA flood zone
- X (unshaded)
- Chance of flooding over 30 yrs
- 0.0%
- Est. flood insurance / yr
- $507 – $1,088
Fire risk 1/10 · Minimal
- Est. fire insurance / yr
- $1,499 – $2,785
Heat risk 7/10 · Major
- Hot days now (above 111°F)
- 7 days/yr
- Hot days in 30 yrs
- 19 days/yr
Wind risk 4/10 · Minor
- Chance of severe wind over 30 yrs
- 9.0%
Air-quality risk 2/10 · Minimal
- Unhealthy air days now
- 0 days/yr
- Unhealthy air days in 30 yrs
- 1 days/yr
Risk factors via First Street. Map © Google.
Why this score? — see what drove the D grade
The composite is a weighted blend of 9 inputs, each scored 0–100. Each bar is that input's sub-score; the figure is the points it added to the 100-point composite (weight × sub-score).
- Cash flow +18.1/30.0
- DSCR +5.7/10.0
- 1% rule +4.9/10.0
- Rent growth +3.9/5.0
- Livability +3.7/5.0
- Condition / age +2.8/5.0
- Schools +2.1/10.0
- ARV discount +0.0/15.0
- Appreciation +0.0/10.0
$375,000
🖨 Deal sheet 📄 Offer letter ✓ Due diligence
Multi-family units
County records classify this as Multi-Family (2-4 Unit). Listing-text estimate: 4 units. confirmed
Listing remarks MLS
Investment Opportunity in West Little Rock! This fourplex at 507 Mimi Ln. offers a strong income-producing opportunity with a desirable unit mix of two 2-bedroom units and two 1-bedroom units. Built in 1975 and offering over 4,000 square feet of living space, the moderately updated property provides solid rental potential in a centrally located area close to shopping, dining, and major commuter routes. Each unit provides functional layouts appealing to long-term tenants, making this an ideal addition for investors looking to expand their portfolio or secure a steady cash-flowing asset. Properties like this rarely come available in such a convenient Little Rock location—don’t miss the chance to add a multi-unit investment to your portfolio. Seller has additional properties available—please inquire for more details. Property is tenant occupied. Photos are enhanced by AI for decluttering purposes only. Video walk through available upon request. * * Agents See Remarks * *
Key facts
- Desirable unit mix
- Functional layouts
- 9,583 sq ft lot
Tags
Neighborhood map
What this means for you Summary
Snapshot
- This is a 2×2bd/1ba + 2×1bd/1ba units multifamily listed at $375k. Condition is rated average.
Deal economics
- At list price, monthly cash flow is $328 ($4k/yr) — positive. Per door: $82/mo.
- The deal already cash-flows at list — no discount required.
- To meet the 1% rule (rent ≥ 1% of price), the offer needs to be $370k (1.5% below list).
- Recommended offer: $341k (9.0% below list) — sets the bar for market timing.
- Cap rate 7.3% vs local median 4.1% in Little Rock — top-decile yield for the area; either an underpriced asset or a hidden risk that comps aren't pricing in. Stress-test before assuming the spread holds.
Location & tenants
- Location reads 73/100 on livability (#22 in AR) — a middle-class / working-renter tenant base. Strengths: commute A+, cost of living A+, housing A+; Watch: crime F.
- Little Rock School District (urban): math 23% / reading 26% proficiency, ranked #183 of 238 in AR (top 77%) — low school quality limits family demand, transient renter base, plan for 1-2y turnover; 69% free/reduced lunch — lower-income household profile, screen leases tightly.
- Market conditions: Rents rising fast (+5.5%/yr); 87 active listings in the ZIP; solid renter incomes; 1,006 units permitted in Pulaski County in 2024 (0 in 5+ unit buildings).
- At $3,695/mo this rent would consume 53% of the median local household income ($83k/yr) (locally 1062% of renters already pay >50% of income on rent) — very limited rent-growth headroom before tenants either downsize or default.
Forward outlook
- Local home prices are declining (-3.0%/yr); year-one equity from $3k of loan paydown is wiped out by about $11k of value loss. Plan a longer hold.
- Pulaski County population projected at +6% by 2050 — modest demand growth; plan on rents tracking national, not racing it.
Negotiation context
- It's been on market 106 days — a 9% lower offer ($341k) is reasonable based on typical stale-listing flexibility.
Risks & watch-outs
- Climate carrying-cost: extreme-heat days projected 7→19/yr by 2055 (HVAC capex compounding) — expect insurance premiums to compound above CPI over the hold.
Questions for the listing agent
- It's been on market 106 days. Have you received any prior offers? Is the seller open to a 9% concession, seller financing, or rate buy-down credit?
- Can we see the unit-by-unit rent roll, current vacancy, and any below-market leases? What's the average tenancy length?
- What capital expenditures (roof, boiler, parking lot, exteriors) have been made in the last 5 years, and what's planned in the next 2?
- Built in 1975 — when were the roof, HVAC, electrical panel, plumbing, and water heater last replaced?
- Why hasn't it sold? Are there any deal-killer items the seller is aware of (foundation, flood, title, zoning, code violations)?
- Is there a deadline driving the sale (1031 exchange, divorce, estate, relocation)? That informs how much negotiation room exists.
- Crime grade is F in this area — have there been break-ins, vandalism, or insurance claims at this property in the last 3 years? What carrier currently insures it and at what premium?
- The area grade is low — what's the realistic commute time and amenity access for the typical tenant pool here? Any planned neighborhood developments (good or bad) we should know about?
- What's the average days-on-market for RENTAL listings here right now (not sales)? A rising rental-DOM trend means longer vacancies and softer asking-rent achievability than the comps imply.
- What's the recent tenant-quality profile in this submarket — average credit score on applications, eviction rate, late-payment / NSF rate, and stable-employment percentage? A property-management company in the area should have these aggregated.
- How much new apartment / multifamily construction is in the pipeline within 1–3 miles? Heavy new supply (>2% of stock underway) typically softens rents 12–24 months out; light construction supports rent growth.
Investment metrics
- 1% rule
- 0.99% ✗
- Cap rate
- 7.34%
- Cash-on-cash
- 3.74%
- DSCR
- 1.17
- GRM
- 8.5
CMA / ARV
- ARV (median comp)
- $262,468
- List price
- $375,000
- Delta
- 42.87%
- Verdict
- OVERPRICED
- Comps
- 3 within 1.0 mi
Projected returns pro-forma
-3.0% appreciation · 5.48% rent growth · sell at horizon
- IRR
- -7.7%
- Equity multiple
- 0.71×
- Total profit
- $-30,403
- Equity at exit
- $55,914
- IRR
- 4.8%
- Equity multiple
- 1.39×
- Total profit
- $41,404
- Equity at exit
- $32,423
Cash invested: $105,000 (down + closing). Projections, not guarantees.
Landlord ↔ Tenant lean methodology
- Overall (STATE)
- 92 Strongly Landlord-Friendly
- State Arkansas
- 92 Strongly Landlord-Friendly · R+14
- County
- — inherits STATE
- City
- — inherits STATE
ZIP-level market 72211
- Rents YoY
- 5.5%
- Active inventory
- 87
- Price-to-rent
- 32.6×
Monthly cashflow live
- Estimated rent
- $3,695 high interval (Pro) →
- Mortgage (P&I)
- −$1,967
- Tax est. 1.5%
- −$469 /mo · $5,625/yr
- Insurance
- −$156
- HOA
- −$0
- Vacancy / Maint / Mgmt
- −$776
- Net cashflow
- $328
Break-even live
4-unit breakdown (identical units grouped — click to expand)
| Units | Beds | Baths | Est. rent |
|---|---|---|---|
| 2× units | 2 | 1 | $1,920 |
| #1 | 2 | 1 | $960 |
| #2 | 2 | 1 | $960 |
| 2× units | 1 | 1 | $1,776 |
| #3 | 1 | 1 | $888 |
| #4 | 1 | 1 | $888 |
| Total (4 units) | $3,695 | ||
UW: 25.0% down · 7.5% · 30yr · 1.5% tax · 5.0% vac · 8.0% maint · 8.0% mgmt
Financing live
Cash to close
- Down payment
- $93,750
- Closing costs
- $11,250
- Reserves months
- —
- Total cash needed
- —
Loan-product check · same deal, 3 products live
Conventional
25% down · 7.5% · 30yr
- Down + closing
- —
- Monthly P&I
- —
- Monthly cashflow
- —
- DSCR
- —
- Eligible?
- —
Personal DTI + credit; lowest rate.
DSCR
20% down · 8.5% · 30yr
- Down + closing
- —
- Monthly P&I
- —
- Monthly cashflow
- —
- DSCR
- —
- Eligible?
- —
No personal income docs; deal must DSCR.
Hard money
10% down · 12.0% · 12mo
- Down + closing
- —
- Monthly P&I
- —
- Monthly cashflow
- —
- DSCR
- —
- Eligible?
- —
Short-term bridge; refi at stabilization.
Listing history 18 events
-
2026-06-18days on market $375,000 Active 106 DOM
-
2026-06-17days on market $375,000 Active 105 DOM
-
2026-06-16days on market $375,000 Active 104 DOM
-
2026-06-15days on market $375,000 Active 103 DOM
-
2026-06-14days on market $375,000 Active 101 DOM
-
2026-06-13days on market $375,000 Active 100 DOM
-
2026-06-10days on market $375,000 Active 98 DOM
-
2026-06-09days on market $375,000 Active 97 DOM
-
2026-06-08days on market $375,000 Active 96 DOM
-
2026-06-05remarks 699-char remark
-
2026-06-05days on market $375,000 Active 92 DOM
-
2026-06-03days on market $375,000 Active 91 DOM
-
2026-06-02days on market $375,000 Active 90 DOM
-
2026-06-01days on market $375,000 Active 89 DOM
-
2026-05-31days on market $375,000 Active 88 DOM
-
2026-05-31days on market $375,000 Active 87 DOM
-
2026-05-09price $375,000 1002-char remark
Show marketing remark (1002 chars)
Investment Opportunity in West Little Rock! This fourplex at 507 Mimi Ln. offers a strong income-producing opportunity with a desirable unit mix of two 2-bedroom units and two 1-bedroom units. Built in 1975 and offering over 4,000 square feet of living space, the moderately updated property provides solid rental potential in a centrally located area close to shopping, dining, and major commuter routes. Each unit provides functional layouts appealing to long-term tenants, making this an ideal addition for investors looking to expand their portfolio or secure a steady cash-flowing asset. Properties like this rarely come available in such a convenient Little Rock location—don’t miss the chance to add a multi-unit investment to your portfolio. Seller has additional properties available—please inquire for more details. Property is tenant occupied. Photos are enhanced by AI for decluttering purposes only. Video walk through available upon request. * * Agents See Remarks * *
-
2026-03-04$400,000 New Listing 1002-char remark
Show marketing remark (1002 chars)
Investment Opportunity in West Little Rock! This fourplex at 507 Mimi Ln. offers a strong income-producing opportunity with a desirable unit mix of two 2-bedroom units and two 1-bedroom units. Built in 1975 and offering over 4,000 square feet of living space, the moderately updated property provides solid rental potential in a centrally located area close to shopping, dining, and major commuter routes. Each unit provides functional layouts appealing to long-term tenants, making this an ideal addition for investors looking to expand their portfolio or secure a steady cash-flowing asset. Properties like this rarely come available in such a convenient Little Rock location—don’t miss the chance to add a multi-unit investment to your portfolio. Seller has additional properties available—please inquire for more details. Property is tenant occupied. Photos are enhanced by AI for decluttering purposes only. Video walk through available upon request. * * Agents See Remarks * *
ⓘ Source: listings_history table (triggers on properties + properties_extension) + one-shot
backfill from property_details.listing_events for pre-trigger history.
Climate risk First Street
- Flood 1/10 Low FEMA zone X (unshaded) · 0% chance over 30 yrs
- Wildfire 1/10 Low
- Heat 7/10 Severe 7 d/yr ≥111°F today · 19 d/yr by 30 yrs out
- Wind 4/10 Moderate 9% chance of damaging wind over 30 yrs
- Air quality 2/10 Low 0 unhealthy d/yr today · 1 by 30 yrs out
Nearby sold comps map
Loading sold comps map…
Walkable amenities ~0.75 mi
Loading nearby amenities…
Taxation est. · year 1
- Rental income
- $44,340
- − Mortgage interest
- −$21,006
- − Property taxes
- −$5,625
- − Insurance
- −$1,875
- − Repairs & maintenance
- −$3,547
- − Management
- −$3,547
- − Depreciation
- −$10,909
- Taxable loss
- −$2,169
- Est. tax savings @ 24.0%
- +$521
- After-tax cash flow
- $4,451/yr
For passive investors: Depreciation is non-cash, so a rental often shows a tax loss while cash-flowing — sheltering income. Rental losses are passive: they offset passive income freely, and up to $25,000/yr can offset ordinary (W-2) income if you actively participate and your MAGI is under $100k (phasing out to $0 by $150k); unused losses carry forward. On sale, claimed depreciation is recaptured at up to 25%, and gains may owe capital-gains tax (a 1031 exchange can defer both). Figures are a year-1 estimate at your 24.0% rate — not tax advice; consult a CPA.
Condition & rehab AI · 12 photos
This fourplex offers a solid rental potential with functional layouts, but requires moderate updates to appliances, bathrooms, windows, and landscaping to enhance its resale and rental value.
Repairs flagged
- Major Appliances — Outdated and cluttered, indicating need for replacement.
- Moderate Bathroom fixtures — Dated appearance suggests need for updates.
- Minor Exterior siding — Some discoloration, but overall in good condition.
- Moderate Windows — Blinds appear old, may need replacement or upgrade.
- Minor HVAC system — No visible signs of major issues, but may need maintenance.
- Major Landscaping — Sparse and in need of improvement to enhance curb appeal.
Value-add opportunities
- Both Replace outdated appliances — Modernizing the kitchen will attract more buyers and renters.
- Both Upgrade bathroom fixtures — Updating bathrooms will improve the overall appeal and functionality.
- Both Replace old windows — New windows will improve energy efficiency and curb appeal.
- Both Improve landscaping — Enhanced landscaping will increase curb appeal and attract more potential buyers and renters.
- Both Paint interior walls — Fresh paint will make the interior look more inviting and modern.
- Rental Maintain HVAC system — A well-maintained HVAC system will keep the property comfortable and attract renters.
Renovation cost estimate screening
| Repair item | Severity | Est. cost |
|---|---|---|
| Appliances · Outdated and cluttered, indicating need for replacement. | Major | $15,000–50,000 |
| Bathroom fixtures · Dated appearance suggests need for updates. | Moderate | $3,000–15,000 |
| Exterior siding · Some discoloration, but overall in good condition. | Minor | $500–3,000 |
| Windows · Blinds appear old, may need replacement or upgrade. | Moderate | $3,000–15,000 |
| HVAC system · No visible signs of major issues, but may need maintenance. | Minor | $500–3,000 |
| Landscaping · Sparse and in need of improvement to enhance curb appeal. | Major | $15,000–50,000 |
| Total estimated repair cost · 6 items | $37,000–136,000 |
Value-add ROI direction
- Both Replace outdated appliances — Modernizing the kitchen will attract more buyers and renters. ↑
- Both Upgrade bathroom fixtures — Updating bathrooms will improve the overall appeal and functionality. ↑
- Both Replace old windows — New windows will improve energy efficiency and curb appeal. ↑
- Both Improve landscaping — Enhanced landscaping will increase curb appeal and attract more potential buyers and renters. ↑
- Both Paint interior walls — Fresh paint will make the interior look more inviting and modern. ↑
- Rental Maintain HVAC system — A well-maintained HVAC system will keep the property comfortable and attract renters. ↑
ⓘ Cost ranges are severity-bucket heuristics (US national rule-of-thumb). Get contractor quotes + a written scope before underwriting a rehab budget.
Schools (NCES district)
- District
- Little Rock School District
- NCES district ID
- 0509000
- Math proficiency
- 23% ▼ -12.00%
- Reading proficiency
- 26% ▼ -8.00%
- Median HH income
- $43,346
- Composite
- 21.0/100
- National rank
- #8457
- State rank
- #183 of 238 in AR
Livability — Little Rock
- Score
- 73/100
- State rank
- #22
- US rank
- #5295
Category grades
Schools grade is shown separately in the Schools card above.
Census & demographics
- Census place
- Little Rock, AR
- County
- Pulaski County · 372,764 people
- City population
- 218,896
- Metro
- Little Rock-North Little Rock-Conway, AR
- Population (ZIP)
- 22,335
- Household income
- $83,134
- Rent vs Own
- Severe rent burden
- 1062.0
Population outlook (Pulaski County) Hauer SSP2
- Today (2025)
- 415,378 people
- By 2030
- 423,720 · +2.0%
- By 2040
- 435,182 · +4.8%
- By 2050
- 440,904 · +6.1%
- By 2075
- 445,521 · +7.3%
- By 2100
- 419,173 · +0.9%
Race, ethnicity, and origin ACS 2023
- Neighborhood character
- Majority White (64%)
- Race & ethnicity
- White 64% Black 19% Asian 8% Hispanic / Latino 6% Two or more races 5%
- Hispanic origin (detail)
- Mexican 3%
- Common ancestry
- Italian 3% Slovak 2% Lithuanian 2%
- Foreign-born
- 13% · Canada, China, South Korea
- Languages at home
- 85% English-only · Spanish 4% Chinese 3% Other Indo-European 3%
Political lean MEDSL · Pulaski
- 2024 margin
- Strong D (+22.1) · D 59.8% · R 37.7% · Other 2.5%
- 2008→2024 swing
- +10.6pp toward D · 2008: 11.6pp · 2024: 22.1pp
- All cycles
- 2024: D+22.1 2020: D+22.5 2016: D+17.9 2012: D+11.4 2008: D+11.6
Not yet ingested
- Civics
- —
Market trends
- HPI YoY
- ▼ -122.88%
- Current HPI
- 186.3947
- Rent YoY
- ▲ 5.48%
- Metro
- Little Rock-North Little Rock-Conway, AR
- State GDP YoY
- ▲ 3.80%
- F500 in state
- 10
Industry mix (Fortune 500 HQ in AR)
| Industry | F500 HQs | Revenue |
|---|---|---|
| Retail | 1 | $681B |
|
||
| Food / Agriculture | 1 | $53B |
|
||
| Retail / Energy | 1 | $22B |
|
||
| Transportation / Logistics | 1 | $12B |
|
||
| Energy | 1 | $4B |
|
||
Price history
-6.2% since first listed2 events — show timeline
- 2026-05-09 Price Changed $375,000 CARMLS
- 2026-03-04 Listed $400,000 CARMLS
Cash-flow waterfall
monthlySold comps — $/sqft
last 12 mo · ≤1 miLoading sold comps…