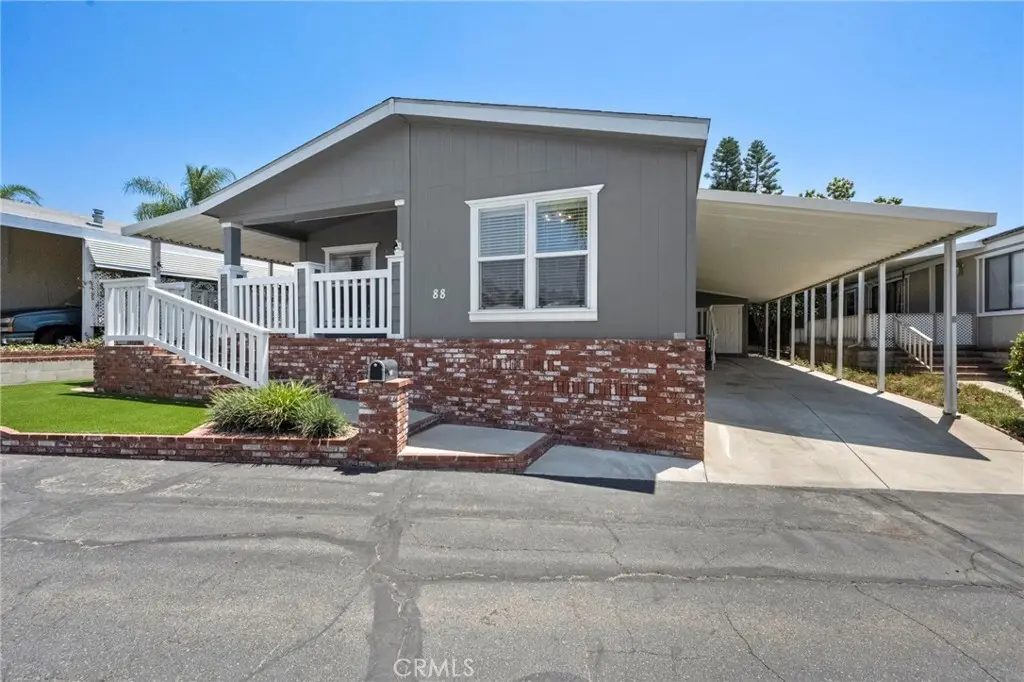
8651 Foothill Blvd #88 · Rancho Cucamonga, CA
Flood risk 3/10 · Minor
- FEMA flood zone
- X (unshaded)
- Chance of flooding over 30 yrs
- 0.2%
- Est. flood insurance / yr
- $507 – $1,088
Fire risk 1/10 · Minimal
- Est. fire insurance / yr
- $659 – $1,223
Heat risk 7/10 · Major
- Hot days now (above 100°F)
- 6 days/yr
- Hot days in 30 yrs
- 17 days/yr
Wind risk 1/10 · Minimal
- Chance of severe wind over 30 yrs
- —
Air-quality risk 9/10 · Severe
- Unhealthy air days now
- 23 days/yr
- Unhealthy air days in 30 yrs
- 28 days/yr
Risk factors via First Street. Map © Google.
Why this score? — see what drove the B- grade
The composite is a weighted blend of 9 inputs, each scored 0–100. Each bar is that input's sub-score; the figure is the points it added to the 100-point composite (weight × sub-score).
- Cash flow +30.0/30.0
- DSCR +10.0/10.0
- 1% rule +7.9/10.0
- ARV discount +7.5/15.0
- Livability +3.5/5.0
- Rent growth +2.7/5.0
- Condition / age +2.5/5.0
- Schools +2.3/10.0
- Appreciation +0.0/10.0
$269,000
🖨 Deal sheet (PDF) 📄 Offer letter ✓ Due diligence
Listing remarks
Welcome to this beautifully updated 3-bedroom, 2-bathroom home located in the desirable 55+ Casa Volante community of Rancho Cucamonga. Offering approximately 1,554 square feet of thoughtfully designed living space, this move-in ready residence combines modern updates, spacious rooms, and exceptional curb appeal. One of the home's most impressive features is the gorgeous covered front porch with attractive Trex-style decking and the expansive wraparound patio along the north side of the home. These inviting outdoor spaces create the perfect setting for morning coffee, outdoor entertaining, or simply relaxing and enjoying Southern California's beautiful weather. Step inside to discover attra
Key facts
- Covered front porch
- Large center island
- Walk-in closet
Tags
Property features AI
Finance
- Other: Rent includes trash, water, and sewer; Land lease amount: $1,276
- Financial info: Land lease applies
- HOA & community: Senior community; Manager approval required; Park name: Casa Volante
Exterior
- Parking: Assigned covered carport (2 spaces)
- Utilities: Public sewer; District/public water; Natural gas connected; Electricity connected
- Home design: Single-story home; Entry on main level; Has a view; Mobile home remains (26' x 58')
- Construction: One-story structure
- Exterior features: Community pool; Curbs
Interior
- Kitchen: Microwave; Refrigerator; Gas range
- Bedrooms: All bedrooms on the ground floor
- Bathrooms: 2 full bathrooms; Shower-in-tub and walk-in shower options
- Heating & cooling: Central cooling; Central furnace heating
- Interior features: Ceiling fan; Community spa
- Laundry & utility: Indoor laundry
Neighborhood map
What this means for you Summary
Snapshot
- This is a 3-bed/2.0-bath manufactured listed at $269k.
Deal economics
- At list price, monthly cash flow is $1k ($13k/yr) — positive.
- The deal already cash-flows at list — no discount required.
- Meets the 1% rule at list price ($3k rent vs $269k).
- Recommended offer: $265k (1.5% below list) — sets the bar for market timing.
- Cap rate 11.3% vs local median 2.7% in Rancho Cucamonga — top-decile yield for the area; either an underpriced asset or a hidden risk that comps aren't pricing in. Stress-test before assuming the spread holds.
Location & tenants
- Location reads 70/100 on livability (#237 in CA) — a middle-class / working-renter tenant base. Strengths: employment A+, commute A, housing A-; Watch: amenities D+, health & safety D, cost of living F.
- Central Elementary (suburban): math 25% / reading 25% proficiency, ranked #379 of 517 in CA (top 73%) — low school quality limits family demand, transient renter base, plan for 1-2y turnover.
- Zoned schools: Bear Gulch Elementary (451 students, 82% FRL); Cucamonga Middle (650 students, 68% FRL); Alta Loma High (math 53% / reading 77%, grade B, #161 of 1,170 statewide, top 14%, 2,456 students, 55% FRL) — zoned schools average 68% FRL vs 44% district-wide (24 pts higher); higher-poverty schools than district average — tighter screening recommended.
- Zoned-school proficiency averages 65% at this address vs 25% district-wide (+40 pts) — the actual schools serving this property are materially stronger than the Central Elementary average implies; a family-tenant draw the district grade alone would hide.
- Market conditions: Rents flat; 142 active listings in the ZIP; 23 comparable units currently listed for rent nearby; rentals leasing fast (median 2d on market — plan ~1-2 weeks tenant-placement turnaround); solid renter incomes; 5,458 units permitted in San Bernardino County in 2024 (1,500 in 5+ unit buildings).
- At $3,463/mo this rent would consume 45% of the median local household income ($92k/yr) (locally 4013% of renters already pay >50% of income on rent) — very limited rent-growth headroom before tenants either downsize or default.
Forward outlook
- Local home prices are declining (-3.0%/yr); year-one equity from $2k of loan paydown is wiped out by about $8k of value loss. Plan a longer hold.
- San Bernardino County population projected at +15% by 2050 — modest demand growth; plan on rents tracking national, not racing it.
- At projected returns (-3.0% appreciation + 0.8% rent growth), your $75k cash investment doubles in ~9 years — after that, you're playing with house money.
Negotiation context
- It's been on market 17 days — a 2% lower offer ($265k) is reasonable based on typical stale-listing flexibility.
- 2 sale attempts since 10y ago with the ask held roughly flat each time — persistent listings suggest the price (not the market) is what's stuck; bring a comps-based counter.
Risks & watch-outs
- Climate carrying-cost: extreme-heat days projected 6→17/yr by 2055 (HVAC capex compounding) — expect insurance premiums to compound above CPI over the hold.
Questions for the listing agent
- Is there a deadline driving the sale (1031 exchange, divorce, estate, relocation)? That informs how much negotiation room exists.
- Schools are B-rated — typically a magnet for longer-tenancy family renters. What's the average tenant stay here, and is there a school-zone premium baked into asking?
- What's the average days-on-market for RENTAL listings here right now (not sales)? A rising rental-DOM trend means longer vacancies and softer asking-rent achievability than the comps imply.
- What's the recent tenant-quality profile in this submarket — average credit score on applications, eviction rate, late-payment / NSF rate, and stable-employment percentage? A property-management company in the area should have these aggregated.
- How much new for-sale + rental construction is in the pipeline within 1–3 miles? Heavy new supply typically softens prices + rents 12–24 months out; constrained supply supports both.
Investment metrics
- 1% rule
- 1.29% ✓
- Cap rate
- 11.28%
- Cash-on-cash
- 17.82%
- DSCR
- 1.79
- GRM
- 6.5
CMA / ARV
- ARV (on-the-fly)
- $167,832
- Comps found
- 12
Show comp detail 12 sales within ~0.75 mi
| Address | Dist | Beds/Ba | Sqft | Sold | Price | $/sf | Match |
|---|---|---|---|---|---|---|---|
| 8651 Foothill Blvd #82 | 0.00mi | 2/2.0 (-1) | 1,554 (0%) | 1mo | $280,000 | $180 | 94 |
| 8651 Foothill Blvd #42 | 0.00mi | 3/2.0 | 1,680 (+8%) | 0mo | $240,000 | $143 | 86 |
| 8651 Foothill Blvd #159 | 0.00mi | 2/2.0 (-1) | 1,488 (-4%) | 5mo | $145,000 | $97 | 84 |
| 8651 Foothill Blvd #92 | 0.00mi | 2/2.0 (-1) | 1,440 (-7%) | 1mo | $156,000 | $108 | 82 |
| 8651 Foothill Blvd #8 | 0.00mi | 2/2.0 (-1) | 1,562 (+0%) | 14mo | $175,000 | $112 | 82 |
| 8651 Foothill Blvd #99 | 0.00mi | 2/2.0 (-1) | 1,440 (-7%) | 2mo | $140,000 | $97 | 81 |
| 8651 Foothill Blvd #157 | 0.00mi | 2/2.0 (-1) | 1,440 (-7%) | 3mo | $142,000 | $99 | 80 |
| 8651 Foothill Blvd #187 | 0.00mi | 2/2.0 (-1) | 1,464 (-6%) | 14mo | $100,000 | $68 | 74 |
| 8651 Foothill Blvd #190 | 0.00mi | 2/2.0 (-1) | 1,440 (-7%) | 14mo | $145,000 | $101 | 71 |
| 8389 Baker Ave #61 | 0.17mi | 3/2.0 | 1,425 (-8%) | 9mo | $175,000 | $123 | 71 |
| 8651 Foothill Blvd #115 | 0.00mi | 2/2.0 (-1) | 1,440 (-7%) | 15mo | $195,000 | $135 | 70 |
| 8651 Foothill Unit 138. | 0.00mi | 2/2.0 (-1) | 1,440 (-7%) | 16mo | $150,000 | $104 | 69 |
Match score weights: distance 35% · size 25% · config 20% · recency 20%. Top-matched comps best support the ARV.
Projected returns pro-forma
-3.0% appreciation · 0.84% rent growth · sell at horizon
- IRR
- 7.0%
- Equity multiple
- 1.27×
- Total profit
- $20,171
- Equity at exit
- $40,109
- IRR
- 14.5%
- Equity multiple
- 2.06×
- Total profit
- $79,933
- Equity at exit
- $23,258
Cash invested: $75,320 (down + closing). Projections, not guarantees.
Landlord ↔ Tenant lean methodology
- Overall (STATE)
- 18 Strongly Tenant-Friendly
- State California
- 18 Strongly Tenant-Friendly · D+13
- County
- — inherits STATE
- City
- — inherits STATE
ZIP-level market 91730
- Rents YoY
- 0.8%
- Active inventory
- 142
- Price-to-rent
- 6.5×
Monthly cashflow live
- Estimated rent
- $3,463 high interval (Pro) →
- Mortgage (P&I)
- −$1,411
- Tax from tax record
- −$95 /mo · $1,141/yr
- Insurance
- −$112
- HOA
- −$0
- Vacancy / Maint / Mgmt
- −$727
- Net cashflow
- $1,118
Break-even live
Sensitivity live
| Price | -10% $1,271 | -5% $1,194 | +0% $1,118 | +5% $1,042 | +10% $966 |
|---|---|---|---|---|---|
| Rent | -10% $845 | -5% $981 | +0% $1,118 | +5% $1,255 | +10% $1,392 |
| Rate | -1.0pp $1,254 | -0.5pp $1,187 | base $1,118 | +0.5pp $1,049 | +1.0pp $978 |
UW: 25.0% down · 7.5% · 30yr · 1.5% tax · 5.0% vac · 8.0% maint · 8.0% mgmt
Financing live
Cash to close
- Down payment
- $67,250
- Closing costs
- $8,070
- Reserves months
- —
- Total cash needed
- —
Loan-product check · same deal, 3 products live
Conventional
25% down · 7.5% · 30yr
- Down + closing
- —
- Monthly P&I
- —
- Monthly cashflow
- —
- DSCR
- —
- Eligible?
- —
Personal DTI + credit; lowest rate.
DSCR
20% down · 8.5% · 30yr
- Down + closing
- —
- Monthly P&I
- —
- Monthly cashflow
- —
- DSCR
- —
- Eligible?
- —
No personal income docs; deal must DSCR.
Hard money
10% down · 12.0% · 12mo
- Down + closing
- —
- Monthly P&I
- —
- Monthly cashflow
- —
- DSCR
- —
- Eligible?
- —
Short-term bridge; refi at stabilization.
Rent comps 23 comps
| Address | Beds | Baths | Sqft | Rent | $/sqft | DOM | Units | Dist |
|---|---|---|---|---|---|---|---|---|
| 8630 Cava Dr Rancho Cucamonga, CA | 4.0 | 2.5 | 1763 | $3,890 | $2.21 | 13d | 1 | 0.22mi |
| 8650 Cava Dr Rancho Cucamonga, CA | 3.0 | 2.5 | 1763 | $3,200 | $1.82 | 17d | 1 | 0.22mi |
| 8491 Gabrielino Ct Unit 69 Rancho Cucamonga, CA | 3.0 | 2.5 | 1417 | $3,850 | $2.72 | 0d | 1 | 0.24mi |
| 8567 Cava Dr Rancho Cucamonga, CA | 3.0 | 2.5 | 1763 | $3,600 | $2.04 | 0d | 1 | 0.25mi |
| 8250 Vineyard Ave Rancho Cucamonga, CA | 2.0–3.0 | 2.0–2.5 | 1094 | $3,405 | $3.11 | 0d | 15 | 0.26mi |
| 8300 Gabriel Dr Unit B Rancho Cucamonga, CA | 3.0 | 2.0 | 1140 | $3,350 | $2.94 | 0d | 1 | 0.31mi |
| 8167 Vineyard Ave #61 Rancho Cucamonga, CA | 3.0 | 2.5 | 1221 | $2,750 | $2.25 | 26d | 1 | 0.37mi |
| 8523 Jasper St Rancho Cucamonga, CA | 4.0 | 2.0 | 1640 | $3,300 | $2.01 | 0d | 1 | 0.40mi |
| 8210 Rancheria Dr Unit 8 Rancho Cucamonga, CA | 3.0 | 2.0 | 1200 | $2,895 | $2.41 | 0d | 1 | 0.52mi |
| 8555 Sandalwood Ct Rancho Cucamonga, CA | 3.0 | 2.0 | 1400 | $3,375 | $2.41 | 0d | 1 | 0.54mi |
| 8760 Church St Rancho Cucamonga, CA | 3.0 | 1.5 | 1151 | $3,395 | $2.95 | 12d | 1 | 0.73mi |
| 8445 Chaffee St Rancho Cucamonga, CA | 4.0 | 2.0 | 1438 | $3,300 | $2.29 | 17d | 1 | 0.74mi |
| 1443 Orange Grove St Upland, CA | 4.0 | 3.0 | 2146 | $3,380 | $1.58 | 0d | 1 | 0.84mi |
| 1425 Cottonwood St Upland, CA | 3.0 | 2.5 | 1893 | $3,099 | $1.64 | 1d | 1 | 0.84mi |
| 7522 Alta Cuesta Dr Rancho Cucamonga, CA | 2.0 | 2.0 | 1055 | $3,495 | $3.31 | 3d | 1 | 0.94mi |
| 1420 Felicita Ct Upland, CA | 3.0 | 2.0 | 1339 | $3,095 | $2.31 | 7d | 1 | 1.03mi |
| 863 N 9th Ave Upland, CA | 3.0 | 2.0 | 1507 | $3,600 | $2.39 | 0d | 1 | 1.26mi |
| 306 N 10th Ave Apt -3 Upland, CA | 3.0 | 2.0 | 1450 | $3,000 | $2.07 | 45d | 1 | 1.27mi |
| 1405 E 15th St Upland, CA | 3.0 | 2.0 | 2212 | $3,900 | $1.76 | 0d | 1 | 1.27mi |
| 9143 W Rancho Park Cir Rancho Cucamonga, CA | 4.0 | 3.0 | 2001 | $3,200 | $1.60 | 0d | 1 | 1.36mi |
| 250 Settlers Rd Upland, CA | 4.0 | 2.5 | 1972 | $3,980 | $2.02 | 21d | 1 | 1.37mi |
| 890 N Campus Ave Apt B Upland, CA | 3.0 | 1.5 | 1380 | $2,900 | $2.10 | 22d | 1 | 1.39mi |
| 329 N Campus Ave Upland, CA | 3.0 | 3.0 | 1982 | $3,750 | $1.89 | 14d | 1 | 1.49mi |
Listing history 11 events
-
2026-06-21days on market $269,000 Active 17 DOM
-
2026-06-18days on market $269,000 Active 14 DOM
-
2026-06-17days on market $269,000 Active 13 DOM
-
2026-06-16days on market $269,000 Active 12 DOM
-
2026-06-15days on market $269,000 Active 11 DOM
-
2026-06-13days on market $269,000 Active 9 DOM
-
2026-06-13days on market $269,000 Active 8 DOM
-
2026-06-09days on market $269,000 Active 5 DOM
-
2026-06-08days on market $269,000 Active 4 DOM
-
2026-06-07remarks 699-char remark
-
2026-06-07$269,000 Active 3 DOM
ⓘ Source: listings_history table (triggers on properties + properties_extension) + one-shot
backfill from property_details.listing_events for pre-trigger history.
Tax reassessment forecast CA · Resets to sale price
- Current annual tax
- $1,141 · $95/mo
- Projected year-2 tax
- $2,044 · $170/mo
- Expected delta
- +$903/yr (+$75/mo · 79.2%)
ⓘ Screening estimate from a state-policy table — verify with the county assessor before closing.
Climate risk First Street
- Flood 3/10 Moderate FEMA zone X (unshaded) · 20% chance over 30 yrs
- Wildfire 1/10 Low
- Heat 7/10 Severe 6 d/yr ≥100°F today · 17 d/yr by 30 yrs out
- Wind 1/10 Low
- Air quality 9/10 Extreme 23 unhealthy d/yr today · 28 by 30 yrs out
Nearby sold comps map
Loading sold comps map…
Walkable amenities ~0.75 mi
Loading nearby amenities…
Taxation est. · year 1
- Rental income
- $41,562
- − Mortgage interest
- −$15,068
- − Property taxes
- −$1,141
- − Insurance
- −$1,345
- − Repairs & maintenance
- −$3,325
- − Management
- −$3,325
- − Depreciation
- −$7,825
- Taxable income
- $9,532
- Est. tax owed @ 24.0%
- −$2,288
- After-tax cash flow
- $11,132/yr
For passive investors: Depreciation is non-cash, so a rental often shows a tax loss while cash-flowing — sheltering income. Rental losses are passive: they offset passive income freely, and up to $25,000/yr can offset ordinary (W-2) income if you actively participate and your MAGI is under $100k (phasing out to $0 by $150k); unused losses carry forward. On sale, claimed depreciation is recaptured at up to 25%, and gains may owe capital-gains tax (a 1031 exchange can defer both). Figures are a year-1 estimate at your 24.0% rate — not tax advice; consult a CPA.
Schools (NCES district)
- District
- Central Elementary
- NCES district ID
- 0607950
- Math proficiency
- 25% ▼ -18.00%
- Reading proficiency
- 25% ▼ -31.00%
- Median HH income
- $64,090
- Composite
- 23.41/100
- National rank
- #7895
- State rank
- #379 of 517 in CA
Livability — Rancho Cucamonga
- Score
- 70/100
- State rank
- #237
- US rank
- #7808
Category grades
Schools grade is shown separately in the Schools card above.
Census & demographics
- Census place
- Rancho Cucamonga, CA
- County
- San Bernardino County · 2,030,291 people
- City population
- 175,531
- Metro
- Riverside-San Bernardino-Ontario, CA
- Population (ZIP)
- 71,613
- Household income
- $92,237
- Rent vs Own
- Severe rent burden
- 4013.0
Population outlook (San Bernardino County) Hauer SSP2
- Today (2025)
- 2,300,329 people
- By 2030
- 2,378,907 · +3.4%
- By 2040
- 2,523,137 · +9.7%
- By 2050
- 2,642,388 · +14.9%
- By 2075
- 2,880,769 · +25.2%
- By 2100
- 2,909,436 · +26.5%
Race, ethnicity, and origin ACS 2023
- Neighborhood character
- Highly diverse neighborhood (Simpson 0.71)
- Race & ethnicity
- Hispanic / Latino 43% White 28% Two or more races 16% Asian 14% Black 10% Native American 2%
- Hispanic origin (detail)
- Mexican 33% Salvadoran 1%
- Common ancestry
- Lithuanian 1% Italian 1% Slovak 1%
- Foreign-born
- 23% · Canada, China, South Korea
- Languages at home
- 61% English-only · Spanish 22% Chinese 4% Tagalog/Filipino 4%
Political lean MEDSL · San Bernardino
- 2024 margin
- Toss-up / Even · D 47.5% · R 49.7% · Other 2.8%
- 2008→2024 swing
- -8.5pp toward R · 2008: 6.3pp · 2024: -2.1pp
- All cycles
- 2024: R+2.1 2020: D+10.7 2016: D+9.8 2012: D+5.4 2008: D+6.3
Not yet ingested
- Civics
- —
Market trends
- HPI YoY
- ▼ -554.10%
- Current HPI
- 404.3113
- Rent YoY
- ▲ 0.84%
- Metro
- Riverside-San Bernardino-Ontario, CA
- State GDP YoY
- ▲ 3.21%
- F500 in state
- 116
Industry mix (Fortune 500 HQ in CA)
| Industry | F500 HQs | Revenue |
|---|---|---|
| Technology | 27 | $1,492B |
|
||
| Financial Services | 3 | $174B |
|
||
| Retail | 3 | $44B |
|
||
| Insurance | 3 | $26B |
|
||
| Media / Entertainment | 2 | $115B |
|
||
| Pharmaceuticals / Biotech | 2 | $62B |
|
||
Price history
+79.5% since first listed5 events — show timeline
- 2026-06-04 Listed $269,000 CRMLS
- 2016-10-04 Listing Removed — CRMLS
- 2016-08-27 Price Changed $45,900 CRMLS
- 2016-07-07 Price Changed $49,900 CRMLS
- 2016-07-07 Listed $149,900 CRMLS
Property tax history
-0.1%/yrLatest (2025): $1,141 · +0.7% YoY. Source: county tax records.
Cash-flow waterfall
monthlySold comps — $/sqft
last 12 mo · ≤1 miLoading sold comps…