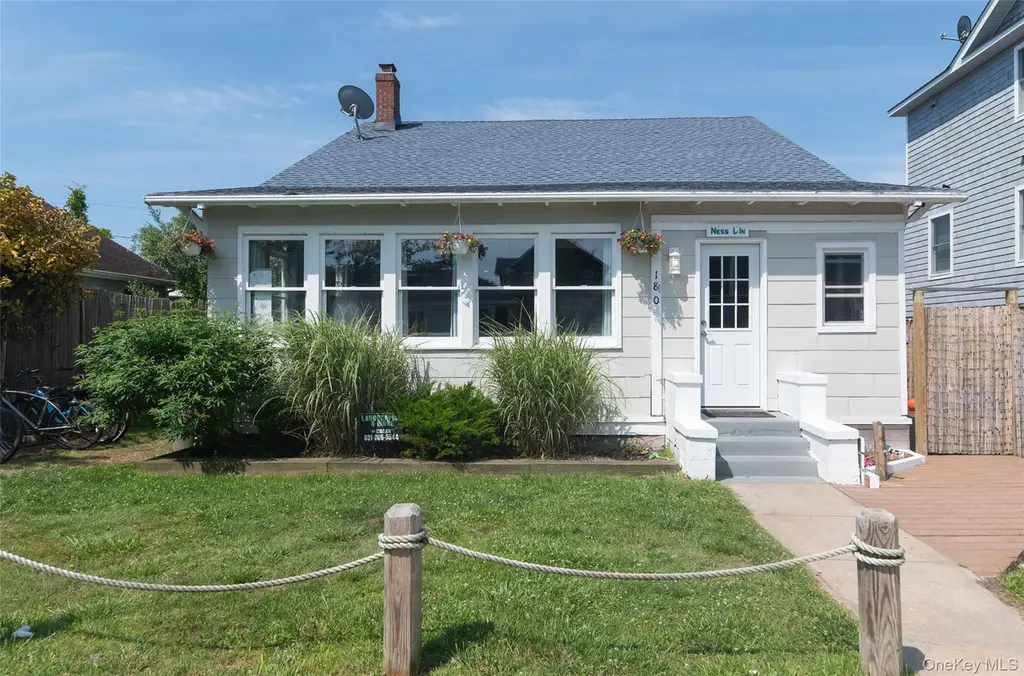
180 Cottage Walk · Ocean Beach, NY
Flood risk 10/10 · Severe
- FEMA flood zone
- AE
- Chance of flooding over 30 yrs
- 0.99%
- Est. flood insurance / yr
- $2,026 – $9,024
Fire risk 1/10 · Minimal
- Est. fire insurance / yr
- $691 – $1,283
Heat risk 5/10 · Moderate
- Hot days now (above 92°F)
- 7 days/yr
- Hot days in 30 yrs
- 18 days/yr
Wind risk 8/10 · Major
- Chance of severe wind over 30 yrs
- 80.0%
Air-quality risk 5/10 · Moderate
- Unhealthy air days now
- 9 days/yr
- Unhealthy air days in 30 yrs
- 9 days/yr
Risk factors via First Street. Map © Google.
Why this score? — see what drove the C- grade
The composite is a weighted blend of 9 inputs, each scored 0–100. Each bar is that input's sub-score; the figure is the points it added to the 100-point composite (weight × sub-score).
- ARV discount +14.3/15.0
- Appreciation +10.0/10.0
- Cash flow +8.2/30.0
- Schools +7.2/10.0
- Livability +2.6/5.0
- Rent growth +2.5/5.0
- Condition / age +2.5/5.0
- DSCR +2.2/10.0
- 1% rule +1.8/10.0
$1,599,999
🖨 Deal sheet (PDF) 📄 Offer letter ✓ Due diligence
Listing remarks MLS
This beautifully maintained 5-bedroom, 2.5-bath home is a standout investment and vacation retreat in the heart of Fire Island. Thoughtfully decorated with a charming nautical theme, the home offers a bright, coastal feel throughout. Split-unit air conditioning in every room ensures comfort all season long. Designed for year-round living, this home allows you to enjoy Fire Island in every season. The open-concept living and dining area is ideal for entertaining, comfortably accommodating large gatherings or relaxing after a day at the beach. Step outside to a delightful sitting area complete with an outdoor shower, perfect for embracing island living at its best. Centrally located and close to town, the property offers excellent accessibility to local attractions and amenities. Fire Island is a sought-after vacation destination, and village amenities include a community house and playground, with seasonal access to tennis and pickleball courts, and a marina. Whether you’re seeking a strong income producing rental, a year round residence, or a memorable getaway, this home delivers the ideal blend of comfort, location, and investment appeal.
Key facts
- Outdoor shower
- Marina
- 3,920 sq ft lot
Tags
Neighborhood map
What this means for you Summary
Snapshot
- This is a 5-bed/2.5-bath single-family listed at $1.60M.
Deal economics
- At list price, monthly cash flow is $-2k ($-23k/yr) — negative.
- To cash-flow at today's rent, offer at most $1.25M (21.6% below list).
- To meet the 1% rule (rent ≥ 1% of price), the offer needs to be $1.08M (32.4% below list).
- Recommended offer: $1.08M (32.4% below list) — sets the bar for 1% rule.
Location & tenants
- Location reads 52/100 on livability (#1,163 in NY) — a working-class tenant base; expect higher turnover. Strengths: health & safety A+, crime A; Watch: amenities F, commute F, employment F.
- Fire Island Union Free School District (suburban): math 75% / reading 90% proficiency, ranked #44 of 590 in NY (top 8%) — strong family-tenant draw, lease renewals of 3-5y typical; only 14% free/reduced lunch — higher-income household profile.
- Zoned schools: Woodhull School (math 75% / reading 90%, grade A+, #133 of 2,108 statewide, top 6%, 34 students, 0% FRL).
- Market conditions: 35 active listings in the ZIP; 13 comparable units currently listed for rent nearby; rentals lingering (median 45d on market — plan ~5-8 weeks vacancy on turnover, expect pricing pressure); 62% of comp listings sitting > 30 days — soft ceiling on asking rent; 1,366 units permitted in Suffolk County in 2024 (216 in 5+ unit buildings).
Forward outlook
- In year one you build about $171k of equity ($11k loan paydown + $160k appreciation (10.0% local appreciation)).
- Suffolk County population projected to shrink 5% by 2050 — rents likely to lag national; underwrite the cash flow, not the appreciation.
- By year 2, paydown + projected appreciation supports a ~$275k cash-out refi (75% LTV) — recoverable capital for the next deal without selling this one.
Negotiation context
- It's been on market 128 days — a 12% lower offer ($1.41M) is reasonable based on typical stale-listing flexibility.
- Current owner paid $450k; list at $1.60M implies a 256% gain — meaningful room to come down on a strong offer.
Risks & watch-outs
- Watch-outs: flood insurance adds $460/mo; built in 1947 — expect roof / HVAC / electrical / plumbing capex.
- Climate carrying-cost: in FEMA flood zone AE (mandatory federal flood insurance); severe wind risk, 80% chance of damaging wind over 30y; extreme-heat days projected 7→18/yr by 2055 (HVAC capex compounding) — expect insurance premiums to compound above CPI over the hold.
Questions for the listing agent
- What do current leases actually rent for vs. the listed asking? Can we see a recent rent roll and the last 12 months of T-12 income?
- It's been on market 128 days. Have you received any prior offers? Is the seller open to a 32% concession, seller financing, or rate buy-down credit?
- Built in 1947 — when were the roof, HVAC, electrical panel, plumbing, and water heater last replaced?
- What's the actual annual flood-insurance premium (NFIP or private), and is the property in a SFHA with mandatory coverage?
- Why hasn't it sold? Are there any deal-killer items the seller is aware of (foundation, flood, title, zoning, code violations)?
- Is there a deadline driving the sale (1031 exchange, divorce, estate, relocation)? That informs how much negotiation room exists.
- Schools are B-rated — typically a magnet for longer-tenancy family renters. What's the average tenant stay here, and is there a school-zone premium baked into asking?
- What's the average days-on-market for RENTAL listings here right now (not sales)? A rising rental-DOM trend means longer vacancies and softer asking-rent achievability than the comps imply.
- What's the recent tenant-quality profile in this submarket — average credit score on applications, eviction rate, late-payment / NSF rate, and stable-employment percentage? A property-management company in the area should have these aggregated.
- How much new for-sale + rental construction is in the pipeline within 1–3 miles? Heavy new supply typically softens prices + rents 12–24 months out; constrained supply supports both.
Investment metrics
- 1% rule
- 0.68% ✗
- Cap rate
- 5.17%
- Cash-on-cash
- -4.01%
- DSCR
- 0.82
- GRM
- 12.3
CMA / ARV
- ARV (median comp)
- $1,884,390
- List price
- $1,599,999
- Delta
- -15.09%
- Verdict
- UNDERPRICED
- Comps
- 15 within 1.0 mi
Show comp detail 4 sales within ~0.75 mi
| Address | Dist | Beds/Ba | Sqft | Sold | Price | $/sf | Match |
|---|---|---|---|---|---|---|---|
| 976 Surfview Walk | 0.21mi | 4/2.0 (-1) | 1,757 (+3%) | 7mo | $1,581,250 | $900 | 72 |
| 333 Surf Rd | 0.14mi | 6/3.0 (+1) | 1,900 (+12%) | 7mo | $1,750,000 | $921 | 62 |
| 657 Ocean Breeze | 0.12mi | 4/2.0 (-1) | 1,800 (+6%) | 21mo | $1,550,000 | $861 | 61 |
| 37 Duneway Ave | 0.37mi | 5/3.0 | 1,951 (+14%) | 4mo | $1,405,000 | $720 | 54 |
Match score weights: distance 35% · size 25% · config 20% · recency 20%. Top-matched comps best support the ARV.
Projected returns pro-forma
10.0% appreciation · 3.0% rent growth · sell at horizon
- IRR
- 20.6%
- Equity multiple
- 2.67×
- Total profit
- $746,644
- Equity at exit
- $1,441,406
- IRR
- 18.7%
- Equity multiple
- 6.13×
- Total profit
- $2,296,345
- Equity at exit
- $3,108,446
Cash invested: $448,000 (down + closing). Projections, not guarantees.
Landlord ↔ Tenant lean methodology
- Overall (STATE)
- 15 Strongly Tenant-Friendly
- State New York
- 15 Strongly Tenant-Friendly · D+10
- County
- — inherits STATE
- City
- — inherits STATE
ZIP-level market 11770
- Home prices YoY
- 13.7%
- Active inventory
- 35
- Price-to-rent
- 12.3×
Monthly cashflow live
- Estimated rent
- $10,809 high interval (Pro) →
- Mortgage (P&I)
- −$8,391
- Tax from tax record
- −$977 /mo · $11,727/yr
- Insurance
- −$667
- Flood insurance flood zone
- −$460 /mo · $5,525/yr
- HOA
- −$0
- Vacancy / Maint / Mgmt
- −$2,270
- Net cashflow
- $-1,956
Break-even live
Sensitivity live
| Price | -10% $-1,050 | -5% $-1,503 | +0% $-1,956 | +5% $-2,409 | +10% $-2,862 |
|---|---|---|---|---|---|
| Rent | -10% $-2,810 | -5% $-2,383 | +0% $-1,956 | +5% $-1,529 | +10% $-1,102 |
| Rate | -1.0pp $-1,150 | -0.5pp $-1,549 | base $-1,956 | +0.5pp $-2,371 | +1.0pp $-2,792 |
UW: 25.0% down · 7.5% · 30yr · 1.5% tax · 5.0% vac · 8.0% maint · 8.0% mgmt
Financing live
Cash to close
- Down payment
- $400,000
- Closing costs
- $48,000
- Reserves months
- —
- Total cash needed
- —
Loan-product check · same deal, 3 products live
Conventional
25% down · 7.5% · 30yr
- Down + closing
- —
- Monthly P&I
- —
- Monthly cashflow
- —
- DSCR
- —
- Eligible?
- —
Personal DTI + credit; lowest rate.
DSCR
20% down · 8.5% · 30yr
- Down + closing
- —
- Monthly P&I
- —
- Monthly cashflow
- —
- DSCR
- —
- Eligible?
- —
No personal income docs; deal must DSCR.
Hard money
10% down · 12.0% · 12mo
- Down + closing
- —
- Monthly P&I
- —
- Monthly cashflow
- —
- DSCR
- —
- Eligible?
- —
Short-term bridge; refi at stabilization.
Rent comps 13 comps
| Address | Beds | Baths | Sqft | Rent | $/sqft | DOM | Units | Dist |
|---|---|---|---|---|---|---|---|---|
| 319 Wilmot Rd Ocean Beach, NY | 4.0 | 2.5 | 2089 | $14,000 | $6.70 | 23d | 1 | 0.11mi |
| 294 Wilmot Rd Ocean Beach, NY | 5.0 | 2.5 | 1852 | $12,500 | $6.75 | 20d | 1 | 0.12mi |
| 290 Wilmot Rd Ocean Beach, NY | 5.0 | 2.0 | 1800 | $12,500 | $6.94 | 18d | 1 | 0.13mi |
| 437 Dehnhoff Walk Ocean Beach, NY | 4.0 | 2.0 | 1496 | $6,000 | $4.01 | 45d | 1 | 0.14mi |
| 112 Ocean Rd Ocean Beach, NY | 4.0 | 2.0 | 1560 | $13,000 | $8.33 | 45d | 1 | 0.18mi |
| 55 Ocean Rd Ocean Beach, NY | 5.0 | 3.0 | 1577 | $7,500 | $4.76 | 20d | 1 | 0.18mi |
| 100 Clipper Roadway Ocean Beach, NY | 5.0 | 2.0 | 2146 | $8,500 | $3.96 | 45d | 1 | 0.22mi |
| 224 Wilmot Rd Ocean Beach, NY | 5.0 | 2.5 | 2180 | $14,000 | $6.42 | 45d | 1 | 0.22mi |
| 7 Atlantic Ave East Islip, NY | 5.0 | 3.0 | 2100 | $10,950 | $5.21 | 45d | 1 | 0.23mi |
| 150 Clipper Roadway Ocean Beach, NY | 6.0 | 2.5 | 1674 | $8,000 | $4.78 | 45d | 1 | 0.26mi |
| 35 Bay Shore, NY | 5.0 | 3.0 | 2185 | $12,000 | $5.49 | 45d | 1 | 0.31mi |
| 43 Crescent Ave Ocean Beach, NY | 4.0 | 2.5 | 1400 | $8,500 | $6.07 | 17d | 1 | 0.38mi |
| 54 Thompson Ave Ocean Beach, NY | 5.0 | 2.0 | 1680 | $8,500 | $5.06 | 45d | 1 | 1.01mi |
Listing history 17 events
-
2026-06-21days on market $1,599,999 Active 128 DOM
-
2026-06-18days on market $1,599,999 Active 125 DOM
-
2026-06-17days on market $1,599,999 Active 124 DOM
-
2026-06-16days on market $1,599,999 Active 123 DOM
-
2026-06-15days on market $1,599,999 Active 122 DOM
-
2026-06-13days on market $1,599,999 Active 120 DOM
-
2026-06-13days on market $1,599,999 Active 119 DOM
-
2026-06-09days on market $1,599,999 Active 116 DOM
-
2026-06-08days on market $1,599,999 Active 115 DOM
-
2026-06-07days on market $1,599,999 Active 114 DOM
-
2026-06-04days on market $1,599,999 Active 111 DOM
-
2026-06-03days on market $1,599,999 Active 110 DOM
-
2026-06-02days on market $1,599,999 Active 109 DOM
-
2026-06-01days on market $1,599,999 Active 108 DOM
-
2026-05-31days on market $1,599,999 Active 107 DOM
-
2026-02-05$1,599,999 Active 1163-char remark
Show marketing remark (1163 chars)
This beautifully maintained 5-bedroom, 2.5-bath home is a standout investment and vacation retreat in the heart of Fire Island. Thoughtfully decorated with a charming nautical theme, the home offers a bright, coastal feel throughout. Split-unit air conditioning in every room ensures comfort all season long. Designed for year-round living, this home allows you to enjoy Fire Island in every season. The open-concept living and dining area is ideal for entertaining, comfortably accommodating large gatherings or relaxing after a day at the beach. Step outside to a delightful sitting area complete with an outdoor shower, perfect for embracing island living at its best. Centrally located and close to town, the property offers excellent accessibility to local attractions and amenities. Fire Island is a sought-after vacation destination, and village amenities include a community house and playground, with seasonal access to tennis and pickleball courts, and a marina. Whether you’re seeking a strong income producing rental, a year round residence, or a memorable getaway, this home delivers the ideal blend of comfort, location, and investment appeal.
-
2013-12-30soldstatus $450,000
ⓘ Source: listings_history table (triggers on properties + properties_extension) + one-shot
backfill from property_details.listing_events for pre-trigger history.
Tax reassessment forecast NY · Partial reset (capped growth)
- Current annual tax
- $11,727 · $977/mo
- Projected year-2 tax
- $19,384 · $1,615/mo
- Expected delta
- +$7,656/yr (+$638/mo · 65.3%)
ⓘ Screening estimate from a state-policy table — verify with the county assessor before closing.
Climate risk First Street
- Flood 10/10 Extreme FEMA zone AE · 99% chance over 30 yrs
- Wildfire 1/10 Low
- Heat 5/10 Major 7 d/yr ≥92°F today · 18 d/yr by 30 yrs out
- Wind 8/10 Severe 80% chance of damaging wind over 30 yrs
- Air quality 5/10 Major 9 unhealthy d/yr today · 9 by 30 yrs out
Nearby sold comps map
Loading sold comps map…
Walkable amenities ~0.75 mi
Loading nearby amenities…
Taxation est. · year 1
- Rental income
- $129,706
- − Mortgage interest
- −$89,625
- − Property taxes
- −$11,727
- − Insurance
- −$13,525
- − Repairs & maintenance
- −$10,376
- − Management
- −$10,376
- − Depreciation
- −$46,545
- Taxable loss
- −$52,470
- Est. tax savings @ 24.0%
- +$12,593
- After-tax cash flow
- $-10,879/yr
For passive investors: Depreciation is non-cash, so a rental often shows a tax loss while cash-flowing — sheltering income. Rental losses are passive: they offset passive income freely, and up to $25,000/yr can offset ordinary (W-2) income if you actively participate and your MAGI is under $100k (phasing out to $0 by $150k); unused losses carry forward. On sale, claimed depreciation is recaptured at up to 25%, and gains may owe capital-gains tax (a 1031 exchange can defer both). Figures are a year-1 estimate at your 24.0% rate — not tax advice; consult a CPA.
Schools (NCES district)
- District
- Fire Island Union Free School District
- NCES district ID
- 3621540
- Math proficiency
- 75% ▲ 25.00%
- Reading proficiency
- 90% ▲ 40.00%
- Median HH income
- $69,449
- Composite
- 71.53/100
- National rank
- #222
- State rank
- #44 of 590 in NY
Livability — Ocean Beach
- Score
- 52/100
- State rank
- #1163
- US rank
- #25096
Category grades
Schools grade is shown separately in the Schools card above.
Census & demographics
- Census place
- Ocean Beach, NY
- Population (ZIP)
- 124
Population outlook (Suffolk County) Hauer SSP2
- Today (2025)
- 1,505,262 people
- By 2030
- 1,498,318 · -0.5%
- By 2040
- 1,471,101 · -2.3%
- By 2050
- 1,424,848 · -5.3%
- By 2075
- 1,337,157 · -11.2%
- By 2100
- 1,217,720 · -19.1%
Race, ethnicity, and origin ACS 2023
- Neighborhood character
- Majority Hispanic (52%)
- Race & ethnicity
- Hispanic / Latino 52% White 48% Two or more races 27%
- Hispanic origin (detail)
- Puerto Rican 15% Dominican 12%
- Common ancestry
- Lithuanian 2%
- Foreign-born
- 16% · Canada
- Languages at home
- 42% English-only · Spanish 56% French/Haitian/Cajun 2%
Political lean MEDSL · Suffolk
- 2024 margin
- Lean R (+10.0) · D 45.0% · R 55.0%
- 2008→2024 swing
- -16.0pp toward R · 2008: 6.0pp · 2024: -10.0pp
- All cycles
- 2024: R+10.0 2020: R+0.0 2016: R+8.2 2012: D+2.9 2008: D+6.0
Not yet ingested
- Civics
- —
Market trends
- HPI YoY
- ▲ 69.28%
- Current HPI
- 575.12
- Rent YoY
- —
- Metro
- —
- State GDP YoY
- ▲ 2.60%
- F500 in state
- 92
Industry mix (Fortune 500 HQ in NY)
| Industry | F500 HQs | Revenue |
|---|---|---|
| Financial Services | 10 | $950B |
|
||
| Consumer Goods | 9 | $162B |
|
||
| Insurance | 4 | $225B |
|
||
| Telecommunications | 2 | $144B |
|
||
| Pharmaceuticals | 2 | $112B |
|
||
| Media / Entertainment | 2 | $69B |
|
||
Price history
+255.6% since first listed2 events — show timeline
- 2026-02-05 Listed $1,599,999 OneKey® MLS as Distributed by MLS Grid
- 2013-12-30 Sold (Public Records) $450,000 Public Records
Property tax history
+12.5%/yrLatest (2025): $11,727 · +428.9% YoY. Source: county tax records.
Cash-flow waterfall
monthlySold comps — $/sqft
last 12 mo · ≤1 miLoading sold comps…