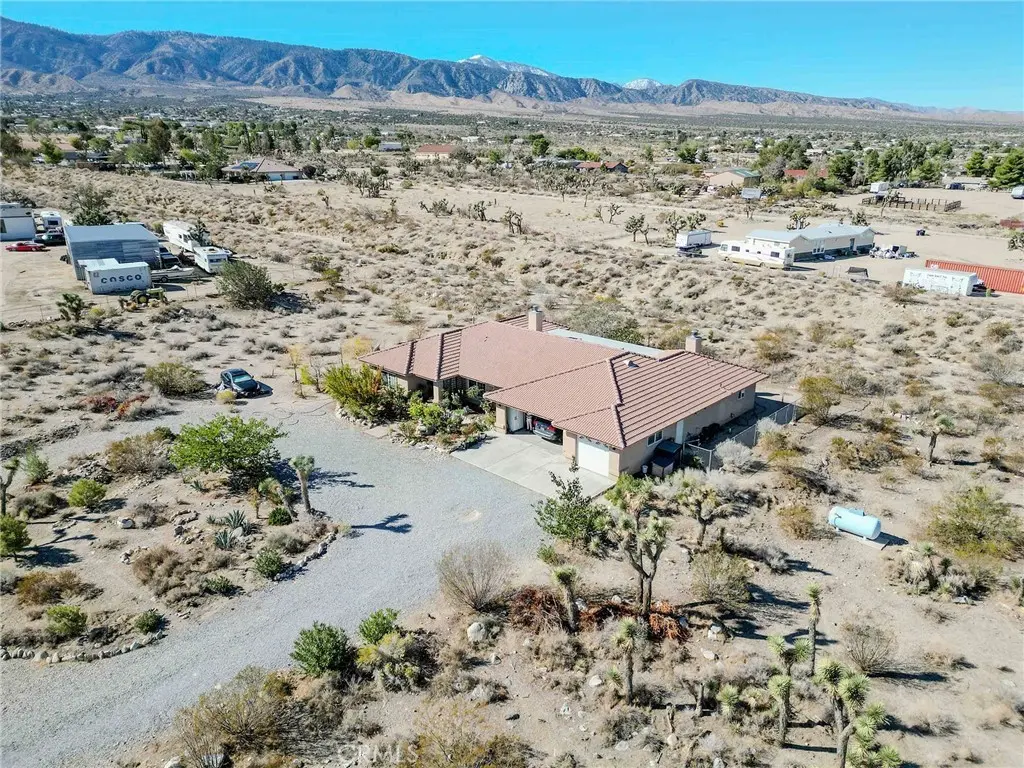
11522 Ponderosa · Piñon Hills, CA
Flood risk 1/10 · Minimal
- FEMA flood zone
- D
- Chance of flooding over 30 yrs
- 0.0%
- Est. flood insurance / yr
- $544 – $1,084
Fire risk 7/10 · Major
- Est. fire insurance / yr
- $659 – $1,223
Heat risk 6/10 · Moderate
- Hot days now (above 96°F)
- 1 days/yr
- Hot days in 30 yrs
- 2 days/yr
Wind risk 1/10 · Minimal
- Chance of severe wind over 30 yrs
- —
Air-quality risk 9/10 · Severe
- Unhealthy air days now
- 23 days/yr
- Unhealthy air days in 30 yrs
- 27 days/yr
Risk factors via First Street. Map © Google.
Why this score? — see what drove the D- grade
The composite is a weighted blend of 9 inputs, each scored 0–100. Each bar is that input's sub-score; the figure is the points it added to the 100-point composite (weight × sub-score).
- ARV discount +11.1/15.0
- Appreciation +10.0/10.0
- Cash flow +6.0/30.0
- Schools +3.7/10.0
- Rent growth +2.5/5.0
- Livability +2.5/5.0
- Condition / age +2.5/5.0
- 1% rule +0.3/10.0
- DSCR +0.3/10.0
$489,000
🖨 Deal sheet 📄 Offer letter ✓ Due diligence
Listing remarks
Welcome to 11522 Ponderosa Road, located in the serene city of Pinon Hills! The home opens into a spacious great room, seamlessly connecting the living area, kitchen, and dining space—perfect for everyday living or entertaining. The expansive kitchen is equipped with abundant cabinetry, ample counter space, and brand-new stainless-steel appliances. A large laundry area adds even more convenience and storage options. On one side of the home, two bedrooms share a full bathroom. The family room and primary bedroom have a fireplace. On the opposite side, the private primary suite features a walk-in closet and a roomy en-suite bathroom. Home also has an automatic front gate. Step outside t
Key facts
- Expansive kitchen
- Walk-in closet
- Large laundry area
Tags
Property features AI
Finance
- Financial info: Subject to special assessments
- HOA & community: Mountainous community setting
Exterior
- Parking: Attached garage with 3 spaces (3 parking spaces total)
- Security: Automatic gate
- Utilities: Public sewer; District/public water
- Home design: Single-story; Front entry; Has a view
- Construction: No ADU; Public records used as year-built source
- Exterior features: House structure; Yard; Horse property; No pool
Interior
- Kitchen: Refrigerator; Gas range
- Bedrooms: Four main-level bedrooms
- Bathrooms: Two full bathrooms
- Heating & cooling: Propane heating with forced air central furnace; Central air conditioning
- Interior features: Front entry; One-level layout; Automatic gate; Bonus room; Family room; Fireplaces in the primary bedroom and family room
- Laundry & utility: Laundry room inside the home (individual room)
Neighborhood map
What this means for you Summary
Snapshot
- This is a 4-bed/2.0-bath single-family listed at $489k.
Deal economics
- At list price, monthly cash flow is $-937 ($-11k/yr) — negative.
- To cash-flow at today's rent, offer at most $324k (33.8% below list).
- To meet the 1% rule (rent ≥ 1% of price), the offer needs to be $261k (46.5% below list).
- Recommended offer: $261k (46.5% below list) — sets the bar for 1% rule.
Location & tenants
- Location reads: area grade D — affects rentability + tenant quality, not the cash-flow math above.
- Snowline Joint Unified (rural): math 34% / reading 44% proficiency, ranked #722 of 1,400 in CA (top 52%) — families likely to look elsewhere, expect single-tenant / working-renter base with shorter leases.
- Market conditions: 164 active listings in the ZIP; 5,458 units permitted in San Bernardino County in 2024 (1,500 in 5+ unit buildings).
Forward outlook
- In year one you build about $52k of equity ($3k loan paydown + $49k appreciation (10.0% local appreciation)).
- San Bernardino County population projected at +15% by 2050 — modest demand growth; plan on rents tracking national, not racing it.
- By year 2, paydown + projected appreciation supports a ~$84k cash-out refi (75% LTV) — recoverable capital for the next deal without selling this one.
Negotiation context
- It's been on market 44 days — a 3% lower offer ($474k) is reasonable based on typical stale-listing flexibility.
- 5 sale attempts since 19y ago; this cycle's ask has dropped $26k (5%) from the opening price — seller is motivated, your offer sets the floor, not the list.
- Current owner paid $180k; list at $489k implies a 171% gain — meaningful room to come down on a strong offer.
Risks & watch-outs
- Climate carrying-cost: major wildfire risk; extreme-heat days projected 1→2/yr by 2055 (HVAC capex compounding) — expect insurance premiums to compound above CPI over the hold.
Questions for the listing agent
- What do current leases actually rent for vs. the listed asking? Can we see a recent rent roll and the last 12 months of T-12 income?
- It's been on market 44 days. Have you received any prior offers? Is the seller open to a 47% concession, seller financing, or rate buy-down credit?
- Is there a deadline driving the sale (1031 exchange, divorce, estate, relocation)? That informs how much negotiation room exists.
- The area grade is low — what's the realistic commute time and amenity access for the typical tenant pool here? Any planned neighborhood developments (good or bad) we should know about?
- What's the average days-on-market for RENTAL listings here right now (not sales)? A rising rental-DOM trend means longer vacancies and softer asking-rent achievability than the comps imply.
- What's the recent tenant-quality profile in this submarket — average credit score on applications, eviction rate, late-payment / NSF rate, and stable-employment percentage? A property-management company in the area should have these aggregated.
- How much new for-sale + rental construction is in the pipeline within 1–3 miles? Heavy new supply typically softens prices + rents 12–24 months out; constrained supply supports both.
Investment metrics
- 1% rule
- 0.53% ✗
- Cap rate
- 3.99%
- Cash-on-cash
- -8.21%
- DSCR
- 0.63
- GRM
- 15.6
CMA / ARV
- ARV (median comp)
- $531,801
- List price
- $489,000
- Delta
- -8.05%
- Verdict
- FAIR
- Comps
- 20 within 1.0 mi
Show comp detail 2 sales within ~0.75 mi
| Address | Dist | Beds/Ba | Sqft | Sold | Price | $/sf | Match |
|---|---|---|---|---|---|---|---|
| 11423 Desert Vw | 0.35mi | 4/3.0 | 2,468 (-7%) | 3mo | $540,000 | $219 | 66 |
| 11126 Arena Rd | 0.52mi | 4/2.0 | 2,371 (-11%) | 4mo | $520,000 | $219 | 55 |
Match score weights: distance 35% · size 25% · config 20% · recency 20%. Top-matched comps best support the ARV.
Projected returns pro-forma
10.0% appreciation · 3.0% rent growth · sell at horizon
- IRR
- 18.5%
- Equity multiple
- 2.51×
- Total profit
- $206,465
- Equity at exit
- $440,530
- IRR
- 17.2%
- Equity multiple
- 5.78×
- Total profit
- $654,545
- Equity at exit
- $950,019
Cash invested: $136,920 (down + closing). Projections, not guarantees.
Landlord ↔ Tenant lean methodology
- Overall (STATE)
- 18 Strongly Tenant-Friendly
- State California
- 18 Strongly Tenant-Friendly · D+13
- County
- — inherits STATE
- City
- — inherits STATE
ZIP-level market 92372
- Home prices YoY
- 14.8%
- Active inventory
- 164
- Price-to-rent
- 15.6×
Monthly cashflow live
- Estimated rent
- $2,615 medium interval (Pro) →
- Mortgage (P&I)
- −$2,564
- Tax from tax record
- −$234 /mo · $2,813/yr
- Insurance
- −$204
- HOA
- −$0
- Vacancy / Maint / Mgmt
- −$549
- Net cashflow
- $-937
Break-even live
UW: 25.0% down · 7.5% · 30yr · 1.5% tax · 5.0% vac · 8.0% maint · 8.0% mgmt
Financing live
Cash to close
- Down payment
- $122,250
- Closing costs
- $14,670
- Reserves months
- —
- Total cash needed
- —
Loan-product check · same deal, 3 products live
Conventional
25% down · 7.5% · 30yr
- Down + closing
- —
- Monthly P&I
- —
- Monthly cashflow
- —
- DSCR
- —
- Eligible?
- —
Personal DTI + credit; lowest rate.
DSCR
20% down · 8.5% · 30yr
- Down + closing
- —
- Monthly P&I
- —
- Monthly cashflow
- —
- DSCR
- —
- Eligible?
- —
No personal income docs; deal must DSCR.
Hard money
10% down · 12.0% · 12mo
- Down + closing
- —
- Monthly P&I
- —
- Monthly cashflow
- —
- DSCR
- —
- Eligible?
- —
Short-term bridge; refi at stabilization.
Listing history 24 events
-
2026-06-18days on market $489,000 Active 44 DOM
-
2026-06-17days on market $489,000 Active 43 DOM
-
2026-06-16days on market $489,000 Active 42 DOM
-
2026-06-15days on market $489,000 Active 41 DOM
-
2026-06-13pricedays on market $489,000 Active 39 DOM
-
2026-06-09days on market $515,000 Active 35 DOM
-
2026-06-08days on market $515,000 Active 34 DOM
-
2026-06-07days on market $515,000 Active 33 DOM
-
2026-06-04days on market $515,000 Active 30 DOM
-
2026-06-03days on market $515,000 Active 29 DOM
-
2026-06-02days on market $515,000 Active 28 DOM
-
2026-06-01days on market $515,000 Active 27 DOM
-
2026-05-31days on market $515,000 Active 26 DOM
-
2026-05-05$515,000 Active 1323-char remark
-
2026-03-19historical
-
2026-02-09$525,000 Active
-
2026-02-07price $525,000
-
2026-02-06$575,000 Active
-
2025-10-24$575,000 Active
-
2012-07-03soldstatus $180,500
-
2007-07-03historical
-
2007-04-02price $449,500
-
2007-03-14$469,500
-
2005-09-23soldstatus $95,000
ⓘ Source: listings_history table (triggers on properties + properties_extension) + one-shot
backfill from property_details.listing_events for pre-trigger history.
Tax reassessment forecast CA · Resets to sale price
- Current annual tax
- $2,813 · $234/mo
- Projected year-2 tax
- $3,716 · $310/mo
- Expected delta
- +$903/yr (+$75/mo · 32.1%)
ⓘ Screening estimate from a state-policy table — verify with the county assessor before closing.
Climate risk First Street
- Flood 1/10 Low FEMA zone D · 0% chance over 30 yrs
- Wildfire 7/10 Severe
- Heat 6/10 Major 1 d/yr ≥96°F today · 2 d/yr by 30 yrs out
- Wind 1/10 Low
- Air quality 9/10 Extreme 23 unhealthy d/yr today · 27 by 30 yrs out
Nearby sold comps map
Loading sold comps map…
Walkable amenities ~0.75 mi
Loading nearby amenities…
Taxation est. · year 1
- Rental income
- $31,378
- − Mortgage interest
- −$27,392
- − Property taxes
- −$2,813
- − Insurance
- −$2,445
- − Repairs & maintenance
- −$2,510
- − Management
- −$2,510
- − Depreciation
- −$14,225
- Taxable loss
- −$20,517
- Est. tax savings @ 24.0%
- +$4,924
- After-tax cash flow
- $-6,317/yr
For passive investors: Depreciation is non-cash, so a rental often shows a tax loss while cash-flowing — sheltering income. Rental losses are passive: they offset passive income freely, and up to $25,000/yr can offset ordinary (W-2) income if you actively participate and your MAGI is under $100k (phasing out to $0 by $150k); unused losses carry forward. On sale, claimed depreciation is recaptured at up to 25%, and gains may owe capital-gains tax (a 1031 exchange can defer both). Figures are a year-1 estimate at your 24.0% rate — not tax advice; consult a CPA.
Schools (NCES district)
- District
- Snowline Joint Unified
- NCES district ID
- 0636970
- Math proficiency
- 34% ▲ 1.00%
- Reading proficiency
- 44% ▬ 0.00%
- Median HH income
- $57,625
- Composite
- 36.84/100
- National rank
- #9157
- State rank
- #722 of 1400 in CA
Livability — Piñon Hills
No livability data for this city. (Only ~50 U.S. cities are tracked.)
Census & demographics
- Census place
- Piñon Hills, CA
- City population
- 4,854
- Population (ZIP)
- 4,854
Population outlook (San Bernardino County) Hauer SSP2
- Today (2025)
- 2,300,329 people
- By 2030
- 2,378,907 · +3.4%
- By 2040
- 2,523,137 · +9.7%
- By 2050
- 2,642,388 · +14.9%
- By 2075
- 2,880,769 · +25.2%
- By 2100
- 2,909,436 · +26.5%
Race, ethnicity, and origin ACS 2023
- Neighborhood character
- Diverse neighborhood (Simpson 0.58)
- Race & ethnicity
- White 53% Hispanic / Latino 37% Two or more races 14% Asian 6%
- Hispanic origin (detail)
- Mexican 23% Puerto Rican 1%
- Common ancestry
- Italian 4% Iranian 3% Lithuanian 2%
- Foreign-born
- 15% · Canada, South Korea
- Languages at home
- 79% English-only · Spanish 15% Korean 4% Tagalog/Filipino 1%
Political lean MEDSL · San Bernardino
- 2024 margin
- Toss-up / Even · D 47.5% · R 49.7% · Other 2.8%
- 2008→2024 swing
- -8.5pp toward R · 2008: 6.3pp · 2024: -2.1pp
- All cycles
- 2024: R+2.1 2020: D+10.7 2016: D+9.8 2012: D+5.4 2008: D+6.3
Not yet ingested
- Civics
- —
Market trends
- HPI YoY
- ▲ 49.25%
- Current HPI
- 383.0737
- Rent YoY
- —
- Metro
- —
- State GDP YoY
- ▲ 3.21%
- F500 in state
- 116
Industry mix (Fortune 500 HQ in CA)
| Industry | F500 HQs | Revenue |
|---|---|---|
| Technology | 27 | $1,492B |
|
||
| Financial Services | 3 | $174B |
|
||
| Retail | 3 | $44B |
|
||
| Insurance | 3 | $26B |
|
||
| Media / Entertainment | 2 | $115B |
|
||
| Pharmaceuticals / Biotech | 2 | $62B |
|
||
Price history
+414.7% since first listed12 events — show timeline
- 2026-06-13 Price Changed $489,000 CRMLS
- 2026-05-05 Listed $515,000 CRMLS
- 2026-03-19 Listing Removed — CRMLS
- 2026-02-09 Listed $525,000 CRMLS
- 2026-02-07 Price Changed $525,000 CRMLS
- 2026-02-06 Listed $575,000 CRMLS
- 2025-10-24 Listed $575,000 CRMLS
- 2012-07-03 Sold (MLS) $180,500 CRMLS
- 2007-07-03 Listing Removed — CRMLS
- 2007-04-02 Price Changed $449,500 CRMLS
- 2007-03-14 Listed $469,500 CRMLS
- 2005-09-23 Sold (Public Records) $95,000 Public Records
Property tax history
-2.0%/yrLatest (2025): $2,813 · +6.7% YoY. Source: county tax records.
Cash-flow waterfall
monthlySold comps — $/sqft
last 12 mo · ≤1 miLoading sold comps…