6004 Elliott Ct · Nolensville, TN
Flood risk No data
- FEMA flood zone
- —
- Chance of flooding over 30 yrs
- —
- Est. flood insurance / yr
- —
Fire risk No data
- Est. fire insurance / yr
- —
Heat risk No data
- Hot days now (above threshold)
- —
- Hot days in 30 yrs
- —
Wind risk No data
- Chance of severe wind over 30 yrs
- —
Air-quality risk No data
- Unhealthy air days now
- —
- Unhealthy air days in 30 yrs
- —
Risk factors via First Street. Map © Google.
Why this score? — see what drove the C grade
The composite is a weighted blend of 9 inputs, each scored 0–100. Each bar is that input's sub-score; the figure is the points it added to the 100-point composite (weight × sub-score).
- Cash flow +14.3/30.0
- ARV discount +13.9/15.0
- Appreciation +8.3/10.0
- Schools +5.5/10.0
- DSCR +4.4/10.0
- 1% rule +4.0/10.0
- Livability +4.0/5.0
- Rent growth +2.5/5.0
- Condition / age +1.0/5.0
$1,315,893
🖨 Deal sheet 📄 Offer letter ✓ Due diligence
Key facts
- 0.27 acre lot
- 3 garage spots
- Built 2026
Neighborhood map
What this means for you Summary
Snapshot
- This is a 6-bed/5.0-bath single-family listed at $1.32M. Condition is rated poor.
Deal economics
- At list price, monthly cash flow is $252 ($3k/yr) — positive.
- The deal already cash-flows at list — no discount required.
- To meet the 1% rule (rent ≥ 1% of price), the offer needs to be $1.19M (9.6% below list).
- Recommended offer: $1.19M (9.6% below list) — sets the bar for 1% rule.
- Cap rate 6.5% vs local median 2.2% in Nolensville — top-decile yield for the area; either an underpriced asset or a hidden risk that comps aren't pricing in. Stress-test before assuming the spread holds.
Location & tenants
- Location reads 79/100 on livability (#2 in TN, #2,317 nationally) — a middle-class / working-renter tenant base. Strengths: crime A+, employment A+, housing A+; Watch: amenities D+, commute F, cost of living F.
- Williamson County (rural): math 58% / reading 59% proficiency, ranked #1 of 139 in TN (top 1%) — acceptable for families but not a draw, mixed tenant base, ~2y average lease; only 9% free/reduced lunch — higher-income household profile.
- Zoned schools: Sunset Elementary School (math 62% / reading 57%, grade B-, #60 of 952 statewide, top 7%, 623 students, 0% FRL); Fred J Page High School (math 17% / reading 69%, grade F, #20 of 332 statewide, top 6%, 1,284 students, 0% FRL).
- Market conditions: 123 active listings in the ZIP; 1 comparable units currently listed for rent nearby; 1,994 units permitted in Williamson County in 2024 (637 in 5+ unit buildings).
Forward outlook
- In year one you build about $95k of equity ($9k loan paydown + $86k appreciation (6.5% local appreciation)).
- Williamson County population projected at +59% by 2050 — long-run rental-demand tailwind backs the buy-and-hold thesis.
- At projected returns (6.5% appreciation + 3.0% rent growth), your $368k cash investment doubles in ~4 years — after that, you're playing with house money.
- By year 2, paydown + projected appreciation supports a ~$152k cash-out refi (75% LTV) — recoverable capital for the next deal without selling this one.
Negotiation context
- Only 0 days on market — expect competitive offers; lowballing is unlikely to land.
Questions for the listing agent
- Have any recent inspections been done? Can we get a copy of the seller's disclosures and any deferred-maintenance estimates?
- What does the HOA fee cover, when was the last increase, and are there any pending special assessments or reserve-fund shortfalls?
- Is there a deadline driving the sale (1031 exchange, divorce, estate, relocation)? That informs how much negotiation room exists.
- Schools are A-rated — typically a magnet for longer-tenancy family renters. What's the average tenant stay here, and is there a school-zone premium baked into asking?
- What's the average days-on-market for RENTAL listings here right now (not sales)? A rising rental-DOM trend means longer vacancies and softer asking-rent achievability than the comps imply.
- What's the recent tenant-quality profile in this submarket — average credit score on applications, eviction rate, late-payment / NSF rate, and stable-employment percentage? A property-management company in the area should have these aggregated.
- How much new for-sale + rental construction is in the pipeline within 1–3 miles? Heavy new supply typically softens prices + rents 12–24 months out; constrained supply supports both.
Investment metrics
- 1% rule
- 0.90% ✗
- Cap rate
- 6.52%
- Cash-on-cash
- 0.82%
- DSCR
- 1.04
- GRM
- 9.2
CMA / ARV
- ARV (on-the-fly)
- $1,534,380
- Comps found
- 12
Show comp detail 12 sales within ~0.75 mi
| Address | Dist | Beds/Ba | Sqft | Sold | Price | $/sf | Match |
|---|---|---|---|---|---|---|---|
| 5155 High Park Hill Dr | 0.13mi | 5/5.5 (-1) | 4,706 (-2%) | 1mo | $1,560,325 | $332 | 84 |
| 5120 High Park Hill Dr | 0.02mi | 6/4.5 | 4,272 (-11%) | 1mo | $1,250,000 | $293 | 79 |
| 5151 High Park Hill Dr | 0.13mi | 5/5.5 (-1) | 4,960 (+4%) | 6mo | $1,533,550 | $309 | 76 |
| 6025 Elliott Ct | 0.18mi | 5/5.5 (-1) | 4,494 (-6%) | 1mo | $1,617,795 | $360 | 74 |
| 5809 Luke Ct | 0.23mi | 5/4.5 (-1) | 4,494 (-6%) | 5mo | $1,405,205 | $313 | 68 |
| 5159 High Park Hill Dr | 0.13mi | 5/6.0 (-1) | 4,325 (-10%) | 1mo | $1,350,000 | $312 | 68 |
| 5901 Luke Ct | 0.23mi | 5/5.5 (-1) | 4,460 (-7%) | 5mo | $1,610,062 | $361 | 67 |
| 5900 Luke Ct | 0.23mi | 5/5.0 (-1) | 4,321 (-10%) | 4mo | $1,351,309 | $313 | 65 |
| 6009 Elliott Ct | 0.25mi | 5/5.5 (-1) | 4,402 (-8%) | 5mo | $1,400,137 | $318 | 64 |
| 5912 Luke Ct | 0.10mi | 5/5.5 (-1) | 4,113 (-14%) | 2mo | $1,444,570 | $351 | 64 |
| 6013 Elliott Ct | 0.23mi | 5/5.5 (-1) | 4,266 (-11%) | 6mo | $1,476,520 | $346 | 60 |
| 5808B Bridget Ct | 0.31mi | 5/5.5 (-1) | 4,216 (-12%) | 14mo | $1,355,364 | $321 | 47 |
Match score weights: distance 35% · size 25% · config 20% · recency 20%. Top-matched comps best support the ARV.
Projected returns pro-forma
6.54% appreciation · 3.0% rent growth · sell at horizon
- IRR
- 17.3%
- Equity multiple
- 2.19×
- Total profit
- $439,018
- Equity at exit
- $872,774
- IRR
- 16.9%
- Equity multiple
- 4.44×
- Total profit
- $1,269,297
- Equity at exit
- $1,623,623
Cash invested: $368,450 (down + closing). Projections, not guarantees.
Landlord ↔ Tenant lean methodology
- Overall (STATE)
- 87 Strongly Landlord-Friendly
- State Tennessee
- 87 Strongly Landlord-Friendly · R+13
- County
- — inherits STATE
- City
- — inherits STATE
ZIP-level market 37014
- Home prices YoY
- 1.3%
- Active inventory
- 123
- Price-to-rent
- 9.2×
Monthly cashflow live
- Estimated rent
- $11,900 medium interval (Pro) →
- Mortgage (P&I)
- −$6,901
- Tax est. 1.5%
- −$1,645 /mo · $19,738/yr
- Insurance
- −$548
- HOA
- −$55
- Vacancy / Maint / Mgmt
- −$2,499
- Net cashflow
- $252
Break-even live
UW: 25.0% down · 7.5% · 30yr · 1.5% tax · 5.0% vac · 8.0% maint · 8.0% mgmt
Financing live
Cash to close
- Down payment
- $328,973
- Closing costs
- $39,477
- Reserves months
- —
- Total cash needed
- —
Loan-product check · same deal, 3 products live
Conventional
25% down · 7.5% · 30yr
- Down + closing
- —
- Monthly P&I
- —
- Monthly cashflow
- —
- DSCR
- —
- Eligible?
- —
Personal DTI + credit; lowest rate.
DSCR
20% down · 8.5% · 30yr
- Down + closing
- —
- Monthly P&I
- —
- Monthly cashflow
- —
- DSCR
- —
- Eligible?
- —
No personal income docs; deal must DSCR.
Hard money
10% down · 12.0% · 12mo
- Down + closing
- —
- Monthly P&I
- —
- Monthly cashflow
- —
- DSCR
- —
- Eligible?
- —
Short-term bridge; refi at stabilization.
Rent comps 1 comps
| Address | Beds | Baths | Sqft | Rent | $/sqft | DOM | Units | Dist |
|---|---|---|---|---|---|---|---|---|
| 6605 Goshawk Ct Arrington, TN | 5.0 | 5.5 | 5835 | $11,900 | $2.04 | 17d | 1 | 0.89mi |
HOA detail
- Monthly dues
- $55 · $660/yr
Listing history 2 events
-
2026-05-14$1,315,893
-
2026-05-14historical
ⓘ Source: listings_history table (triggers on properties + properties_extension) + one-shot
backfill from property_details.listing_events for pre-trigger history.
Nearby sold comps map
Loading sold comps map…
Walkable amenities ~0.75 mi
Loading nearby amenities…
Taxation est. · year 1
- Rental income
- $142,800
- − Mortgage interest
- −$73,710
- − Property taxes
- −$19,738
- − Insurance
- −$6,579
- − Repairs & maintenance
- −$11,424
- − Management
- −$11,424
- − HOA
- −$660
- − Depreciation
- −$38,281
- Taxable loss
- −$19,017
- Est. tax savings @ 24.0%
- +$4,564
- After-tax cash flow
- $7,590/yr
For passive investors: Depreciation is non-cash, so a rental often shows a tax loss while cash-flowing — sheltering income. Rental losses are passive: they offset passive income freely, and up to $25,000/yr can offset ordinary (W-2) income if you actively participate and your MAGI is under $100k (phasing out to $0 by $150k); unused losses carry forward. On sale, claimed depreciation is recaptured at up to 25%, and gains may owe capital-gains tax (a 1031 exchange can defer both). Figures are a year-1 estimate at your 24.0% rate — not tax advice; consult a CPA.
Condition & rehab AI · 4 photos
The property requires extensive renovations to bring it up to a livable condition. Significant repairs and updates are needed to the exterior, interior, HVAC, and landscaping to increase its resale and rental value.
Repairs flagged
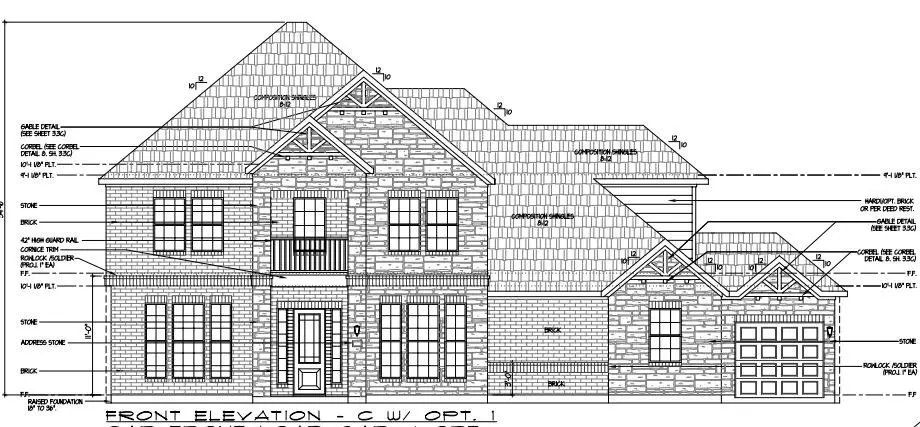
- Major exterior siding — Blueprints show a brick exterior, but the actual exterior is not visible in the photos.
- Major interior walls — Blueprints show interior wall designs, but the actual interior walls are not visible in the photos.
- Major HVAC/mechanicals — Blueprints show HVAC and mechanical systems, but the actual systems are not visible in the photos.
- Major landscaping — Blueprints show landscaping plans, but the actual landscaping is not visible in the photos.
Value-add opportunities
- Both exterior siding — Aesthetic improvement and increased curb appeal.
- Both interior walls — Improved interior aesthetics and increased living space.
- Both HVAC/mechanicals — Improved comfort and energy efficiency.
- Both landscaping — Increased curb appeal and property value.
Renovation cost estimate screening
| Repair item | Severity | Est. cost |
|---|---|---|
| exterior siding · Blueprints show a brick exterior, but the actual exterior is not visible in the photos. | Major | $15,000–50,000 |
| interior walls · Blueprints show interior wall designs, but the actual interior walls are not visible in the photos. | Major | $15,000–50,000 |
| HVAC/mechanicals · Blueprints show HVAC and mechanical systems, but the actual systems are not visible in the photos. | Major | $15,000–50,000 |
| landscaping · Blueprints show landscaping plans, but the actual landscaping is not visible in the photos. | Major | $15,000–50,000 |
| Total estimated repair cost · 4 items | $60,000–200,000 |
Value-add ROI direction
- Both exterior siding — Aesthetic improvement and increased curb appeal. ↑
- Both interior walls — Improved interior aesthetics and increased living space. ↑
- Both HVAC/mechanicals — Improved comfort and energy efficiency. ↑
- Both landscaping — Increased curb appeal and property value. ↑
ⓘ Cost ranges are severity-bucket heuristics (US national rule-of-thumb). Get contractor quotes + a written scope before underwriting a rehab budget.
Schools (NCES district)
- District
- Williamson County
- NCES district ID
- 4704530
- Math proficiency
- 58% ▼ -13.00%
- Reading proficiency
- 59% ▼ -8.00%
- Median HH income
- $103,392
- Composite
- 54.94/100
- National rank
- #1307
- State rank
- #1 of 139 in TN
Livability — Nolensville
- Score
- 79/100
- State rank
- #2
- US rank
- #2317
Category grades
Schools grade is shown separately in the Schools card above.
Census & demographics
- City population
- 24,409
- Population (ZIP)
- 3,633
Population outlook (Williamson County) Hauer SSP2
- Today (2025)
- 275,925 people
- By 2030
- 308,630 · +11.9%
- By 2040
- 374,403 · +35.7%
- By 2050
- 438,644 · +59.0%
- By 2075
- 592,763 · +114.8%
- By 2100
- 691,828 · +150.7%
Race, ethnicity, and origin ACS 2023
- Neighborhood character
- Predominantly White (83%)
- Race & ethnicity
- White 83% Hispanic / Latino 6% Black 6% Two or more races 3% Asian 3%
- Hispanic origin (detail)
- Mexican 4%
- Common ancestry
- Serbian 12% Slovak 1% English 1%
- Foreign-born
- 3% · Canada
- Languages at home
- 93% English-only · Spanish 5% Other Indo-European 2%
Political lean MEDSL · Williamson
- 2024 margin
- Solid R (+32.4) · D 33.0% · R 65.4% · Other 1.7%
- 2008→2024 swing
- +7.1pp toward D · 2008: -39.5pp · 2024: -32.4pp
- All cycles
- 2024: R+32.4 2020: R+26.1 2016: R+35.5 2012: R+46.8 2008: R+39.5
Not yet ingested
- Civics
- —
Market trends
- HPI YoY
- ▲ 6.54%
- Current HPI
- 498.4505
- Rent YoY
- —
- Metro
- —
- State GDP YoY
- ▲ 2.78%
- F500 in state
- 22
Industry mix (Fortune 500 HQ in TN)
| Industry | F500 HQs | Revenue |
|---|---|---|
| Healthcare | 3 | $91B |
|
||
| Retail | 3 | $72B |
|
||
| Transportation / Logistics | 1 | $88B |
|
||
| Paper / Packaging | 1 | $19B |
|
||
| Insurance | 1 | $13B |
|
||
| Energy | 1 | $12B |
|
||
Price history
2 events — show timeline
- 2026-05-14 Listed $1,315,893 REALTRACS as Distributed by MLS Grid
- 2026-05-14 Listing Removed — REALTRACS as Distributed by MLS Grid
Cash-flow waterfall
monthlySold comps — $/sqft
last 12 mo · ≤1 miLoading sold comps…