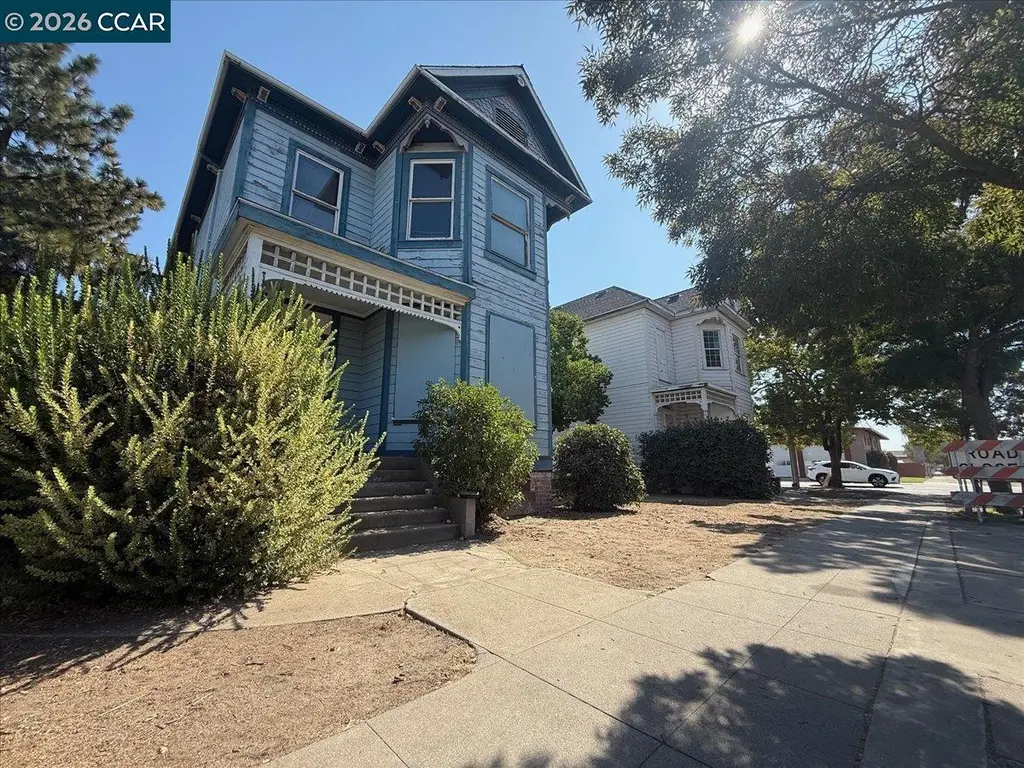
151 S 3rd Ave · Oakdale, CA
Flood risk No data
- FEMA flood zone
- —
- Chance of flooding over 30 yrs
- —
- Est. flood insurance / yr
- —
Fire risk No data
- Est. fire insurance / yr
- —
Heat risk No data
- Hot days now (above threshold)
- —
- Hot days in 30 yrs
- —
Wind risk No data
- Chance of severe wind over 30 yrs
- —
Air-quality risk No data
- Unhealthy air days now
- —
- Unhealthy air days in 30 yrs
- —
Risk factors via First Street. Map © Google.
Why this score? — see what drove the D- grade
The composite is a weighted blend of 9 inputs, each scored 0–100. Each bar is that input's sub-score; the figure is the points it added to the 100-point composite (weight × sub-score).
- ARV discount +15.0/15.0
- Cash flow +7.9/30.0
- Schools +3.2/10.0
- Livability +3.2/5.0
- Rent growth +2.5/5.0
- Condition / age +2.5/5.0
- DSCR +2.0/10.0
- 1% rule +1.6/10.0
- Appreciation +0.0/10.0
$300,000
🖨 Deal sheet (PDF) 📄 Offer letter ✓ Due diligence
Listing remarks
Own a piece of California’s Story. Don’t miss this rare opportunity to become the next steward of one of our community’s most treasured historic homes. Built in 1883, this beautiful Victorian embodies the heart and history of California. Every detail speaks of another time, from the handcrafted woodwork to the graceful proportions that have welcomed generations. This home is a living chapter in our shared story, waiting for someone to restore. Set on a prime lot with redevelopment possibilities, the home offers a chance to honor its historic roots while bringing new life and modern comforts to its timeless design. Whether preserved as a family residence, revitalized for co
Key facts
- Timeless design
- Handcrafted woodwork
- Architectural gem
Tags
Property features AI
Exterior
- Utilities: Public water; Public sewer
- Home design: Single family residence; Residential property; Built in 1883
- Construction: Wood siding; Shingle roof; Brick skirt (mobile home detail)
- Exterior features: Yard space; Level lot
Interior
- Flooring: Hardwood
- Interior features: Hardwood floors; Room types include other/unspecified
Neighborhood map
What this means for you Summary
Snapshot
- This is a 2-bed/2.0-bath other listed at $300k.
Deal economics
- At list price, monthly cash flow is $-314 ($-4k/yr) — negative.
- To cash-flow at today's rent, offer at most $245k (18.5% below list).
- To meet the 1% rule (rent ≥ 1% of price), the offer needs to be $197k (34.2% below list).
- Recommended offer: $197k (34.2% below list) — sets the bar for 1% rule.
- Cap rate 5.0% vs local median 2.7% in Oakdale — top-decile yield for the area; either an underpriced asset or a hidden risk that comps aren't pricing in. Stress-test before assuming the spread holds.
Location & tenants
- Location reads 64/100 on livability (#412 in CA) — a middle-class / working-renter tenant base. Strengths: housing A+, health & safety B; Watch: commute F, cost of living F.
- Oakdale Joint Unified (suburban): math 27% / reading 45% proficiency, ranked #256 of 517 in CA (top 50%) — families likely to look elsewhere, expect single-tenant / working-renter base with shorter leases.
- Zoned schools: Magnolia Elementary (math 21% / reading 35%, grade F, #905 of 1,571 statewide, top 58%, 615 students, 52% FRL); Oakdale Junior High (math 19% / reading 38%, grade F, #231 of 498 statewide, top 47%, 756 students, 40% FRL); Oakdale High (math 47% / reading 67%, grade C, #234 of 1,170 statewide, top 21%, 1,644 students, 34% FRL) — zoned schools at 42% FRL track the district average.
- Market conditions: 203 active listings in the ZIP; 1 comparable units currently listed for rent nearby; solid renter incomes; 923 units permitted in Stanislaus County in 2024 (63 in 5+ unit buildings).
Forward outlook
- Local home prices are declining (-3.0%/yr); year-one equity from $2k of loan paydown is wiped out by about $9k of value loss. Plan a longer hold.
- Stanislaus County population projected at +14% by 2050 — modest demand growth; plan on rents tracking national, not racing it.
Negotiation context
- It's been on market 41 days — a 3% lower offer ($291k) is reasonable based on typical stale-listing flexibility.
- Current owner paid $260k; 15% above their basis — modest negotiation headroom, anchor on the comps not their cost.
Risks & watch-outs
- Watch-outs: built in 1883 — expect roof / HVAC / electrical / plumbing capex.
Questions for the listing agent
- What do current leases actually rent for vs. the listed asking? Can we see a recent rent roll and the last 12 months of T-12 income?
- It's been on market 41 days. Have you received any prior offers? Is the seller open to a 34% concession, seller financing, or rate buy-down credit?
- Built in 1883 — when were the roof, HVAC, electrical panel, plumbing, and water heater last replaced?
- Is there a deadline driving the sale (1031 exchange, divorce, estate, relocation)? That informs how much negotiation room exists.
- The area grade is low — what's the realistic commute time and amenity access for the typical tenant pool here? Any planned neighborhood developments (good or bad) we should know about?
- What's the average days-on-market for RENTAL listings here right now (not sales)? A rising rental-DOM trend means longer vacancies and softer asking-rent achievability than the comps imply.
- What's the recent tenant-quality profile in this submarket — average credit score on applications, eviction rate, late-payment / NSF rate, and stable-employment percentage? A property-management company in the area should have these aggregated.
- How much new for-sale + rental construction is in the pipeline within 1–3 miles? Heavy new supply typically softens prices + rents 12–24 months out; constrained supply supports both.
Investment metrics
- 1% rule
- 0.66% ✗
- Cap rate
- 5.04%
- Cash-on-cash
- -4.48%
- DSCR
- 0.80
- GRM
- 12.7
CMA / ARV
- ARV (median comp)
- $447,500
- List price
- $300,000
- Delta
- -32.96%
- Verdict
- UNDERPRICED
- Comps
- 20 within 1.0 mi
Projected returns pro-forma
-3.0% appreciation · 3.0% rent growth · sell at horizon
- IRR
- -23.9%
- Equity multiple
- 0.18×
- Total profit
- $-68,690
- Equity at exit
- $44,731
- IRR
- -19.2%
- Equity multiple
- -0.02×
- Total profit
- $-85,924
- Equity at exit
- $25,939
Cash invested: $84,000 (down + closing). Projections, not guarantees.
Landlord ↔ Tenant lean methodology
- Overall (STATE)
- 18 Strongly Tenant-Friendly
- State California
- 18 Strongly Tenant-Friendly · D+13
- County
- — inherits STATE
- City
- — inherits STATE
ZIP-level market 95361
- Active inventory
- 203
- Price-to-rent
- 12.7×
Monthly cashflow live
- Estimated rent
- $1,974 medium interval (Pro) →
- Mortgage (P&I)
- −$1,573
- Tax from tax record
- −$175 /mo · $2,101/yr
- Insurance
- −$125
- HOA
- −$0
- Vacancy / Maint / Mgmt
- −$415
- Net cashflow
- $-314
Break-even live
Sensitivity live
| Price | -10% $-144 | -5% $-229 | +0% $-314 | +5% $-399 | +10% $-484 |
|---|---|---|---|---|---|
| Rent | -10% $-470 | -5% $-392 | +0% $-314 | +5% $-236 | +10% $-158 |
| Rate | -1.0pp $-163 | -0.5pp $-237 | base $-314 | +0.5pp $-392 | +1.0pp $-471 |
UW: 25.0% down · 7.5% · 30yr · 1.5% tax · 5.0% vac · 8.0% maint · 8.0% mgmt
Financing live
Cash to close
- Down payment
- $75,000
- Closing costs
- $9,000
- Reserves months
- —
- Total cash needed
- —
Loan-product check · same deal, 3 products live
Conventional
25% down · 7.5% · 30yr
- Down + closing
- —
- Monthly P&I
- —
- Monthly cashflow
- —
- DSCR
- —
- Eligible?
- —
Personal DTI + credit; lowest rate.
DSCR
20% down · 8.5% · 30yr
- Down + closing
- —
- Monthly P&I
- —
- Monthly cashflow
- —
- DSCR
- —
- Eligible?
- —
No personal income docs; deal must DSCR.
Hard money
10% down · 12.0% · 12mo
- Down + closing
- —
- Monthly P&I
- —
- Monthly cashflow
- —
- DSCR
- —
- Eligible?
- —
Short-term bridge; refi at stabilization.
Rent comps 1 comps
| Address | Beds | Baths | Sqft | Rent | $/sqft | DOM | Units | Dist |
|---|---|---|---|---|---|---|---|---|
| 30 Willowood Dr Oakdale, CA | 1.0–3.0 | 2.0 | 1331 | $2,314 | $1.74 | 15d | 3 | 1.43mi |
Listing history 21 events
-
2026-06-21days on market $300,000 Active 41 DOM
-
2026-06-18days on market $300,000 Active 38 DOM
-
2026-06-17days on market $300,000 Active 37 DOM
-
2026-06-16days on market $300,000 Active 36 DOM
-
2026-06-15days on market $300,000 Active 35 DOM
-
2026-06-14days on market $300,000 Active 33 DOM
-
2026-06-13days on market $300,000 Active 32 DOM
-
2026-06-10days on market $300,000 Active 30 DOM
-
2026-06-09days on market $300,000 Active 29 DOM
-
2026-06-08days on market $300,000 Active 28 DOM
-
2026-06-07days on market $300,000 Active 27 DOM
-
2026-06-05days on market $300,000 Active 24 DOM
-
2026-06-03days on market $300,000 Active 23 DOM
-
2026-06-02days on market $300,000 Active 22 DOM
-
2026-06-01days on market $300,000 Active 21 DOM
-
2026-05-31days on market $300,000 Active 20 DOM
-
2026-05-30days on market $300,000 Active 19 DOM
-
2026-05-11$300,000 Active 1003-char remark
-
2002-11-27soldstatus $260,000
-
1999-07-09soldstatus $70,000
-
1999-07-09soldstatus $70,000
ⓘ Source: listings_history table (triggers on properties + properties_extension) + one-shot
backfill from property_details.listing_events for pre-trigger history.
Tax reassessment forecast CA · Resets to sale price
- Current annual tax
- $2,101 · $175/mo
- Projected year-2 tax
- $2,280 · $190/mo
- Expected delta
- +$179/yr (+$15/mo · 8.5%)
ⓘ Screening estimate from a state-policy table — verify with the county assessor before closing.
Nearby sold comps map
Loading sold comps map…
Walkable amenities ~0.75 mi
Loading nearby amenities…
Taxation est. · year 1
- Rental income
- $23,690
- − Mortgage interest
- −$16,805
- − Property taxes
- −$2,101
- − Insurance
- −$1,500
- − Repairs & maintenance
- −$1,895
- − Management
- −$1,895
- − Depreciation
- −$8,727
- Taxable loss
- −$9,234
- Est. tax savings @ 24.0%
- +$2,216
- After-tax cash flow
- $-1,549/yr
For passive investors: Depreciation is non-cash, so a rental often shows a tax loss while cash-flowing — sheltering income. Rental losses are passive: they offset passive income freely, and up to $25,000/yr can offset ordinary (W-2) income if you actively participate and your MAGI is under $100k (phasing out to $0 by $150k); unused losses carry forward. On sale, claimed depreciation is recaptured at up to 25%, and gains may owe capital-gains tax (a 1031 exchange can defer both). Figures are a year-1 estimate at your 24.0% rate — not tax advice; consult a CPA.
Schools (NCES district)
- District
- Oakdale Joint Unified
- NCES district ID
- 0600062
- Math proficiency
- 27% ▼ -13.00%
- Reading proficiency
- 45% ▼ -7.00%
- Median HH income
- $60,377
- Composite
- 32.1/100
- National rank
- #5805
- State rank
- #256 of 517 in CA
Livability — Oakdale
- Score
- 64/100
- State rank
- #412
- US rank
- #14042
Category grades
Schools grade is shown separately in the Schools card above.
Census & demographics
- Census place
- Oakdale, CA
- County
- Stanislaus County · 445,786 people
- City population
- 34,810
- Metro
- Modesto, CA
- Population (ZIP)
- 34,810
- Household income
- $92,963
- Rent vs Own
- Severe rent burden
- 1276.0
Population outlook (Stanislaus County) Hauer SSP2
- Today (2025)
- 579,493 people
- By 2030
- 598,000 · +3.2%
- By 2040
- 630,930 · +8.9%
- By 2050
- 658,300 · +13.6%
- By 2075
- 712,363 · +22.9%
- By 2100
- 719,805 · +24.2%
Race, ethnicity, and origin ACS 2023
- Neighborhood character
- Majority White (61%)
- Race & ethnicity
- White 61% Hispanic / Latino 30% Two or more races 18% Asian 2%
- Hispanic origin (detail)
- Mexican 25%
- Common ancestry
- Russian 5% Italian 4% Iranian 2%
- Foreign-born
- 11% · Canada, China
- Languages at home
- 80% English-only · Spanish 18% German/W. Germanic 1% Other Indo-European 1%
Political lean MEDSL · Stanislaus
- 2024 margin
- R (+11.0) · D 43.2% · R 54.2% · Other 2.6%
- 2008→2024 swing
- -12.7pp toward R · 2008: 1.7pp · 2024: -11.0pp
- All cycles
- 2024: R+11.0 2020: D+0.8 2016: D+0.6 2012: D+0.7 2008: D+1.7
Not yet ingested
- Civics
- —
Market trends
- HPI YoY
- ▼ -507.52%
- Current HPI
- 283.0924
- Rent YoY
- —
- Metro
- Modesto, CA
- State GDP YoY
- ▲ 3.21%
- F500 in state
- 116
Industry mix (Fortune 500 HQ in CA)
| Industry | F500 HQs | Revenue |
|---|---|---|
| Technology | 27 | $1,492B |
|
||
| Financial Services | 3 | $174B |
|
||
| Retail | 3 | $44B |
|
||
| Insurance | 3 | $26B |
|
||
| Media / Entertainment | 2 | $115B |
|
||
| Pharmaceuticals / Biotech | 2 | $62B |
|
||
Price history
+328.6% since first listed4 events — show timeline
- 2026-05-11 Listed $300,000 bridgeMLS, Bay East AOR, or Contra Costa AOR
- 2002-11-27 Sold (Public Records) $260,000 Public Records
- 1999-07-09 Sold (Public Records) $70,000 Public Records
- 1999-07-09 Sold (Public Records) $70,000 Public Records
Property tax history
+2.1%/yrLatest (2025): $2,101 · +5.5% YoY. Source: county tax records.
Cash-flow waterfall
monthlySold comps — $/sqft
last 12 mo · ≤1 miLoading sold comps…