 Duplex
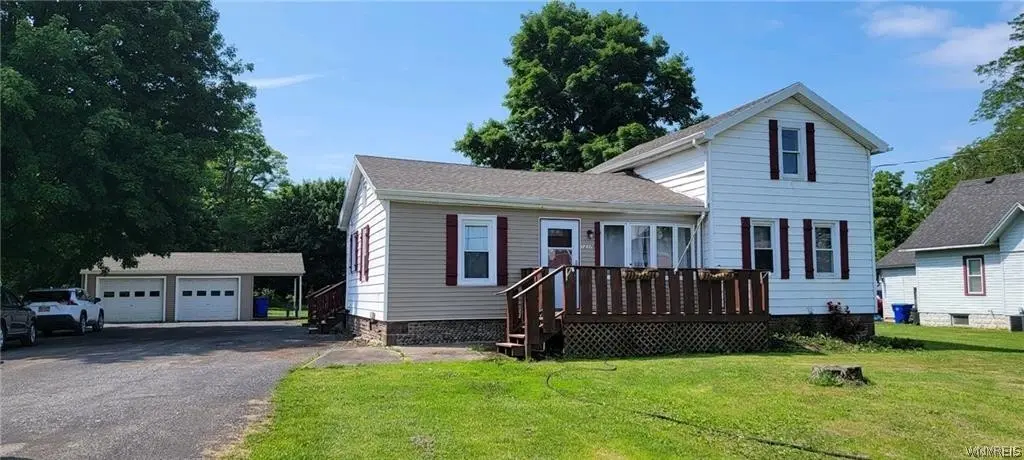
12376 Maple Ridge Rd · Medina, NY
Flood risk 1/10 · Minimal
- FEMA flood zone
- X
- Chance of flooding over 30 yrs
- 0.0%
- Est. flood insurance / yr
- $473 – $860
Fire risk 3/10 · Minor
- Est. fire insurance / yr
- $691 – $1,283
Heat risk 2/10 · Minimal
- Hot days now (above 94°F)
- 7 days/yr
- Hot days in 30 yrs
- 15 days/yr
Wind risk 1/10 · Minimal
- Chance of severe wind over 30 yrs
- —
Air-quality risk 2/10 · Minimal
- Unhealthy air days now
- 1 days/yr
- Unhealthy air days in 30 yrs
- 2 days/yr
Risk factors via First Street. Map © Google.
Why this score? — see what drove the B grade
The composite is a weighted blend of 9 inputs, each scored 0–100. Each bar is that input's sub-score; the figure is the points it added to the 100-point composite (weight × sub-score).
- Cash flow +28.0/30.0
- DSCR +9.9/10.0
- 1% rule +9.0/10.0
- ARV discount +7.5/15.0
- Appreciation +4.9/10.0
- Livability +3.6/5.0
- Schools +3.2/10.0
- Rent growth +2.5/5.0
- Condition / age +2.5/5.0
$216,900
🖨 Deal sheet 📄 Offer letter ✓ Due diligence
Multi-family units
County records classify this as Multi-Family (2-4 Unit). Listing-text estimate: 2 units. confirmed
Listing remarks
WELCOME HOME! Looking to own your own property while having rental income help pay your mortgage? Look no further! This charming 2-unit country home offers versatility and space: Apartment A features 3 bedrooms (including a convenient first-floor bedroom), 2.5 bathrooms, and an oversized living room—perfect for comfortable living and entertaining. Apartment B offers 2 bedrooms and its own private entrance with a separate back deck. Enjoy the outdoors with a large backyard overlooking Oak Orchard Creek, providing a peaceful, scenic setting. The property also includes a 2-car detached garage and a covered patio, ideal for relaxing or hosting gatherings. A fantastic opportunity for ow
Key facts
- 1.1 acre lot
- 2 garage spots
- Built 1880
Neighborhood map
What this means for you Summary
Snapshot
- This is a 1×3.0bd/2.5ba + 1×2.0bd/1.0ba units multifamily listed at $217k.
Deal economics
- At list price, monthly cash flow is $676 ($8k/yr) — positive. Per door: $338/mo.
- The deal already cash-flows at list — no discount required.
- Meets the 1% rule at list price ($3k rent vs $217k).
- Cap rate 10.0% vs local median 4.8% in Medina — top-decile yield for the area; either an underpriced asset or a hidden risk that comps aren't pricing in. Stress-test before assuming the spread holds.
Location & tenants
- Location reads 72/100 on livability (#344 in NY) — a middle-class / working-renter tenant base. Strengths: cost of living A+, housing A+, health & safety A+; Watch: crime D-, amenities F, commute F.
- Medina Central School District (town): math 37% / reading 38% proficiency, ranked #548 of 590 in NY (top 93%) — families likely to look elsewhere, expect single-tenant / working-renter base with shorter leases.
- Market conditions: 57 active listings in the ZIP; 28 units permitted in Orleans County in 2024 (0 in 5+ unit buildings).
Forward outlook
- In year one you build about $927 of equity ($2k loan paydown + $-573 appreciation (-0.3% local appreciation)).
- Orleans County population projected at -20% by 2050 — secular population decline; favor cash flow + early exit over multi-decade hold.
- At projected returns (-0.3% appreciation + 3.0% rent growth), your $61k cash investment doubles in ~6 years — after that, you're playing with house money.
Negotiation context
- Only 8 days on market — expect competitive offers; lowballing is unlikely to land.
- 2 sale attempts since 4y ago with the ask held roughly flat each time — persistent listings suggest the price (not the market) is what's stuck; bring a comps-based counter.
- Current owner paid $75k; list at $217k implies a 189% gain — meaningful room to come down on a strong offer.
Risks & watch-outs
- Watch-outs: property tax is 2.7% of price; built in 1880 — expect roof / HVAC / electrical / plumbing capex.
Questions for the listing agent
- Can we see the unit-by-unit rent roll, current vacancy, and any below-market leases? What's the average tenancy length?
- What capital expenditures (roof, boiler, parking lot, exteriors) have been made in the last 5 years, and what's planned in the next 2?
- Built in 1880 — when were the roof, HVAC, electrical panel, plumbing, and water heater last replaced?
- Property tax is high relative to price — has the assessment been appealed recently, and will the sale trigger a re-assessment?
- Is there a deadline driving the sale (1031 exchange, divorce, estate, relocation)? That informs how much negotiation room exists.
- Crime grade is D in this area — have there been break-ins, vandalism, or insurance claims at this property in the last 3 years? What carrier currently insures it and at what premium?
- What's the average days-on-market for RENTAL listings here right now (not sales)? A rising rental-DOM trend means longer vacancies and softer asking-rent achievability than the comps imply.
- What's the recent tenant-quality profile in this submarket — average credit score on applications, eviction rate, late-payment / NSF rate, and stable-employment percentage? A property-management company in the area should have these aggregated.
- How much new apartment / multifamily construction is in the pipeline within 1–3 miles? Heavy new supply (>2% of stock underway) typically softens rents 12–24 months out; light construction supports rent growth.
Investment metrics
- 1% rule
- 1.40% ✓
- Cap rate
- 10.03%
- Cash-on-cash
- 13.35%
- DSCR
- 1.59
- GRM
- 6.0
CMA / ARV
No comps found within radius.
Projected returns pro-forma
-0.26% appreciation · 3.0% rent growth · sell at horizon
- IRR
- 11.9%
- Equity multiple
- 1.56×
- Total profit
- $34,199
- Equity at exit
- $60,132
- IRR
- 17.1%
- Equity multiple
- 2.83×
- Total profit
- $111,402
- Equity at exit
- $70,046
Cash invested: $60,732 (down + closing). Projections, not guarantees.
Landlord ↔ Tenant lean methodology
- Overall (STATE)
- 15 Strongly Tenant-Friendly
- State New York
- 15 Strongly Tenant-Friendly · D+10
- County
- — inherits STATE
- City
- — inherits STATE
ZIP-level market 14103
- Home prices YoY
- -0.1%
- Active inventory
- 57
- Price-to-rent
- 11.4×
Monthly cashflow live
- Estimated rent
- $3,030 medium interval (Pro) →
- Mortgage (P&I)
- −$1,137
- Tax from tax record
- −$490 /mo · $5,881/yr
- Insurance
- −$90
- HOA
- −$0
- Vacancy / Maint / Mgmt
- −$636
- Net cashflow
- $676
Break-even live
2-unit breakdown (identical units grouped — click to expand)
| Units | Beds | Baths | Est. rent |
|---|---|---|---|
| 1× unit | 3.0 | 2.5 | $1,585 |
| 1× unit | 2.0 | 1 | $1,445 |
| Total (2 units) | $3,030 | ||
UW: 25.0% down · 7.5% · 30yr · 1.5% tax · 5.0% vac · 8.0% maint · 8.0% mgmt
Financing live
Cash to close
- Down payment
- $54,225
- Closing costs
- $6,507
- Reserves months
- —
- Total cash needed
- —
Loan-product check · same deal, 3 products live
Conventional
25% down · 7.5% · 30yr
- Down + closing
- —
- Monthly P&I
- —
- Monthly cashflow
- —
- DSCR
- —
- Eligible?
- —
Personal DTI + credit; lowest rate.
DSCR
20% down · 8.5% · 30yr
- Down + closing
- —
- Monthly P&I
- —
- Monthly cashflow
- —
- DSCR
- —
- Eligible?
- —
No personal income docs; deal must DSCR.
Hard money
10% down · 12.0% · 12mo
- Down + closing
- —
- Monthly P&I
- —
- Monthly cashflow
- —
- DSCR
- —
- Eligible?
- —
Short-term bridge; refi at stabilization.
Listing history 7 events
-
2026-04-03status Pending
-
2026-03-26$216,900 Active
-
2022-07-31historical
-
2022-07-24price $189,000
-
2022-06-24$191,000 Active
-
2003-01-15soldstatus $75,000
-
1997-05-02soldstatus $85,000
ⓘ Source: listings_history table (triggers on properties + properties_extension) + one-shot
backfill from property_details.listing_events for pre-trigger history.
Tax reassessment forecast NY · Partial reset (capped growth)
- Current annual tax
- $5,881 · $490/mo
- Projected year-2 tax
- $5,881 · $490/mo
- Expected delta
- $0/yr ($0/mo · 0.0%)
ⓘ Screening estimate from a state-policy table — verify with the county assessor before closing.
Climate risk First Street
- Flood 1/10 Low FEMA zone X · 0% chance over 30 yrs
- Wildfire 3/10 Moderate
- Heat 2/10 Low 7 d/yr ≥94°F today · 15 d/yr by 30 yrs out
- Wind 1/10 Low
- Air quality 2/10 Low 1 unhealthy d/yr today · 2 by 30 yrs out
Nearby sold comps map
Loading sold comps map…
Walkable amenities ~0.75 mi
Loading nearby amenities…
Taxation est. · year 1
- Rental income
- $36,360
- − Mortgage interest
- −$12,150
- − Property taxes
- −$5,881
- − Insurance
- −$1,084
- − Repairs & maintenance
- −$2,909
- − Management
- −$2,909
- − Depreciation
- −$6,310
- Taxable income
- $5,117
- Est. tax owed @ 24.0%
- −$1,228
- After-tax cash flow
- $6,881/yr
For passive investors: Depreciation is non-cash, so a rental often shows a tax loss while cash-flowing — sheltering income. Rental losses are passive: they offset passive income freely, and up to $25,000/yr can offset ordinary (W-2) income if you actively participate and your MAGI is under $100k (phasing out to $0 by $150k); unused losses carry forward. On sale, claimed depreciation is recaptured at up to 25%, and gains may owe capital-gains tax (a 1031 exchange can defer both). Figures are a year-1 estimate at your 24.0% rate — not tax advice; consult a CPA.
Schools (NCES district)
- District
- Medina Central School District
- NCES district ID
- 3618960
- Math proficiency
- 37% ▼ -12.00%
- Reading proficiency
- 38% ▼ -6.00%
- Median HH income
- $43,046
- Composite
- 31.76/100
- National rank
- #5901
- State rank
- #548 of 590 in NY
Livability — Medina
- Score
- 72/100
- State rank
- #344
- US rank
- #5814
Category grades
Schools grade is shown separately in the Schools card above.
Census & demographics
- City population
- 10,836
- Population (ZIP)
- 10,836
Population outlook (Orleans County) Hauer SSP2
- Today (2025)
- 39,123 people
- By 2030
- 37,648 · -3.8%
- By 2040
- 34,432 · -12.0%
- By 2050
- 31,487 · -19.5%
- By 2075
- 26,544 · -32.2%
- By 2100
- 22,251 · -43.1%
Race, ethnicity, and origin ACS 2023
- Neighborhood character
- Predominantly White (83%)
- Race & ethnicity
- White 83% Hispanic / Latino 6% Two or more races 5% Black 4% Asian 2%
- Hispanic origin (detail)
- Mexican 4%
- Common ancestry
- Romanian 9% Slovak 2% Lithuanian 1%
- Foreign-born
- 4% · Canada, China
- Languages at home
- 89% English-only · Spanish 5% German/W. Germanic 3% Chinese 1%
Political lean MEDSL · Orleans
- 2024 margin
- Solid R (+40.5) · D 29.8% · R 70.2%
- 2008→2024 swing
- -21.8pp toward R · 2008: -18.7pp · 2024: -40.5pp
- All cycles
- 2024: R+40.5 2020: R+36.0 2016: R+43.4 2012: R+19.4 2008: R+18.7
Not yet ingested
- Civics
- —
Market trends
- HPI YoY
- ▼ -0.26%
- Current HPI
- 307.0342
- Rent YoY
- —
- Metro
- —
- State GDP YoY
- ▲ 2.60%
- F500 in state
- 92
Industry mix (Fortune 500 HQ in NY)
| Industry | F500 HQs | Revenue |
|---|---|---|
| Financial Services | 10 | $950B |
|
||
| Consumer Goods | 9 | $162B |
|
||
| Insurance | 4 | $225B |
|
||
| Telecommunications | 2 | $144B |
|
||
| Pharmaceuticals | 2 | $112B |
|
||
| Media / Entertainment | 2 | $69B |
|
||
Price history
+155.2% since first listed7 events — show timeline
- 2026-04-03 Pending — WNYREIS
- 2026-03-26 Listed $216,900 WNYREIS
- 2022-07-31 Listing Removed — WNYREIS
- 2022-07-24 Price Changed $189,000 WNYREIS
- 2022-06-24 Listed $191,000 WNYREIS
- 2003-01-15 Sold (Public Records) $75,000 Public Records
- 1997-05-02 Sold (Public Records) $85,000 Public Records
Property tax history
+7.0%/yrLatest (2025): $5,881 · +3.2% YoY. Source: county tax records.
Cash-flow waterfall
monthlySold comps — $/sqft
last 12 mo · ≤1 miLoading sold comps…