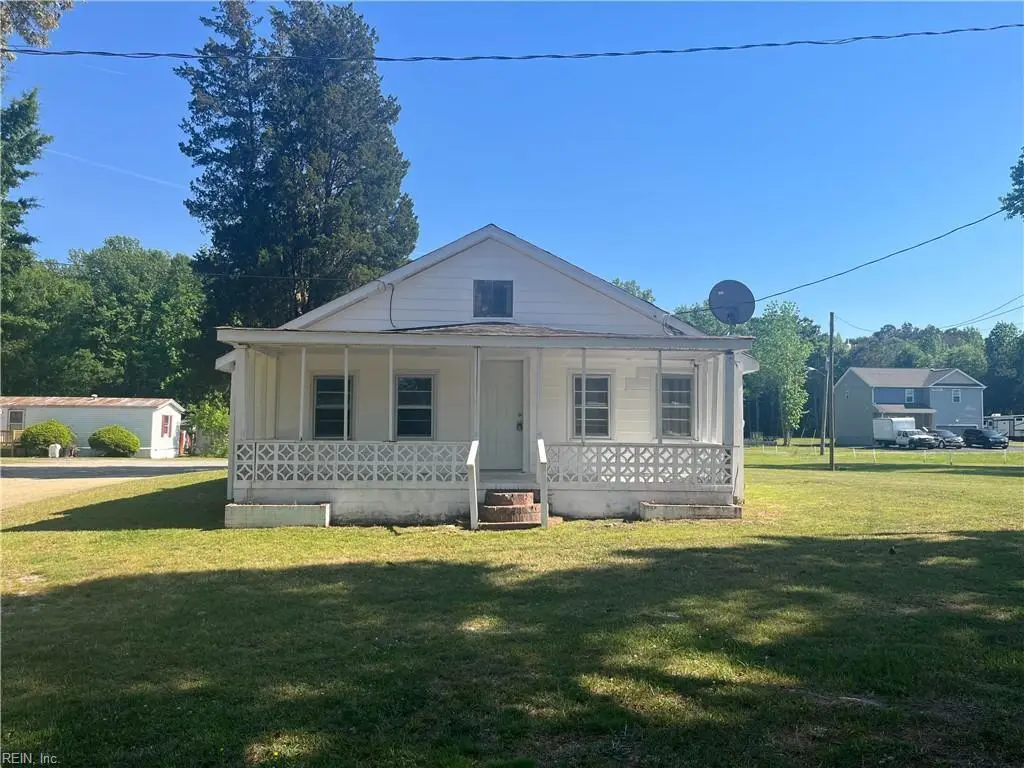
14016 Burwells Bay Rd · Rushmere, VA
Flood risk 1/10 · Minimal
- FEMA flood zone
- X (unshaded)
- Chance of flooding over 30 yrs
- 0.0%
- Est. flood insurance / yr
- $507 – $1,088
Fire risk 3/10 · Minor
- Est. fire insurance / yr
- $666 – $1,236
Heat risk 8/10 · Major
- Hot days now (above 107°F)
- 7 days/yr
- Hot days in 30 yrs
- 16 days/yr
Wind risk 7/10 · Major
- Chance of severe wind over 30 yrs
- 78.0%
Air-quality risk 1/10 · Minimal
- Unhealthy air days now
- 0 days/yr
- Unhealthy air days in 30 yrs
- 0 days/yr
Risk factors via First Street. Map © Google.
Why this score? — see what drove the B- grade
The composite is a weighted blend of 9 inputs, each scored 0–100. Each bar is that input's sub-score; the figure is the points it added to the 100-point composite (weight × sub-score).
- Cash flow +25.1/30.0
- ARV discount +15.0/15.0
- DSCR +8.2/10.0
- Schools +5.9/10.0
- 1% rule +5.6/10.0
- Livability +3.0/5.0
- Rent growth +2.5/5.0
- Condition / age +2.5/5.0
- Appreciation +0.0/10.0
$155,000
🖨 Deal sheet 📄 Offer letter ✓ Due diligence
Listing remarks
This single-level fixer-upper is a rare find, situated on 1.2 acres of potential just six minutes from the beach and less than ten minutes from the heart of Smithfield’s Historic District. Ready for a fresh vision, this property offers a large lot with the flexibility to renovate and expand in a truly incredible location. The home is sold as-is and where-is with no repairs by the seller, representing a unique opportunity to own a lot of this size and make it your own.
Key facts
- 1.21 acre lot
- Garage
- Built 1944
Property features AI
Finance
- Other: Property listed as fixer upper; Approximately 1.21 acres
- HOA & community: No HOA fees
Exterior
- Parking: Detached 1-car garage (576 sq ft)
- Utilities: Well water; Septic sewer; Electric water heater
- Home design: Detached single-family home; Traditional style; One story; One living level; Crawl foundation; Simple ownership
- Construction: Vinyl exterior siding; Asphalt shingle roof; Crawl foundation
- Exterior features: Deck; Patio; Vinyl siding; Asphalt shingle roof
Interior
- Kitchen: Electric range; Refrigerator
- Bedrooms: First-floor master bedroom; Bedroom and full bathroom on first floor
- Flooring: Vinyl; Wood
- Bathrooms: 1 full bathroom
- Heating & cooling: Baseboard heating; Electric heating; Hot water heating; Window/wall air conditioning
- Interior features: Ceiling fan; Satellite dish; Screened porch; Sun room; Utility closet
- Laundry & utility: Washer hookup; Dryer
Neighborhood map
What this means for you Summary
Snapshot
- This is a 3-bed/1.0-bath single-family listed at $155k.
Deal economics
- At list price, monthly cash flow is $344 ($4k/yr) — positive.
- The deal already cash-flows at list — no discount required.
- Meets the 1% rule at list price ($2k rent vs $155k).
- Recommended offer: $150k (3.0% below list) — sets the bar for market timing.
Location & tenants
- Location reads 60/100 on livability (#442 in VA) — a middle-class / working-renter tenant base. Strengths: crime A+, housing A+, employment B+; Watch: amenities F, commute F, health & safety F.
- Isle Of Wight County Public School District (rural): math 62% / reading 73% proficiency, ranked #28 of 131 in VA (top 21%) — acceptable for families but not a draw, mixed tenant base, ~2y average lease.
- Zoned schools: Hardy Elementary (math 67% / reading 67%, grade B+, #381 of 1,108 statewide, top 36%, 526 students, 49% FRL); Smithfield High (math 66% / reading 80%, grade B+, #129 of 319 statewide, top 41%, 1,347 students, 33% FRL).
- Market conditions: 207 active listings in the ZIP; 1 comparable units currently listed for rent nearby; 257 units permitted in Isle of Wight County in 2024 (0 in 5+ unit buildings).
Forward outlook
- Local home prices are declining (-3.0%/yr); year-one equity from $1k of loan paydown is wiped out by about $5k of value loss. Plan a longer hold.
- Isle of Wight County population projected at +10% by 2050 — modest demand growth; plan on rents tracking national, not racing it.
Negotiation context
- It's been on market 44 days — a 3% lower offer ($150k) is reasonable based on typical stale-listing flexibility.
- 3 sale attempts with the ask held roughly flat each time — persistent listings suggest the price (not the market) is what's stuck; bring a comps-based counter.
Risks & watch-outs
- Watch-outs: built in 1944 — expect roof / HVAC / electrical / plumbing capex.
- Climate carrying-cost: major wind risk, 78% chance of damaging wind over 30y; extreme-heat days projected 7→16/yr by 2055 (HVAC capex compounding) — expect insurance premiums to compound above CPI over the hold.
Questions for the listing agent
- It's been on market 44 days. Have you received any prior offers? Is the seller open to a 3% concession, seller financing, or rate buy-down credit?
- Built in 1944 — when were the roof, HVAC, electrical panel, plumbing, and water heater last replaced?
- Is there a deadline driving the sale (1031 exchange, divorce, estate, relocation)? That informs how much negotiation room exists.
- Schools are F-rated, which usually means shorter tenancies and higher turnover. Who's the typical renter profile here, and what's been the actual vacancy rate?
- What's the average days-on-market for RENTAL listings here right now (not sales)? A rising rental-DOM trend means longer vacancies and softer asking-rent achievability than the comps imply.
- What's the recent tenant-quality profile in this submarket — average credit score on applications, eviction rate, late-payment / NSF rate, and stable-employment percentage? A property-management company in the area should have these aggregated.
- How much new for-sale + rental construction is in the pipeline within 1–3 miles? Heavy new supply typically softens prices + rents 12–24 months out; constrained supply supports both.
Investment metrics
- 1% rule
- 1.06% ✓
- Cap rate
- 8.96%
- Cash-on-cash
- 9.52%
- DSCR
- 1.42
- GRM
- 7.8
CMA / ARV
- ARV (median comp)
- $236,023
- List price
- $155,000
- Delta
- -34.33%
- Verdict
- UNDERPRICED
- Comps
- 2 within 2.0 mi
Projected returns pro-forma
-3.0% appreciation · 3.0% rent growth · sell at horizon
- IRR
- -2.0%
- Equity multiple
- 0.93×
- Total profit
- $-3,227
- Equity at exit
- $23,111
- IRR
- 7.7%
- Equity multiple
- 1.58×
- Total profit
- $25,255
- Equity at exit
- $13,402
Cash invested: $43,400 (down + closing). Projections, not guarantees.
Landlord ↔ Tenant lean methodology
- Overall (STATE)
- 55 Moderately Landlord-Leaning
- State Virginia
- 55 Moderately Landlord-Leaning · D+2
- County
- — inherits STATE
- City
- — inherits STATE
ZIP-level market 23430
- Home prices YoY
- -17.2%
- Active inventory
- 207
- Price-to-rent
- 7.8×
Monthly cashflow live
- Estimated rent
- $1,650 medium interval (Pro) →
- Mortgage (P&I)
- −$813
- Tax from tax record
- −$82 /mo · $980/yr
- Insurance
- −$65
- HOA
- −$0
- Vacancy / Maint / Mgmt
- −$346
- Net cashflow
- $344
Break-even live
UW: 25.0% down · 7.5% · 30yr · 1.5% tax · 5.0% vac · 8.0% maint · 8.0% mgmt
Financing live
Cash to close
- Down payment
- $38,750
- Closing costs
- $4,650
- Reserves months
- —
- Total cash needed
- —
Loan-product check · same deal, 3 products live
Conventional
25% down · 7.5% · 30yr
- Down + closing
- —
- Monthly P&I
- —
- Monthly cashflow
- —
- DSCR
- —
- Eligible?
- —
Personal DTI + credit; lowest rate.
DSCR
20% down · 8.5% · 30yr
- Down + closing
- —
- Monthly P&I
- —
- Monthly cashflow
- —
- DSCR
- —
- Eligible?
- —
No personal income docs; deal must DSCR.
Hard money
10% down · 12.0% · 12mo
- Down + closing
- —
- Monthly P&I
- —
- Monthly cashflow
- —
- DSCR
- —
- Eligible?
- —
Short-term bridge; refi at stabilization.
Rent comps 1 comps
| Address | Beds | Baths | Sqft | Rent | $/sqft | DOM | Units | Dist |
|---|---|---|---|---|---|---|---|---|
| 13420 Crest Cir Smithfield, VA | 3.0 | 1.0 | 912 | $1,650 | $1.81 | 43d | 1 | 1.44mi |
Listing history 19 events
-
2026-06-18days on market $155,000 Active 44 DOM
-
2026-06-17days on market $155,000 Active 43 DOM
-
2026-06-16days on market $155,000 Active 42 DOM
-
2026-06-15days on market $155,000 Active 41 DOM
-
2026-06-13statusdays on market $155,000 Active 39 DOM
-
2026-06-09days on market $155,000 Active Under Contract 35 DOM
-
2026-06-08statusdays on market $155,000 Active Under Contract 34 DOM
-
2026-06-07days on market $155,000 Active 33 DOM
-
2026-06-03days on market $155,000 Active 29 DOM
-
2026-06-02days on market $155,000 Active 28 DOM
-
2026-06-01days on market $155,000 Active 27 DOM
-
2026-05-31days on market $155,000 Active 26 DOM
-
2026-05-05historical
-
2026-05-05$155,000 Active 478-char remark
-
2026-05-01historical Active Under Contract
-
2026-04-15price $155,000
-
2026-03-27price $190,000
-
2026-03-11price $205,000
-
2026-02-27$230,000 Active
ⓘ Source: listings_history table (triggers on properties + properties_extension) + one-shot
backfill from property_details.listing_events for pre-trigger history.
Tax reassessment forecast VA · Resets to sale price
- Current annual tax
- $980 · $82/mo
- Projected year-2 tax
- $1,271 · $106/mo
- Expected delta
- +$291/yr (+$24/mo · 29.6%)
ⓘ Screening estimate from a state-policy table — verify with the county assessor before closing.
Climate risk First Street
- Flood 1/10 Low FEMA zone X (unshaded) · 0% chance over 30 yrs
- Wildfire 3/10 Moderate
- Heat 8/10 Severe 7 d/yr ≥107°F today · 16 d/yr by 30 yrs out
- Wind 7/10 Severe 78% chance of damaging wind over 30 yrs
- Air quality 1/10 Low 0 unhealthy d/yr today · 0 by 30 yrs out
Nearby sold comps map
Loading sold comps map…
Walkable amenities ~0.75 mi
Loading nearby amenities…
Taxation est. · year 1
- Rental income
- $19,800
- − Mortgage interest
- −$8,682
- − Property taxes
- −$980
- − Insurance
- −$775
- − Repairs & maintenance
- −$1,584
- − Management
- −$1,584
- − Depreciation
- −$4,509
- Taxable income
- $1,685
- Est. tax owed @ 24.0%
- −$404
- After-tax cash flow
- $3,728/yr
For passive investors: Depreciation is non-cash, so a rental often shows a tax loss while cash-flowing — sheltering income. Rental losses are passive: they offset passive income freely, and up to $25,000/yr can offset ordinary (W-2) income if you actively participate and your MAGI is under $100k (phasing out to $0 by $150k); unused losses carry forward. On sale, claimed depreciation is recaptured at up to 25%, and gains may owe capital-gains tax (a 1031 exchange can defer both). Figures are a year-1 estimate at your 24.0% rate — not tax advice; consult a CPA.
Schools (NCES district)
- District
- Isle Of Wight County Public School District
- NCES district ID
- 5102010
- Math proficiency
- 62% ▼ -21.00%
- Reading proficiency
- 73% ▼ -7.00%
- Median HH income
- $64,756
- Composite
- 58.67/100
- National rank
- #982
- State rank
- #28 of 131 in VA
Livability — Rushmere
- Score
- 60/100
- State rank
- #442
- US rank
- #18998
Category grades
Schools grade is shown separately in the Schools card above.
Census & demographics
- Census place
- Rushmere, VA
- Population (ZIP)
- 19,057
Population outlook (Isle of Wight County) Hauer SSP2
- Today (2025)
- 39,005 people
- By 2030
- 40,089 · +2.8%
- By 2040
- 41,703 · +6.9%
- By 2050
- 42,745 · +9.6%
- By 2075
- 47,222 · +21.1%
- By 2100
- 47,810 · +22.6%
Race, ethnicity, and origin ACS 2023
- Neighborhood character
- Predominantly White (70%)
- Race & ethnicity
- White 70% Black 23% Two or more races 4% Hispanic / Latino 3%
- Common ancestry
- Italian 4% Slovak 3% Romanian 2%
- Foreign-born
- 3% · Canada
- Languages at home
- 97% English-only · Spanish 2%
Political lean MEDSL · Isle of Wight
- 2024 margin
- R (+19.8) · D 39.6% · R 59.4%
- 2008→2024 swing
- -6.4pp toward R · 2008: -13.4pp · 2024: -19.8pp
- All cycles
- 2024: R+19.8 2020: R+18.4 2016: R+21.0 2012: R+14.7 2008: R+13.4
Not yet ingested
- Civics
- —
Market trends
- HPI YoY
- ▼ -58.15%
- Current HPI
- 280.3343
- Rent YoY
- —
- Metro
- —
- State GDP YoY
- ▲ 2.40%
- F500 in state
- 50
Industry mix (Fortune 500 HQ in VA)
| Industry | F500 HQs | Revenue |
|---|---|---|
| Aerospace / Defense | 4 | $236B |
|
||
| Technology / Defense | 3 | $32B |
|
||
| Financial Services | 2 | $176B |
|
||
| Utilities | 2 | $27B |
|
||
| Insurance | 2 | $25B |
|
||
| Technology | 2 | $15B |
|
||
Price history
-32.6% since first listed9 events — show timeline
- 2026-06-11 Relisted — REINMLS
- 2026-06-08 Contingent — REINMLS
- 2026-05-05 Listing Removed — REINMLS
- 2026-05-05 Listed $155,000 REINMLS
- 2026-05-01 Contingent — REINMLS
- 2026-04-15 Price Changed $155,000 REINMLS
- 2026-03-27 Price Changed $190,000 REINMLS
- 2026-03-11 Price Changed $205,000 REINMLS
- 2026-02-27 Listed $230,000 REINMLS
Property tax history
+2.5%/yrLatest (2025): $980 · +4.4% YoY. Source: county tax records.
Cash-flow waterfall
monthlySold comps — $/sqft
last 12 mo · ≤1 miLoading sold comps…