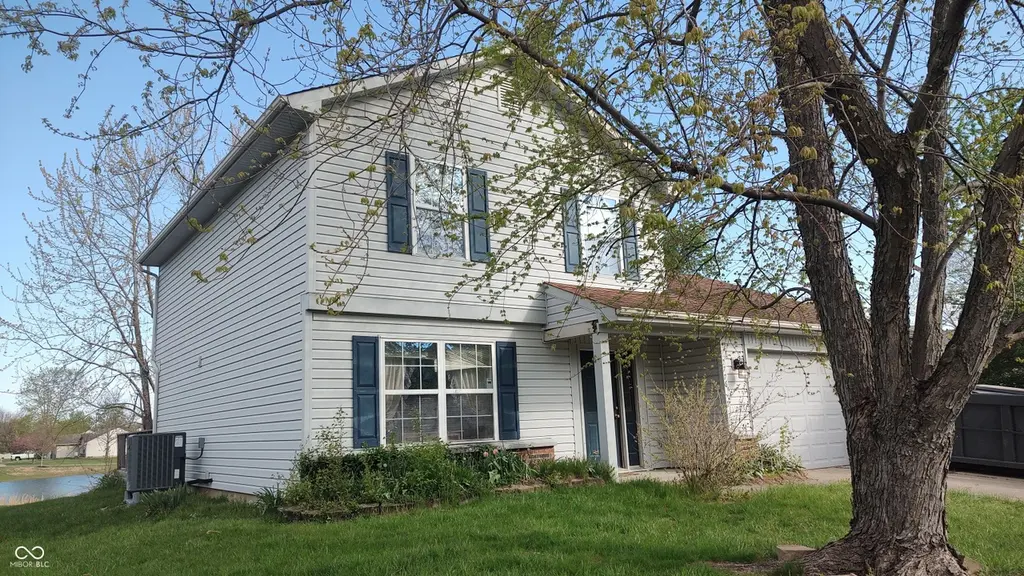
776 Shore View Dr · Franklin, IN
Flood risk 1/10 · Minimal
- FEMA flood zone
- X (unshaded)
- Chance of flooding over 30 yrs
- 0.0%
- Est. flood insurance / yr
- $507 – $1,088
Fire risk 1/10 · Minimal
- Est. fire insurance / yr
- $717 – $1,331
Heat risk 4/10 · Minor
- Hot days now (above 101°F)
- 7 days/yr
- Hot days in 30 yrs
- 19 days/yr
Wind risk 2/10 · Minimal
- Chance of severe wind over 30 yrs
- 1.0%
Air-quality risk 2/10 · Minimal
- Unhealthy air days now
- 1 days/yr
- Unhealthy air days in 30 yrs
- 1 days/yr
Risk factors via First Street. Map © Google.
Why this score? — see what drove the D grade
The composite is a weighted blend of 9 inputs, each scored 0–100. Each bar is that input's sub-score; the figure is the points it added to the 100-point composite (weight × sub-score).
- ARV discount +14.1/15.0
- Cash flow +9.2/30.0
- Rent growth +3.7/5.0
- Schools +3.5/10.0
- Livability +3.2/5.0
- DSCR +2.6/10.0
- Condition / age +2.5/5.0
- 1% rule +2.3/10.0
- Appreciation +0.0/10.0
$255,000
🖨 Deal sheet (PDF) 📄 Offer letter ✓ Due diligence
Listing remarks MLS
Calling all investors and bargain shoppers! This home is a true fixer-upper, but has great bones and a gorgeous pond view. This home will need new carpet, paint, appliances and a deep cleaning. A large deck overlooking the pond adds great value. Inside is a woodburning fireplace with flanking built in oak bookcases. Roof approximately 7 years. HVAC & Water Heater approximately 5 years old. Please note: Home has strong pet odor and is in rough condition. Priced to sell quickly.
Key facts
- Large deck
- Pond view
- 0.24 acre lot
Tags
Neighborhood map
What this means for you Summary
Snapshot
- This is a 3-bed/2.5-bath single-family listed at $255k.
Deal economics
- At list price, monthly cash flow is $-192 ($-2k/yr) — negative.
- To cash-flow at today's rent, offer at most $221k (13.3% below list).
- To meet the 1% rule (rent ≥ 1% of price), the offer needs to be $187k (26.5% below list).
- Recommended offer: $187k (26.5% below list) — sets the bar for 1% rule.
- Cap rate 5.4% vs local median 4.0% in Franklin — top-decile yield for the area; either an underpriced asset or a hidden risk that comps aren't pricing in. Stress-test before assuming the spread holds.
Location & tenants
- Location reads 65/100 on livability (#351 in IN) — a middle-class / working-renter tenant base. Strengths: crime A+, cost of living A+, housing A+; Watch: schools D+, amenities F, commute F.
- Franklin Community School Corporation (suburban): math 36% / reading 44% proficiency, ranked #133 of 301 in IN (top 44%) — families likely to look elsewhere, expect single-tenant / working-renter base with shorter leases.
- Market conditions: Rents rising fast (+4.7%/yr); 282 active listings in the ZIP; 4 comparable units currently listed for rent nearby; rentals lingering (median 45d on market — plan ~5-8 weeks vacancy on turnover, expect pricing pressure); 50% of comp listings sitting > 30 days — soft ceiling on asking rent; solid renter incomes; 1,133 units permitted in Johnson County in 2024 (0 in 5+ unit buildings).
Forward outlook
- Local home prices are declining (-3.0%/yr); year-one equity from $2k of loan paydown is wiped out by about $8k of value loss. Plan a longer hold.
- Johnson County population projected at +26% by 2050 — long-run rental-demand tailwind backs the buy-and-hold thesis.
Negotiation context
- It's been on market 48 days — a 3% lower offer ($247k) is reasonable based on typical stale-listing flexibility.
Questions for the listing agent
- What do current leases actually rent for vs. the listed asking? Can we see a recent rent roll and the last 12 months of T-12 income?
- It's been on market 48 days. Have you received any prior offers? Is the seller open to a 27% concession, seller financing, or rate buy-down credit?
- What does the HOA fee cover, when was the last increase, and are there any pending special assessments or reserve-fund shortfalls?
- Is there a deadline driving the sale (1031 exchange, divorce, estate, relocation)? That informs how much negotiation room exists.
- Schools are D-rated, which usually means shorter tenancies and higher turnover. Who's the typical renter profile here, and what's been the actual vacancy rate?
- The area grade is low — what's the realistic commute time and amenity access for the typical tenant pool here? Any planned neighborhood developments (good or bad) we should know about?
- What's the average days-on-market for RENTAL listings here right now (not sales)? A rising rental-DOM trend means longer vacancies and softer asking-rent achievability than the comps imply.
- What's the recent tenant-quality profile in this submarket — average credit score on applications, eviction rate, late-payment / NSF rate, and stable-employment percentage? A property-management company in the area should have these aggregated.
- How much new for-sale + rental construction is in the pipeline within 1–3 miles? Heavy new supply typically softens prices + rents 12–24 months out; constrained supply supports both.
Investment metrics
- 1% rule
- 0.73% ✗
- Cap rate
- 5.39%
- Cash-on-cash
- -3.24%
- DSCR
- 0.86
- GRM
- 11.3
CMA / ARV
- ARV (median comp)
- $298,567
- List price
- $255,000
- Delta
- -14.59%
- Verdict
- UNDERPRICED
- Comps
- 20 within 1.0 mi
Show comp detail 12 sales within ~0.75 mi
| Address | Dist | Beds/Ba | Sqft | Sold | Price | $/sf | Match |
|---|---|---|---|---|---|---|---|
| 776 Shore View Dr | 0.00mi | 3/2.5 | 1,644 (0%) | 0mo | $215,000 | $131 | 100 |
| 731 Franklin Lakes Blvd | 0.16mi | 3/2.0 | 1,652 (+0%) | 2mo | $259,900 | $157 | 88 |
| 607 S View Ct | 0.05mi | 3/2.0 | 1,612 (-2%) | 9mo | $290,000 | $180 | 85 |
| 982 Youngs Creek Dr | 0.38mi | 3/2.0 | 1,553 (-6%) | 1mo | $272,500 | $175 | 70 |
| 921 Sagittarius Ave | 0.53mi | 3/2.0 | 1,692 (+3%) | 2mo | $325,000 | $192 | 67 |
| 1195 Andromeda Dr | 0.68mi | 3/2.0 | 1,613 (-2%) | 1mo | $310,000 | $192 | 62 |
| 990 Constellation Way | 0.54mi | 4/2.5 (+1) | 1,623 (-1%) | 8mo | $305,000 | $188 | 60 |
| 1177 Pegasus Dr | 0.68mi | 3/2.0 | 1,687 (+3%) | 2mo | $324,995 | $193 | 60 |
| 1009 Foxtail Dr | 0.49mi | 3/2.5 | 1,842 (+12%) | 2mo | $315,000 | $171 | 55 |
| 1237 Supernova Dr | 0.70mi | 3/2.0 | 1,613 (-2%) | 9mo | $307,508 | $191 | 55 |
| 1020 Constellation Way | 0.59mi | 3/2.0 | 1,804 (+10%) | 2mo | $310,000 | $172 | 53 |
| 1157 Supernova Dr | 0.61mi | 3/2.0 | 1,866 (+14%) | 6mo | $324,900 | $174 | 42 |
Match score weights: distance 35% · size 25% · config 20% · recency 20%. Top-matched comps best support the ARV.
Projected returns pro-forma
-3.0% appreciation · 4.68% rent growth · sell at horizon
- IRR
- -20.0%
- Equity multiple
- 0.29×
- Total profit
- $-50,389
- Equity at exit
- $38,021
- IRR
- -9.9%
- Equity multiple
- 0.35×
- Total profit
- $-46,103
- Equity at exit
- $22,048
Cash invested: $71,400 (down + closing). Projections, not guarantees.
Landlord ↔ Tenant lean methodology
- Overall (STATE)
- 90 Strongly Landlord-Friendly
- State Indiana
- 90 Strongly Landlord-Friendly · R+11
- County
- — inherits STATE
- City
- — inherits STATE
ZIP-level market 46131
- Home prices YoY
- -27.8%
- Rents YoY
- 4.7%
- Active inventory
- 282
- Price-to-rent
- 11.3×
Monthly cashflow live
- Estimated rent
- $1,873 medium interval (Pro) →
- Mortgage (P&I)
- −$1,337
- Tax from tax record
- −$212 /mo · $2,543/yr
- Insurance
- −$106
- HOA
- −$17
- Vacancy / Maint / Mgmt
- −$393
- Net cashflow
- $-192
Break-even live
Sensitivity live
| Price | -10% $-48 | -5% $-120 | +0% $-192 | +5% $-265 | +10% $-337 |
|---|---|---|---|---|---|
| Rent | -10% $-340 | -5% $-266 | +0% $-192 | +5% $-119 | +10% $-45 |
| Rate | -1.0pp $-64 | -0.5pp $-128 | base $-192 | +0.5pp $-259 | +1.0pp $-326 |
UW: 25.0% down · 7.5% · 30yr · 1.5% tax · 5.0% vac · 8.0% maint · 8.0% mgmt
Financing live
Cash to close
- Down payment
- $63,750
- Closing costs
- $7,650
- Reserves months
- —
- Total cash needed
- —
Loan-product check · same deal, 3 products live
Conventional
25% down · 7.5% · 30yr
- Down + closing
- —
- Monthly P&I
- —
- Monthly cashflow
- —
- DSCR
- —
- Eligible?
- —
Personal DTI + credit; lowest rate.
DSCR
20% down · 8.5% · 30yr
- Down + closing
- —
- Monthly P&I
- —
- Monthly cashflow
- —
- DSCR
- —
- Eligible?
- —
No personal income docs; deal must DSCR.
Hard money
10% down · 12.0% · 12mo
- Down + closing
- —
- Monthly P&I
- —
- Monthly cashflow
- —
- DSCR
- —
- Eligible?
- —
Short-term bridge; refi at stabilization.
Rent comps 4 comps
| Address | Beds | Baths | Sqft | Rent | $/sqft | DOM | Units | Dist |
|---|---|---|---|---|---|---|---|---|
| 1037 W Jefferson St Franklin, IN | 2.0–3.0 | 2.0 | 1131 | $1,633 | $1.44 | 2d | 6 | 0.63mi |
| 150 S Main St Franklin, IN | 3.0 | 2.0 | 1500 | $2,400 | $1.60 | 45d | 1 | 0.66mi |
| 399 N Main St Unit 1 Franklin, IN | 2.0 | 2.0 | 1177 | $1,150 | $0.98 | 45d | 1 | 0.98mi |
| 399 N Main St Unit 2 Franklin, IN | 2.0 | 2.0 | 1177 | $1,150 | $0.98 | 24d | 1 | 0.98mi |
HOA detail
- Monthly dues
- $17 · $204/yr
- Likely covers
- water
Listing history 1 events
-
2026-04-09$255,000 Active 486-char remark
Show marketing remark (486 chars)
Calling all investors and bargain shoppers! This home is a true fixer-upper, but has great bones and a gorgeous pond view. This home will need new carpet, paint, appliances and a deep cleaning. A large deck overlooking the pond adds great value. Inside is a woodburning fireplace with flanking built in oak bookcases. Roof approximately 7 years. HVAC & Water Heater approximately 5 years old. Please note: Home has strong pet odor and is in rough condition. Priced to sell quickly.
ⓘ Source: listings_history table (triggers on properties + properties_extension) + one-shot
backfill from property_details.listing_events for pre-trigger history.
Tax reassessment forecast IN · Partial reset (capped growth)
- Current annual tax
- $2,543 · $212/mo
- Projected year-2 tax
- $2,543 · $212/mo
- Expected delta
- $0/yr ($0/mo · 0.0%)
ⓘ Screening estimate from a state-policy table — verify with the county assessor before closing.
Climate risk First Street
- Flood 1/10 Low FEMA zone X (unshaded) · 0% chance over 30 yrs
- Wildfire 1/10 Low
- Heat 4/10 Moderate 7 d/yr ≥101°F today · 19 d/yr by 30 yrs out
- Wind 2/10 Low 100% chance of damaging wind over 30 yrs
- Air quality 2/10 Low 1 unhealthy d/yr today · 1 by 30 yrs out
Nearby sold comps map
Loading sold comps map…
Walkable amenities ~0.75 mi
Loading nearby amenities…
Taxation est. · year 1
- Rental income
- $22,479
- − Mortgage interest
- −$14,284
- − Property taxes
- −$2,543
- − Insurance
- −$1,275
- − Repairs & maintenance
- −$1,798
- − Management
- −$1,798
- − HOA
- −$204
- − Depreciation
- −$7,418
- Taxable loss
- −$6,841
- Est. tax savings @ 24.0%
- +$1,642
- After-tax cash flow
- $-668/yr
For passive investors: Depreciation is non-cash, so a rental often shows a tax loss while cash-flowing — sheltering income. Rental losses are passive: they offset passive income freely, and up to $25,000/yr can offset ordinary (W-2) income if you actively participate and your MAGI is under $100k (phasing out to $0 by $150k); unused losses carry forward. On sale, claimed depreciation is recaptured at up to 25%, and gains may owe capital-gains tax (a 1031 exchange can defer both). Figures are a year-1 estimate at your 24.0% rate — not tax advice; consult a CPA.
Schools (NCES district)
- District
- Franklin Community School Corporation
- NCES district ID
- 1803690
- Math proficiency
- 36% ▼ -11.00%
- Reading proficiency
- 44% ▼ -8.00%
- Median HH income
- $54,855
- Composite
- 34.93/100
- National rank
- #5066
- State rank
- #133 of 301 in IN
Livability — Franklin
- Score
- 65/100
- State rank
- #351
- US rank
- #13428
Category grades
Schools grade is shown separately in the Schools card above.
Census & demographics
- Census place
- Franklin, IN
- County
- Johnson County · 154,261 people
- City population
- 34,647
- Metro
- Indianapolis-Carmel-Anderson, IN
- Population (ZIP)
- 34,647
- Household income
- $85,076
- Rent vs Own
- Severe rent burden
- 984.0
Population outlook (Johnson County) Hauer SSP2
- Today (2025)
- 170,080 people
- By 2030
- 179,983 · +5.8%
- By 2040
- 198,580 · +16.8%
- By 2050
- 214,661 · +26.2%
- By 2075
- 247,990 · +45.8%
- By 2100
- 257,821 · +51.6%
Race, ethnicity, and origin ACS 2023
- Neighborhood character
- Predominantly White (92%)
- Race & ethnicity
- White 92% Two or more races 4% Hispanic / Latino 2% Black 2%
- Common ancestry
- Slovak 2% Italian 1% Serbian 1%
- Foreign-born
- 2% · Canada
- Languages at home
- 97% English-only · Spanish 2% Russian/Polish/Slavic 1% Other Asian/Pacific 1%
Political lean MEDSL · Johnson
- 2024 margin
- Solid R (+34.3) · D 32.0% · R 66.3% · Other 1.7%
- 2008→2024 swing
- -8.9pp toward R · 2008: -25.5pp · 2024: -34.3pp
- All cycles
- 2024: R+34.3 2020: R+34.1 2016: R+42.5 2012: R+38.5 2008: R+25.5
Not yet ingested
- Civics
- —
Market trends
- HPI YoY
- ▼ -90.53%
- Current HPI
- 235.0009
- Rent YoY
- ▲ 4.68%
- Metro
- Indianapolis-Carmel-Anderson, IN
- State GDP YoY
- ▲ 2.90%
- F500 in state
- 18
Industry mix (Fortune 500 HQ in IN)
| Industry | F500 HQs | Revenue |
|---|---|---|
| Industrial Machinery | 2 | $37B |
|
||
| Healthcare | 1 | $177B |
|
||
| Pharmaceuticals | 1 | $45B |
|
||
| Metals / Steel | 1 | $18B |
|
||
| Agriculture | 1 | $17B |
|
||
| Packaging | 1 | $12B |
|
||
Price history
1 event — show timeline
- 2026-04-09 Listed $255,000 MIBOR as Distributed by MLS Grid
Property tax history
+6.8%/yrLatest (2024): $2,543 · +3.4% YoY. Source: county tax records.
Cash-flow waterfall
monthlySold comps — $/sqft
last 12 mo · ≤1 miLoading sold comps…