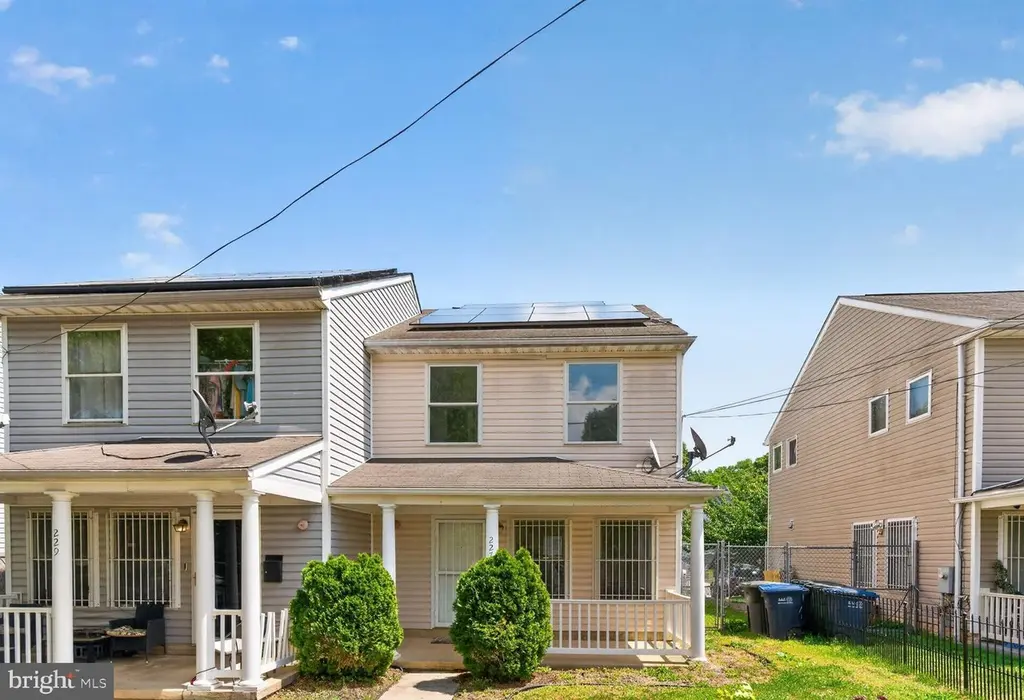
227 54th St NE · Washington, DC
Flood risk 1/10 · Minimal
- FEMA flood zone
- X (unshaded)
- Chance of flooding over 30 yrs
- 0.0%
- Est. flood insurance / yr
- $507 – $1,088
Fire risk 1/10 · Minimal
- Est. fire insurance / yr
- $631 – $1,173
Heat risk 8/10 · Major
- Hot days now (above 103°F)
- 7 days/yr
- Hot days in 30 yrs
- 15 days/yr
Wind risk 4/10 · Minor
- Chance of severe wind over 30 yrs
- 21.0%
Air-quality risk 4/10 · Minor
- Unhealthy air days now
- 4 days/yr
- Unhealthy air days in 30 yrs
- 5 days/yr
Risk factors via First Street. Map © Google.
Why this score? — see what drove the C- grade
The composite is a weighted blend of 9 inputs, each scored 0–100. Each bar is that input's sub-score; the figure is the points it added to the 100-point composite (weight × sub-score).
- Cash flow +20.6/30.0
- ARV discount +7.4/15.0
- DSCR +6.6/10.0
- 1% rule +4.4/10.0
- Rent growth +4.0/5.0
- Livability +3.7/5.0
- Schools +3.6/10.0
- Condition / age +2.5/5.0
- Appreciation +0.0/10.0
$299,000
🖨 Deal sheet (PDF) 📄 Offer letter ✓ Due diligence
Listing remarks
PRICE REDUCED!! This is an affordable homeownership opportunity offered in partnership with Habitat for Humanity and Douglass Community Land Trust. This adorable home will amaze you as soon as you walk inside. It features 3 spacious bedrooms, 1 full bathroom, large living room/dining room combination, spacious eat-in gourmet kitchen, laundry room, engineered wood floors and is in mint move-in condition. There is a total of 1,476 sf of interior living space, large front/rear yard with shed and 2-car off street parking. Habitat for Humanity requires you complete their application form to confirm that you qualify for purchasing this home. Please check out "View Documents" for the app
Key facts
- Parking
- Built 2003
- Listed 44 days
Property features AI
Finance
- Other: Ground rent paid annually; Pets allowed with no restrictions
Exterior
- Parking: Total of 1 garage/parking space; Driveway with 1 space; Off-street parking and off-site parking available; Concrete driveway
- Utilities: Public water; Public sewer
- Home design: Semi-detached; Fee simple ownership; Property in excellent condition; Effective remodel year 2025
- Construction: Vinyl siding; Block foundation; Double-pane windows; Roof details unknown; Building not winterized; Year built (effective): 2025
- Exterior features: No basement; Above-grade and below-grade other structures
Interior
- Kitchen: Built-in range; Stove; Range hood; Dishwasher; Disposal; Refrigerator; Exhaust fan
- Bedrooms: 3 bedrooms on the main level
- Flooring: Engineered wood; Carpet; Ceramic tile
- Bathrooms: 1 full bathroom on the main level
- Heating & cooling: Central heating (electric); Central air conditioning (electric); Electric hot water
- Interior features: Breakfast area; Carpeted areas
- Laundry & utility: Washer in unit (main floor); Dryer in unit, electric (main floor)
Neighborhood map
What this means for you Summary
Snapshot
- This is a 3-bed/1.0-bath townhouse listed at $299k.
Deal economics
- At list price, monthly cash flow is $400 ($5k/yr) — positive.
- The deal already cash-flows at list — no discount required.
- To meet the 1% rule (rent ≥ 1% of price), the offer needs to be $282k (5.8% below list).
- Recommended offer: $282k (5.8% below list) — sets the bar for 1% rule.
- Cap rate 7.9% vs local median 2.5% in Washington — top-decile yield for the area; either an underpriced asset or a hidden risk that comps aren't pricing in. Stress-test before assuming the spread holds.
Location & tenants
- Location reads 73/100 on livability (#1 in DC) — a middle-class / working-renter tenant base. Strengths: amenities A+, commute A+, employment A+; Watch: crime F, cost of living F.
- District Of Columbia Public Schools (urban): math 33% / reading 40% proficiency, ranked #8 of 32 in DC (top 25%) — families likely to look elsewhere, expect single-tenant / working-renter base with shorter leases; 65% free/reduced lunch — lower-income household profile, screen leases tightly.
- Market conditions: Rents rising fast (+6.1%/yr); 276 active listings in the ZIP; 40 comparable units currently listed for rent nearby; rentals at typical pace (median 25d on market — plan ~3-4 weeks tenant-placement turnaround); 1,737 units permitted in District of Columbia in 2024 (1,506 in 5+ unit buildings).
- At $2,815/mo this rent would consume 58% of the median local household income ($58k/yr) (locally 5115% of renters already pay >50% of income on rent) — very limited rent-growth headroom before tenants either downsize or default.
Forward outlook
- Local home prices are declining (-3.0%/yr); year-one equity from $2k of loan paydown is wiped out by about $9k of value loss. Plan a longer hold.
- District of Columbia County population projected at +50% by 2050 — long-run rental-demand tailwind backs the buy-and-hold thesis.
Negotiation context
- It's been on market 44 days — a 3% lower offer ($290k) is reasonable based on typical stale-listing flexibility.
- 4 sale attempts with the ask held roughly flat each time — persistent listings suggest the price (not the market) is what's stuck; bring a comps-based counter.
Risks & watch-outs
- Climate carrying-cost: extreme-heat days projected 7→15/yr by 2055 (HVAC capex compounding) — expect insurance premiums to compound above CPI over the hold.
Questions for the listing agent
- It's been on market 44 days. Have you received any prior offers? Is the seller open to a 6% concession, seller financing, or rate buy-down credit?
- Is there a deadline driving the sale (1031 exchange, divorce, estate, relocation)? That informs how much negotiation room exists.
- Crime grade is F in this area — have there been break-ins, vandalism, or insurance claims at this property in the last 3 years? What carrier currently insures it and at what premium?
- What's the average days-on-market for RENTAL listings here right now (not sales)? A rising rental-DOM trend means longer vacancies and softer asking-rent achievability than the comps imply.
- What's the recent tenant-quality profile in this submarket — average credit score on applications, eviction rate, late-payment / NSF rate, and stable-employment percentage? A property-management company in the area should have these aggregated.
- How much new for-sale + rental construction is in the pipeline within 1–3 miles? Heavy new supply typically softens prices + rents 12–24 months out; constrained supply supports both.
Investment metrics
- 1% rule
- 0.94% ✗
- Cap rate
- 7.90%
- Cash-on-cash
- 5.73%
- DSCR
- 1.26
- GRM
- 8.9
CMA / ARV
- ARV (on-the-fly)
- $298,152
- Comps found
- 12
Show comp detail 12 sales within ~0.75 mi
| Address | Dist | Beds/Ba | Sqft | Sold | Price | $/sf | Match |
|---|---|---|---|---|---|---|---|
| 5225 Central Ave SE | 0.38mi | 3/1.5 | 1,512 (+2%) | 8mo | $270,000 | $179 | 70 |
| 5345 Ames St NE | 0.16mi | 2/2.0 (-1) | 1,358 (-8%) | 7mo | $300,000 | $221 | 64 |
| 5755 East Capitol St SE | 0.35mi | 3/1.5 | 1,328 (-10%) | 2mo | $375,000 | $282 | 64 |
| 4545 Eads St NE | 0.68mi | 3/1.0 | 1,452 (-2%) | 3mo | $291,200 | $201 | 63 |
| 515 47th St NE | 0.64mi | 3/1.5 | 1,436 (-3%) | 1mo | $211,000 | $147 | 63 |
| 4942 Blaine St NE | 0.41mi | 2/1.0 (-1) | 1,589 (+8%) | 4mo | $240,000 | $151 | 59 |
| 5303 Jay St NE | 0.60mi | 4/1.0 (+1) | 1,404 (-5%) | 5mo | $200,000 | $142 | 54 |
| 5103 Jay St NE | 0.64mi | 3/2.5 | 1,414 (-4%) | 4mo | $401,000 | $284 | 54 |
| 5545 Bass Pl SE | 0.59mi | 3/2.5 | 1,584 (+7%) | 1mo | $320,000 | $202 | 53 |
| 5019 Just St NE | 0.74mi | 3/1.5 | 1,364 (-8%) | 1mo | $397,000 | $291 | 50 |
| 5716 Foote St NE | 0.42mi | 2/2.0 (-1) | 1,260 (-15%) | 6mo | $199,500 | $158 | 42 |
| 4614 B St SE | 0.71mi | 3/2.5 | 1,328 (-10%) | 7mo | $331,500 | $250 | 38 |
Match score weights: distance 35% · size 25% · config 20% · recency 20%. Top-matched comps best support the ARV.
Projected returns pro-forma
-3.0% appreciation · 6.06% rent growth · sell at horizon
- IRR
- -4.4%
- Equity multiple
- 0.83×
- Total profit
- $-14,147
- Equity at exit
- $44,582
- IRR
- 8.2%
- Equity multiple
- 1.71×
- Total profit
- $59,091
- Equity at exit
- $25,852
Cash invested: $83,720 (down + closing). Projections, not guarantees.
Landlord ↔ Tenant lean methodology
- Overall (CITY)
- 0 Strongly Tenant-Friendly
- State District of Columbia
- 12 Strongly Tenant-Friendly · D+43
- County
- — inherits STATE
- City Washington
- 0 Strongly Tenant-Friendly · D+43
ZIP-level market 20019
- Rents YoY
- 6.1%
- Active inventory
- 276
- Price-to-rent
- 8.9×
Monthly cashflow live
- Estimated rent
- $2,815 high interval (Pro) →
- Mortgage (P&I)
- −$1,568
- Tax from tax record
- −$131 /mo · $1,577/yr
- Insurance
- −$125
- HOA
- −$0
- Vacancy / Maint / Mgmt
- −$591
- Net cashflow
- $400
Break-even live
Sensitivity live
| Price | -10% $569 | -5% $485 | +0% $400 | +5% $315 | +10% $231 |
|---|---|---|---|---|---|
| Rent | -10% $178 | -5% $289 | +0% $400 | +5% $511 | +10% $622 |
| Rate | -1.0pp $551 | -0.5pp $476 | base $400 | +0.5pp $323 | +1.0pp $244 |
UW: 25.0% down · 7.5% · 30yr · 1.5% tax · 5.0% vac · 8.0% maint · 8.0% mgmt
Financing live
Cash to close
- Down payment
- $74,750
- Closing costs
- $8,970
- Reserves months
- —
- Total cash needed
- —
Loan-product check · same deal, 3 products live
Conventional
25% down · 7.5% · 30yr
- Down + closing
- —
- Monthly P&I
- —
- Monthly cashflow
- —
- DSCR
- —
- Eligible?
- —
Personal DTI + credit; lowest rate.
DSCR
20% down · 8.5% · 30yr
- Down + closing
- —
- Monthly P&I
- —
- Monthly cashflow
- —
- DSCR
- —
- Eligible?
- —
No personal income docs; deal must DSCR.
Hard money
10% down · 12.0% · 12mo
- Down + closing
- —
- Monthly P&I
- —
- Monthly cashflow
- —
- DSCR
- —
- Eligible?
- —
Short-term bridge; refi at stabilization.
Rent comps 40 comps
| Address | Beds | Baths | Sqft | Rent | $/sqft | DOM | Units | Dist |
|---|---|---|---|---|---|---|---|---|
| 337 54th St NE Unit A Washington, DC | 3.0 | 1.5 | 1184 | $2,850 | $2.41 | 25d | 1 | 0.09mi |
| 5347 Ames St NE Washington, DC | 3.0 | 2.0 | 1428 | $3,000 | $2.10 | 25d | 1 | 0.18mi |
| 5032 E Capitol St NE Washington, DC | 2.0 | 3.5 | 1775 | $2,950 | $1.66 | 13d | 1 | 0.36mi |
| 5074 Central Ave SE Washington, DC | 4.0 | 2.0 | 1349 | $5,200 | $3.85 | 22d | 1 | 0.37mi |
| 113 56th St SE Washington, DC | 3.0 | 2.0 | 1764 | $3,000 | $1.70 | 12d | 1 | 0.40mi |
| 716 55th St NE Unit 1 Washington, DC | 2.0 | 2.0 | 1100 | $2,200 | $2.00 | 20d | 1 | 0.42mi |
| 599 50th St NE Washington, DC | 1.0–2.0 | 1.0–2.0 | 775 | $2,081 | $2.69 | 25d | 1 | 0.45mi |
| 5501 Jay St NE Washington, DC | 4.0 | 3.0 | 1848 | $3,300 | $1.79 | 25d | 1 | 0.49mi |
| 4930 Eads Pl NE Washington, DC | 3.0 | 1.5 | 1054 | $2,400 | $2.28 | 25d | 1 | 0.50mi |
| 5539 Central Ave SE Washington, DC | 3.0 | 2.0 | 1140 | $2,300 | $2.02 | 22d | 1 | 0.51mi |
| 4932 A St SE #302 Washington, DC | 2.0 | 2.0 | 1007 | $2,495 | $2.48 | 4d | 1 | 0.52mi |
| 5020 Astor Pl SE Apt 3 Washington, DC | 2.0 | 1.0 | 1600 | $2,250 | $1.41 | 25d | 1 | 0.52mi |
| 5532 B St SE Washington, DC | 2.0 | 2.0 | 1188 | $2,800 | $2.36 | 25d | 1 | 0.53mi |
| 556 49th Pl NE Washington, DC | 3.0 | 3.0 | 894 | $3,475 | $3.89 | 25d | 1 | 0.56mi |
| 805 Eastern Ave Fairmount Heights, MD | 4.0 | 2.0 | 936 | $2,400 | $2.56 | 5d | 1 | 0.56mi |
| 809 Eastern Ave Fairmount Heights, MD | 3.0 | 2.0 | 1246 | $2,400 | $1.93 | 5d | 1 | 0.57mi |
| 5344 C St SE Unit 102 Washington, DC | 3.0 | 2.0 | 1000 | $2,499 | $2.50 | 25d | 1 | 0.58mi |
| 5344 C St SE Unit 302 Washington, DC | 3.0 | 2.0 | 1000 | $2,100 | $2.10 | 25d | 1 | 0.58mi |
| 814 51st St NE Washington, DC | 3.0 | 1.0 | 1210 | $2,200 | $1.82 | 25d | 1 | 0.58mi |
| 5338 Jay St NE Washington, DC | 3.0 | 1.5 | 1000 | $2,795 | $2.79 | 25d | 1 | 0.58mi |
| 4724 Blaine St NE Washington, DC | 3.0 | 2.0 | 1152 | $3,085 | $2.68 | 2d | 1 | 0.60mi |
| 323 62nd St NE Washington, DC | 1.0–3.0 | 1.0–2.0 | 908 | $2,435 | $2.68 | 25d | 1 | 0.60mi |
| 5126 Call Pl SE Washington, DC | 2.0 | 1.5 | 1741 | $3,050 | $1.75 | 25d | 1 | 0.64mi |
| 22 Chamber Ave Capitol Heights, MD | 3.0 | 1.0 | 942 | $3,000 | $3.18 | 44d | 1 | 0.65mi |
| 5401 Call Pl SE Washington, DC | 2.0–3.0 | 1.0 | 1094 | $2,626 | $2.40 | 2d | 2 | 0.65mi |
| 4686 A St SE Washington, DC | 4.0 | 3.0 | 1181 | $3,500 | $2.96 | 8d | 1 | 0.66mi |
| 5213 Just St NE Washington, DC | 3.0 | 2.0 | 1114 | $2,400 | $2.15 | 25d | 1 | 0.67mi |
| 6340 Southern Ave NE Washington, DC | 4.0 | 2.0 | 1248 | $4,200 | $3.37 | 25d | 1 | 0.71mi |
| 4615 Central Ave NE Unit B Washington, DC | 2.0 | 1.0 | 875 | $1,450 | $1.66 | 25d | 1 | 0.72mi |
| 832 49th St NE Unit 1 Washington, DC | 3.0 | 1.0 | 1100 | $2,350 | $2.14 | 8d | 1 | 0.73mi |
| 832 49th St NE Washington, DC | 3.0 | 1.0 | 1100 | $2,425 | $2.20 | 17d | 1 | 0.73mi |
| 832 49th St NE Unit 1 Washington, DC | 3.0 | 1.0 | 1100 | $2,425 | $2.20 | 25d | 1 | 0.73mi |
| 4523 Dix St NE Washington, DC | 3.0 | 3.0 | 1292 | $3,000 | $2.32 | 8d | 1 | 0.74mi |
| 4627 Gault Pl NE Washington, DC | 3.0 | 1.0 | 1195 | $3,800 | $3.18 | 22d | 1 | 0.77mi |
| 4934 Just St NE Washington, DC | 2.0 | 1.0 | 966 | $2,200 | $2.28 | 25d | 1 | 0.78mi |
| 4950 Just St NE Washington, DC | 3.0 | 2.0 | 1437 | $4,000 | $2.78 | 25d | 1 | 0.78mi |
| 6313 Field St Capitol Heights, MD | 3.0 | 2.0 | 1700 | $2,250 | $1.32 | 18d | 1 | 0.79mi |
| 5119 E St SE Washington, DC | 3.0 | 1.0 | 941 | $4,000 | $4.25 | 19d | 1 | 0.81mi |
| 6801 James Farmer Way Capitol Heights, MD | 3.0 | 1.5 | 1512 | $2,150 | $1.42 | 18d | 1 | 0.84mi |
| 907 47th Pl NE Unit 1 Washington, DC | 2.0 | 1.0 | 950 | $1,575 | $1.66 | 15d | 1 | 0.87mi |
Listing history 20 events
-
2026-06-18days on market $299,000 Active 44 DOM
-
2026-06-17days on market $299,000 Active 43 DOM
-
2026-06-16days on market $299,000 Active 42 DOM
-
2026-06-15days on market $299,000 Active 41 DOM
-
2026-06-13days on market $299,000 Active 39 DOM
-
2026-06-09days on market $299,000 Active 35 DOM
-
2026-06-08days on market $299,000 Active 34 DOM
-
2026-06-07days on market $299,000 Active 33 DOM
-
2026-06-04days on market $299,000 Active 30 DOM
-
2026-06-03days on market $299,000 Active 29 DOM
-
2026-06-02days on market $299,000 Active 28 DOM
-
2026-06-01days on market $299,000 Active 27 DOM
-
2026-05-31days on market $299,000 Active 26 DOM
-
2026-05-05historical
-
2026-05-05$299,000 Active
-
2026-04-26$325,000 Active
-
2026-04-26historical
-
2026-04-06historical
-
2026-04-06$325,000 Active
-
2026-02-26$325,000 Active
ⓘ Source: listings_history table (triggers on properties + properties_extension) + one-shot
backfill from property_details.listing_events for pre-trigger history.
Tax reassessment forecast DC · Partial reset (capped growth)
- Current annual tax
- $1,577 · $131/mo
- Projected year-2 tax
- $1,700 · $142/mo
- Expected delta
- +$124/yr (+$10/mo · 7.8%)
ⓘ Screening estimate from a state-policy table — verify with the county assessor before closing.
Climate risk First Street
- Flood 1/10 Low FEMA zone X (unshaded) · 0% chance over 30 yrs
- Wildfire 1/10 Low
- Heat 8/10 Severe 7 d/yr ≥103°F today · 15 d/yr by 30 yrs out
- Wind 4/10 Moderate 21% chance of damaging wind over 30 yrs
- Air quality 4/10 Moderate 4 unhealthy d/yr today · 5 by 30 yrs out
Nearby sold comps map
Loading sold comps map…
Walkable amenities ~0.75 mi
Loading nearby amenities…
Taxation est. · year 1
- Rental income
- $33,782
- − Mortgage interest
- −$16,749
- − Property taxes
- −$1,577
- − Insurance
- −$1,495
- − Repairs & maintenance
- −$2,703
- − Management
- −$2,703
- − Depreciation
- −$8,698
- Taxable loss
- −$142
- Est. tax savings @ 24.0%
- +$34
- After-tax cash flow
- $4,834/yr
For passive investors: Depreciation is non-cash, so a rental often shows a tax loss while cash-flowing — sheltering income. Rental losses are passive: they offset passive income freely, and up to $25,000/yr can offset ordinary (W-2) income if you actively participate and your MAGI is under $100k (phasing out to $0 by $150k); unused losses carry forward. On sale, claimed depreciation is recaptured at up to 25%, and gains may owe capital-gains tax (a 1031 exchange can defer both). Figures are a year-1 estimate at your 24.0% rate — not tax advice; consult a CPA.
Schools (NCES district)
- District
- District Of Columbia Public Schools
- NCES district ID
- 1100030
- Math proficiency
- 33% ▲ 3.00%
- Reading proficiency
- 40% ▲ 5.00%
- Median HH income
- $67,671
- Composite
- 35.84/100
- National rank
- #9606
- State rank
- #8 of 32 in DC
Livability — Washington
- Score
- 73/100
- State rank
- #1
- US rank
- #5327
Category grades
Schools grade is shown separately in the Schools card above.
Census & demographics
- Census place
- Washington, DC
- County
- District of Columbia · 671,873 people
- City population
- 671,873
- Metro
- Washington-Arlington-Alexandria, DC-VA-MD-WV
- Population (ZIP)
- 63,380
- Household income
- $58,296
- Rent vs Own
- Severe rent burden
- 5115.0
Population outlook (District of Columbia County) Hauer SSP2
- Today (2025)
- 821,926 people
- By 2030
- 899,517 · +9.4%
- By 2040
- 1,061,162 · +29.1%
- By 2050
- 1,231,493 · +49.8%
- By 2075
- 1,603,312 · +95.1%
- By 2100
- 1,847,141 · +124.7%
Race, ethnicity, and origin ACS 2023
- Neighborhood character
- Predominantly Black (87%)
- Race & ethnicity
- Black 87% Hispanic / Latino 7% Two or more races 4% White 2%
- Hispanic origin (detail)
- Mexican 1% Dominican 1%
- Foreign-born
- 6% · Canada
- Languages at home
- 91% English-only · Spanish 6% French/Haitian/Cajun 1%
Political lean MEDSL · District of Columbia
- 2024 margin
- Solid D (+86.1) · D 91.2% · R 5.1% · Other 3.8%
- 2008→2024 swing
- +0.1pp no change · 2008: 85.9pp · 2024: 86.1pp
- All cycles
- 2024: D+86.1 2020: D+86.8 2016: D+88.7 2012: D+84.2 2008: D+85.9
Not yet ingested
- Civics
- —
Market trends
- HPI YoY
- ▼ -416.91%
- Current HPI
- 326.4481
- Rent YoY
- ▲ 6.06%
- Metro
- Washington-Arlington-Alexandria, DC-VA-MD-WV
- State GDP YoY
- ▲ 1.33%
- F500 in state
- 6
Industry mix (Fortune 500 HQ in DC)
| Industry | F500 HQs | Revenue |
|---|---|---|
| Financial Services | 1 | $153B |
|
||
| Life Sciences / Industrials | 1 | $25B |
|
||
| Industrial Machinery | 1 | $8B |
|
||
Price history
-8.0% since first listed7 events — show timeline
- 2026-05-05 Listed $299,000 BRIGHT MLS
- 2026-05-05 Listing Removed — BRIGHT MLS
- 2026-04-26 Listing Removed — BRIGHT MLS
- 2026-04-26 Listed $325,000 BRIGHT MLS
- 2026-04-06 Listed $325,000 BRIGHT MLS
- 2026-04-06 Listing Removed — BRIGHT MLS
- 2026-02-26 Listed $325,000 BRIGHT MLS
Property tax history
+3.2%/yrLatest (2025): $1,577 · +8.4% YoY. Source: county tax records.
Cash-flow waterfall
monthlySold comps — $/sqft
last 12 mo · ≤1 miLoading sold comps…