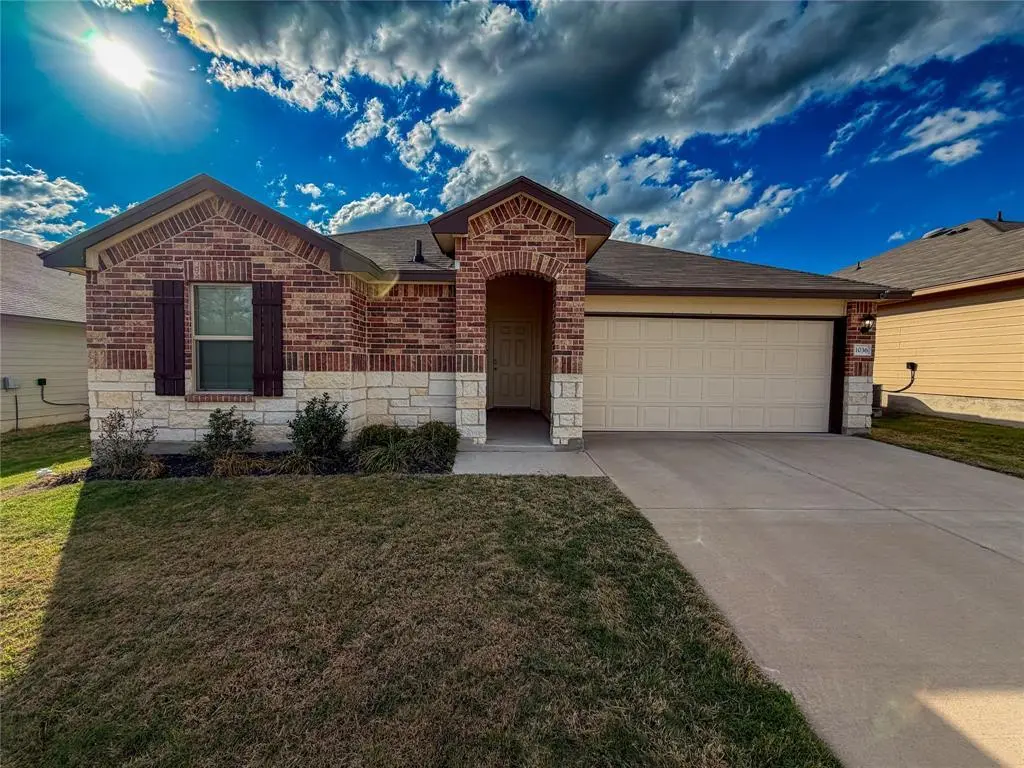
1036 Chambray Dr · Troy, TX
Flood risk 1/10 · Minimal
- FEMA flood zone
- X (unshaded)
- Chance of flooding over 30 yrs
- 0.0%
- Est. flood insurance / yr
- $507 – $1,088
Fire risk 5/10 · Moderate
- Est. fire insurance / yr
- $1,222 – $2,270
Heat risk 7/10 · Major
- Hot days now (above 107°F)
- 7 days/yr
- Hot days in 30 yrs
- 24 days/yr
Wind risk 8/10 · Major
- Chance of severe wind over 30 yrs
- 80.0%
Air-quality risk 2/10 · Minimal
- Unhealthy air days now
- 0 days/yr
- Unhealthy air days in 30 yrs
- 1 days/yr
Risk factors via First Street. Map © Google.
Why this score? — see what drove the D- grade
The composite is a weighted blend of 9 inputs, each scored 0–100. Each bar is that input's sub-score; the figure is the points it added to the 100-point composite (weight × sub-score).
- ARV discount +12.6/15.0
- Cash flow +8.2/30.0
- Schools +3.9/10.0
- Livability +3.6/5.0
- 1% rule +2.9/10.0
- Rent growth +2.5/5.0
- Condition / age +2.5/5.0
- DSCR +2.2/10.0
- Appreciation +0.0/10.0
$215,000
🖨 Deal sheet 📄 Offer letter ✓ Due diligence
Listing remarks
Three bedroom two bath home with available in Troy TX. Conveniently located close to Temple, Belton and Waco. Less than an hour from Austin. Open floor plan, granite countertops and only three years old!
Key facts
- 5,750 sq ft lot
- 2 garage spots
- Built 2023
Property features AI
Finance
- Other: Directions: I-35 to Goates; Goates to Chambray; property on the left; County: Bell; Country: United States; High geocode confidence
- HOA & community: Mandatory association; HOA fee $240 annually; Association fee includes full use of facilities; HOA managed by Colby Property Mgmt
Exterior
- Parking: Attached 2-car garage; 2 covered parking spaces; 2-car carport; Garage has a door opener and faces the front
- Utilities: City water; City sewer; Located in a municipal utility district
- Home design: Single-family residence; One-story; Property attached: Yes
- Construction: Built in 2023; Preowned condition
- Exterior features: Less than 0.5-acre lot; Located in the Cottonwood Creek Phase I subdivision
Interior
- Kitchen: Dishwasher; Electric oven; Microwave; Electric water heater
- Bedrooms: 3 bedrooms (all on the main level)
- Bathrooms: 2 bathrooms
- Heating & cooling: Central heating (electric); Central air conditioning (electric)
- Interior features: Granite counters; Kitchen island; Open floorplan; Pantry
- Laundry & utility: Electric water heater
Neighborhood map
What this means for you Summary
Snapshot
- This is a 3-bed/2.0-bath single-family listed at $215k.
Deal economics
- At list price, monthly cash flow is $-205 ($-2k/yr) — negative.
- To cash-flow at today's rent, offer at most $179k (16.8% below list).
- To meet the 1% rule (rent ≥ 1% of price), the offer needs to be $169k (21.4% below list).
- Recommended offer: $169k (21.4% below list) — sets the bar for 1% rule.
- Cap rate 5.2% vs local median 4.1% in Troy — meaningfully above typical; check what's discounted (condition, days-on-market, listing class) to confirm the premium yield is real.
Location & tenants
- Location reads 71/100 on livability (#307 in TX) — a middle-class / working-renter tenant base. Strengths: crime A+, cost of living A+, housing A+; Watch: employment C-, amenities F, commute F.
- Troy ISD (rural): math 44% / reading 44% proficiency, ranked #257 of 826 in TX (top 31%) — families likely to look elsewhere, expect single-tenant / working-renter base with shorter leases.
- Zoned schools: Troy El (math 46% / reading 42%, grade F, #1,243 of 4,322 statewide, top 29%, 399 students, 61% FRL) — zoned schools average 61% FRL vs 41% district-wide (20 pts higher); higher-poverty schools than district average — tighter screening recommended.
- Market conditions: 143 active listings in the ZIP; 12 comparable units currently listed for rent nearby; rentals at typical pace (median 21d on market — plan ~3-4 weeks tenant-placement turnaround); solid renter incomes; 3,222 units permitted in Bell County in 2024 (246 in 5+ unit buildings).
Forward outlook
- Local home prices are declining (-3.0%/yr); year-one equity from $1k of loan paydown is wiped out by about $6k of value loss. Plan a longer hold.
- Bell County population projected at +21% by 2050 — long-run rental-demand tailwind backs the buy-and-hold thesis.
Negotiation context
- It's been on market 45 days — a 3% lower offer ($209k) is reasonable based on typical stale-listing flexibility.
- 3 sale attempts with the ask held roughly flat each time — persistent listings suggest the price (not the market) is what's stuck; bring a comps-based counter.
Risks & watch-outs
- Climate carrying-cost: severe wind risk, 80% chance of damaging wind over 30y; moderate wildfire risk; extreme-heat days projected 7→24/yr by 2055 (HVAC capex compounding) — expect insurance premiums to compound above CPI over the hold.
Questions for the listing agent
- What do current leases actually rent for vs. the listed asking? Can we see a recent rent roll and the last 12 months of T-12 income?
- It's been on market 45 days. Have you received any prior offers? Is the seller open to a 21% concession, seller financing, or rate buy-down credit?
- What does the HOA fee cover, when was the last increase, and are there any pending special assessments or reserve-fund shortfalls?
- Is there a deadline driving the sale (1031 exchange, divorce, estate, relocation)? That informs how much negotiation room exists.
- The area grade is low — what's the realistic commute time and amenity access for the typical tenant pool here? Any planned neighborhood developments (good or bad) we should know about?
- What's the average days-on-market for RENTAL listings here right now (not sales)? A rising rental-DOM trend means longer vacancies and softer asking-rent achievability than the comps imply.
- What's the recent tenant-quality profile in this submarket — average credit score on applications, eviction rate, late-payment / NSF rate, and stable-employment percentage? A property-management company in the area should have these aggregated.
- How much new for-sale + rental construction is in the pipeline within 1–3 miles? Heavy new supply typically softens prices + rents 12–24 months out; constrained supply supports both.
Investment metrics
- 1% rule
- 0.79% ✗
- Cap rate
- 5.15%
- Cash-on-cash
- -4.08%
- DSCR
- 0.82
- GRM
- 10.6
CMA / ARV
- ARV (median comp)
- $242,377
- List price
- $215,000
- Delta
- -11.30%
- Verdict
- UNDERPRICED
- Comps
- 20 within 1.0 mi
Show comp detail 8 sales within ~0.75 mi
| Address | Dist | Beds/Ba | Sqft | Sold | Price | $/sf | Match |
|---|---|---|---|---|---|---|---|
| 1012 Chambray Dr | 0.02mi | 3/2.0 | 1,257 (-1%) | 4mo | $213,000 | $169 | 95 |
| 1037 Oxford Ln | 0.20mi | 3/2.0 | 1,400 (+10%) | 8mo | $219,000 | $156 | 67 |
| 485 Poplin Ln | 0.24mi | 3/2.0 | 1,375 (+8%) | 16mo | $265,000 | $193 | 61 |
| 605 Aikman Dr | 0.52mi | 3/2.0 | 1,152 (-9%) | 3mo | $195,000 | $169 | 58 |
| 409 Blayton St | 0.74mi | 3/2.0 | 1,410 (+11%) | 3mo | $236,000 | $167 | 44 |
| 636 Oxford Ln | 0.17mi | 3/21.0 | 1,413 (+11%) | 12mo | $243,500 | $172 | 43 |
| 117 University Ave | 0.73mi | 3/2.0 | 1,354 (+7%) | 23mo | $244,900 | $181 | 35 |
| 113 University Ave | 0.73mi | 3/2.0 | 1,447 (+14%) | 24mo | $249,900 | $173 | 22 |
Match score weights: distance 35% · size 25% · config 20% · recency 20%. Top-matched comps best support the ARV.
Projected returns pro-forma
-3.0% appreciation · 3.0% rent growth · sell at horizon
- IRR
- -23.1%
- Equity multiple
- 0.21×
- Total profit
- $-47,817
- Equity at exit
- $32,057
- IRR
- -17.6%
- Equity multiple
- 0.03×
- Total profit
- $-58,186
- Equity at exit
- $18,589
Cash invested: $60,200 (down + closing). Projections, not guarantees.
Landlord ↔ Tenant lean methodology
- Overall (STATE)
- 87 Strongly Landlord-Friendly
- State Texas
- 87 Strongly Landlord-Friendly · R+5
- County
- — inherits STATE
- City
- — inherits STATE
ZIP-level market 76579
- Home prices YoY
- -25.8%
- Active inventory
- 143
- Price-to-rent
- 10.6×
Monthly cashflow live
- Estimated rent
- $1,691 high interval (Pro) →
- Mortgage (P&I)
- −$1,127
- Tax from tax record
- −$303 /mo · $3,641/yr
- Insurance
- −$90
- HOA
- −$20
- Vacancy / Maint / Mgmt
- −$355
- Net cashflow
- $-205
Break-even live
UW: 25.0% down · 7.5% · 30yr · 1.5% tax · 5.0% vac · 8.0% maint · 8.0% mgmt
Financing live
Cash to close
- Down payment
- $53,750
- Closing costs
- $6,450
- Reserves months
- —
- Total cash needed
- —
Loan-product check · same deal, 3 products live
Conventional
25% down · 7.5% · 30yr
- Down + closing
- —
- Monthly P&I
- —
- Monthly cashflow
- —
- DSCR
- —
- Eligible?
- —
Personal DTI + credit; lowest rate.
DSCR
20% down · 8.5% · 30yr
- Down + closing
- —
- Monthly P&I
- —
- Monthly cashflow
- —
- DSCR
- —
- Eligible?
- —
No personal income docs; deal must DSCR.
Hard money
10% down · 12.0% · 12mo
- Down + closing
- —
- Monthly P&I
- —
- Monthly cashflow
- —
- DSCR
- —
- Eligible?
- —
Short-term bridge; refi at stabilization.
Rent comps 12 comps
| Address | Beds | Baths | Sqft | Rent | $/sqft | DOM | Units | Dist |
|---|---|---|---|---|---|---|---|---|
| 600 Goates Rd Troy, TX | 4.0 | 2.0 | 1534 | $1,765 | $1.15 | 44d | 1 | 0.04mi |
| 206 Juniper Dr Troy, TX | 3.0 | 2.0 | 1332 | $1,395 | $1.05 | 21d | 1 | 0.38mi |
| 205 Juniper Dr Troy, TX | 3.0 | 2.0 | 1234 | $1,395 | $1.13 | 21d | 1 | 0.39mi |
| 204b Juniper Dr Troy, TX | 3.0 | 2.0 | 1332 | $1,395 | $1.05 | 13d | 1 | 0.40mi |
| 203 Juniper Dr Troy, TX | 3.0 | 2.0 | 1234 | $1,395 | $1.13 | 14d | 1 | 0.41mi |
| 206 Sparrow Cv Troy, TX | 3.0 | 2.0 | 1332 | $1,395 | $1.05 | 13d | 1 | 0.42mi |
| 1104 Leah Dr Unit A Troy, TX | 3.0 | 2.0 | 1295 | $1,695 | $1.31 | 13d | 1 | 0.61mi |
| 1005 Leah Dr Unit B Troy, TX | 3.0 | 2.0 | 1292 | $1,400 | $1.08 | 21d | 1 | 0.67mi |
| 408 Kylar St Troy, TX | 3.0 | 2.0 | 1649 | $1,795 | $1.09 | 44d | 1 | 0.73mi |
| 522 Campus St Troy, TX | 3.0 | 2.0 | 1205 | $1,525 | $1.27 | 44d | 1 | 0.94mi |
| 618 Campus St Unit 1 Troy, TX | 3.0 | 2.0 | 1174 | $1,500 | $1.28 | 13d | 1 | 0.99mi |
| 17307 Old TX 81 Unit C Troy, TX | 2.0 | 2.0 | 1000 | $1,295 | $1.29 | 14d | 1 | 1.16mi |
HOA detail
- Monthly dues
- $20 · $240/yr
Listing history 20 events
-
2026-06-18days on market $215,000 Active 45 DOM
-
2026-06-17days on market $215,000 Active 44 DOM
-
2026-06-16days on market $215,000 Active 43 DOM
-
2026-06-15days on market $215,000 Active 42 DOM
-
2026-06-14days on market $215,000 Active 40 DOM
-
2026-06-10days on market $215,000 Active 37 DOM
-
2026-06-09days on market $215,000 Active 36 DOM
-
2026-06-08days on market $215,000 Active 35 DOM
-
2026-06-07days on market $215,000 Active 34 DOM
-
2026-06-05days on market $215,000 Active 31 DOM
-
2026-06-03days on market $215,000 Active 30 DOM
-
2026-06-02days on market $215,000 Active 29 DOM
-
2026-06-01days on market $215,000 Active 28 DOM
-
2026-05-31days on market $215,000 Active 27 DOM
-
2026-05-30days on market $215,000 Active 26 DOM
-
2026-05-04historical
-
2026-05-04$215,000 Active 203-char remark
-
2026-03-13$225,000 Active
-
2025-12-10historical
-
2025-06-27$239,900 Active
ⓘ Source: listings_history table (triggers on properties + properties_extension) + one-shot
backfill from property_details.listing_events for pre-trigger history.
Tax reassessment forecast TX · Resets to sale price
- Current annual tax
- $3,641 · $303/mo
- Projected year-2 tax
- $3,934 · $328/mo
- Expected delta
- +$294/yr (+$24/mo · 8.1%)
ⓘ Screening estimate from a state-policy table — verify with the county assessor before closing.
Climate risk First Street
- Flood 1/10 Low FEMA zone X (unshaded) · 0% chance over 30 yrs
- Wildfire 5/10 Major
- Heat 7/10 Severe 7 d/yr ≥107°F today · 24 d/yr by 30 yrs out
- Wind 8/10 Severe 80% chance of damaging wind over 30 yrs
- Air quality 2/10 Low 0 unhealthy d/yr today · 1 by 30 yrs out
Nearby sold comps map
Loading sold comps map…
Walkable amenities ~0.75 mi
Loading nearby amenities…
Taxation est. · year 1
- Rental income
- $20,290
- − Mortgage interest
- −$12,043
- − Property taxes
- −$3,641
- − Insurance
- −$1,075
- − Repairs & maintenance
- −$1,623
- − Management
- −$1,623
- − HOA
- −$240
- − Depreciation
- −$6,255
- Taxable loss
- −$6,210
- Est. tax savings @ 24.0%
- +$1,490
- After-tax cash flow
- $-966/yr
For passive investors: Depreciation is non-cash, so a rental often shows a tax loss while cash-flowing — sheltering income. Rental losses are passive: they offset passive income freely, and up to $25,000/yr can offset ordinary (W-2) income if you actively participate and your MAGI is under $100k (phasing out to $0 by $150k); unused losses carry forward. On sale, claimed depreciation is recaptured at up to 25%, and gains may owe capital-gains tax (a 1031 exchange can defer both). Figures are a year-1 estimate at your 24.0% rate — not tax advice; consult a CPA.
Schools (NCES district)
- District
- Troy ISD
- NCES district ID
- 4843260
- Math proficiency
- 44% ▼ -11.00%
- Reading proficiency
- 44% ▼ -2.00%
- Median HH income
- $60,586
- Composite
- 38.83/100
- National rank
- #4110
- State rank
- #257 of 826 in TX
Livability — Troy
- Score
- 71/100
- State rank
- #307
- US rank
- #6921
Category grades
Schools grade is shown separately in the Schools card above.
Census & demographics
- Census place
- Troy, TX
- County
- Bell County · 345,090 people
- City population
- 5,448
- Metro
- Killeen-Temple, TX
- Population (ZIP)
- 5,448
- Household income
- $85,480
- Rent vs Own
- Severe rent burden
- 210.0
Population outlook (Bell County) Hauer SSP2
- Today (2025)
- 371,114 people
- By 2030
- 389,104 · +4.8%
- By 2040
- 420,592 · +13.3%
- By 2050
- 447,779 · +20.7%
- By 2075
- 499,130 · +34.5%
- By 2100
- 505,680 · +36.3%
Race, ethnicity, and origin ACS 2023
- Neighborhood character
- Predominantly White (67%)
- Race & ethnicity
- White 67% Hispanic / Latino 22% Two or more races 19% Black 2%
- Hispanic origin (detail)
- Mexican 20%
- Common ancestry
- Italian 6% Lithuanian 4% Slovak 1%
- Foreign-born
- 5% · Canada
- Languages at home
- 91% English-only · Spanish 9%
Political lean MEDSL · Bell
- 2024 margin
- R (+16.2) · D 41.3% · R 57.6% · Other 1.1%
- 2008→2024 swing
- -6.5pp toward R · 2008: -9.8pp · 2024: -16.2pp
- All cycles
- 2024: R+16.2 2020: R+8.5 2016: R+15.1 2012: R+16.4 2008: R+9.8
Not yet ingested
- Civics
- —
Market trends
- HPI YoY
- ▼ -64.05%
- Current HPI
- 183.9791
- Rent YoY
- —
- Metro
- Killeen-Temple, TX
- State GDP YoY
- ▲ 3.95%
- F500 in state
- 110
Industry mix (Fortune 500 HQ in TX)
| Industry | F500 HQs | Revenue |
|---|---|---|
| Energy | 16 | $1,198B |
|
||
| Technology | 5 | $198B |
|
||
| Engineering / Construction | 4 | $72B |
|
||
| Energy Services | 3 | $60B |
|
||
| Utilities | 3 | $41B |
|
||
| Healthcare | 2 | $330B |
|
||
Price history
-10.4% since first listed5 events — show timeline
- 2026-05-04 Listed $215,000 NTREIS
- 2026-05-04 Listing Removed — CTXMLS
- 2026-03-13 Listed $225,000 CTXMLS
- 2025-12-10 Listing Removed — CTXMLS
- 2025-06-27 Listed $239,900 CTXMLS
Property tax history
+131.4%/yrLatest (2026): $3,641 · -0.4% YoY. Source: county tax records.
Cash-flow waterfall
monthlySold comps — $/sqft
last 12 mo · ≤1 miLoading sold comps…