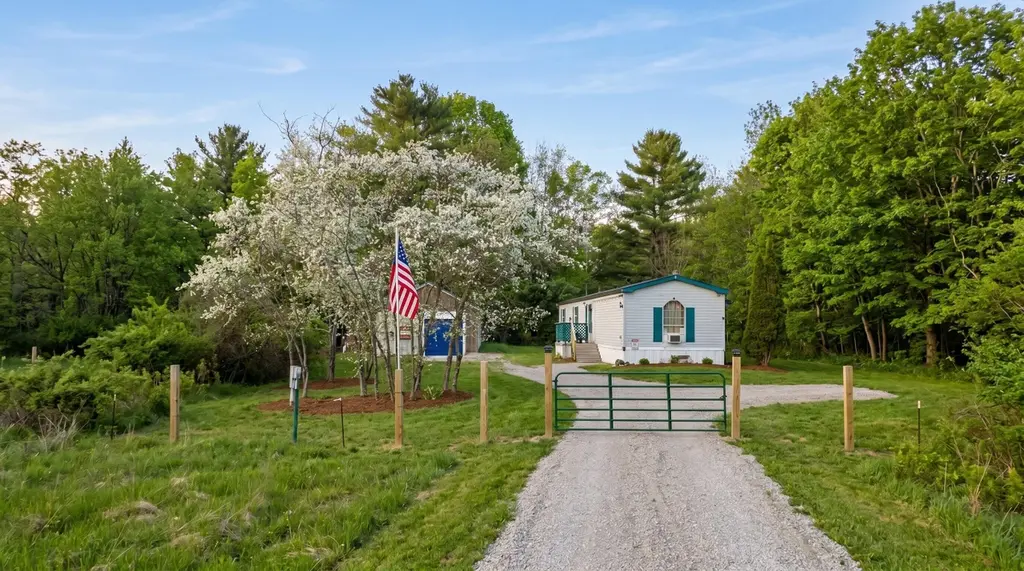
153 Collins Rd · Chelsea, ME
Flood risk 1/10 · Minimal
- FEMA flood zone
- X (unshaded)
- Chance of flooding over 30 yrs
- 0.0%
- Est. flood insurance / yr
- $507 – $1,088
Fire risk 3/10 · Minor
- Est. fire insurance / yr
- $669 – $1,243
Heat risk 3/10 · Minor
- Hot days now (above 91°F)
- 7 days/yr
- Hot days in 30 yrs
- 16 days/yr
Wind risk 4/10 · Minor
- Chance of severe wind over 30 yrs
- 15.0%
Air-quality risk 2/10 · Minimal
- Unhealthy air days now
- 1 days/yr
- Unhealthy air days in 30 yrs
- 1 days/yr
Risk factors via First Street. Map © Google.
Why this score? — see what drove the B- grade
The composite is a weighted blend of 9 inputs, each scored 0–100. Each bar is that input's sub-score; the figure is the points it added to the 100-point composite (weight × sub-score).
- Cash flow +22.6/30.0
- ARV discount +15.0/15.0
- DSCR +7.3/10.0
- Schools +7.3/10.0
- 1% rule +5.2/10.0
- Rent growth +3.8/5.0
- Livability +2.5/5.0
- Condition / age +2.5/5.0
- Appreciation +0.0/10.0
$193,500
🖨 Deal sheet (PDF) 📄 Offer letter ✓ Due diligence
Listing remarks
Escape to your own private slice of Maine paradise at 153 Collins Road in Chelsea. Nestled on a sprawling, private 3.3-acre lot, this property offers the perfect blend of country freedom and comfortable, modern living. Step inside to find a beautifully updated three-bedroom, one-bath home featuring a bright and inviting open floor plan designed for effortless daily living and entertaining. While the interior updates and cozy charm will instantly make you feel at home, the outdoor features truly set this property apart. Mechanics, hobbyists, and outdoor enthusiasts will fall in love with the spacious two-car garage, providing ample room for vehicles, gear, and workshop space. Whether you are
Key facts
- 3.3 acre lot
- 2 garage spots
- Built 1991
Tags
Property features AI
Finance
- Financial info: Residential zoning; Lot size approximately 3.3 acres
Exterior
- Parking: Detached garage for 2 cars; Gravel and off-street parking
- Utilities: Private water; Private sewer; Utilities currently off
- Home design: Mobile home (single wide); Built in 1991
- Construction: Steel frame with vinyl siding; Shingle roof; 1,100 total building area
- Exterior features: Rural setting; Paved road access
Interior
- Flooring: Carpet; Vinyl
- Bathrooms: One full bathroom
- Heating & cooling: Forced air heating; Electric water heater; Circuit breaker electrical panel
- Interior features: Five total rooms; Carpet and vinyl flooring; One fireplace
Neighborhood map
What this means for you Summary
Snapshot
- This is a 3-bed/1.0-bath manufactured listed at $194k.
Deal economics
- At list price, monthly cash flow is $330 ($4k/yr) — positive.
- The deal already cash-flows at list — no discount required.
- Meets the 1% rule at list price ($2k rent vs $194k).
- Recommended offer: $191k (1.5% below list) — sets the bar for market timing.
Location & tenants
- Location reads: area grade B — affects rentability + tenant quality, not the cash-flow math above.
- RSU 12 (rural): math 86% / reading 86% proficiency, ranked #50 of 112 in ME (top 45%) — strong family-tenant draw, lease renewals of 3-5y typical.
- Market conditions: Rents rising fast (+5.3%/yr); 54 active listings in the ZIP; 460 units permitted in Kennebec County in 2024 (0 in 5+ unit buildings).
- This rent runs 43% of the median local income ($55k/yr) — at the standard rent-burdened threshold; future hikes will face affordability resistance.
Forward outlook
- Local home prices are declining (-3.0%/yr); year-one equity from $1k of loan paydown is wiped out by about $6k of value loss. Plan a longer hold.
- Kennebec County population projected at -17% by 2050 — secular population decline; favor cash flow + early exit over multi-decade hold.
- At projected returns (-3.0% appreciation + 5.3% rent growth), your $54k cash investment doubles in ~10 years — after that, you're playing with house money.
Negotiation context
- It's been on market 16 days — a 2% lower offer ($191k) is reasonable based on typical stale-listing flexibility.
- 3 sale attempts since 17y ago with the ask held roughly flat each time — persistent listings suggest the price (not the market) is what's stuck; bring a comps-based counter.
Questions for the listing agent
- Is there a deadline driving the sale (1031 exchange, divorce, estate, relocation)? That informs how much negotiation room exists.
- What's the average days-on-market for RENTAL listings here right now (not sales)? A rising rental-DOM trend means longer vacancies and softer asking-rent achievability than the comps imply.
- What's the recent tenant-quality profile in this submarket — average credit score on applications, eviction rate, late-payment / NSF rate, and stable-employment percentage? A property-management company in the area should have these aggregated.
- How much new for-sale + rental construction is in the pipeline within 1–3 miles? Heavy new supply typically softens prices + rents 12–24 months out; constrained supply supports both.
Investment metrics
- 1% rule
- 1.02% ✓
- Cap rate
- 8.34%
- Cash-on-cash
- 7.32%
- DSCR
- 1.33
- GRM
- 8.2
CMA / ARV
- ARV (on-the-fly)
- $242,000
- Comps found
- 2
Show comp detail 2 sales within ~0.75 mi
| Address | Dist | Beds/Ba | Sqft | Sold | Price | $/sf | Match |
|---|---|---|---|---|---|---|---|
| 6 Forest Ln | 0.55mi | 3/2.0 | 1,216 (+10%) | 7mo | $225,500 | $185 | 47 |
| 165 Togus Rd | 0.63mi | 3/2.0 | 1,248 (+14%) | 1mo | $275,000 | $220 | 43 |
Match score weights: distance 35% · size 25% · config 20% · recency 20%. Top-matched comps best support the ARV.
Projected returns pro-forma
-3.0% appreciation · 5.35% rent growth · sell at horizon
- IRR
- -2.7%
- Equity multiple
- 0.90×
- Total profit
- $-5,582
- Equity at exit
- $28,851
- IRR
- 9.3%
- Equity multiple
- 1.79×
- Total profit
- $42,614
- Equity at exit
- $16,730
Cash invested: $54,180 (down + closing). Projections, not guarantees.
Landlord ↔ Tenant lean methodology
- Overall (STATE)
- 41 Moderately Tenant-Leaning
- State Maine
- 41 Moderately Tenant-Leaning · D+2
- County
- — inherits STATE
- City
- — inherits STATE
ZIP-level market 04330
- Home prices YoY
- -4.7%
- Rents YoY
- 5.3%
- Active inventory
- 54
- Price-to-rent
- 8.2×
Monthly cashflow live
- Estimated rent
- $1,971 medium interval (Pro) →
- Mortgage (P&I)
- −$1,015
- Tax from tax record
- −$131 /mo · $1,575/yr
- Insurance
- −$81
- HOA
- −$0
- Vacancy / Maint / Mgmt
- −$414
- Net cashflow
- $330
Break-even live
Sensitivity live
| Price | -10% $440 | -5% $385 | +0% $330 | +5% $276 | +10% $221 |
|---|---|---|---|---|---|
| Rent | -10% $175 | -5% $253 | +0% $330 | +5% $408 | +10% $486 |
| Rate | -1.0pp $428 | -0.5pp $380 | base $330 | +0.5pp $280 | +1.0pp $229 |
UW: 25.0% down · 7.5% · 30yr · 1.5% tax · 5.0% vac · 8.0% maint · 8.0% mgmt
Financing live
Cash to close
- Down payment
- $48,375
- Closing costs
- $5,805
- Reserves months
- —
- Total cash needed
- —
Loan-product check · same deal, 3 products live
Conventional
25% down · 7.5% · 30yr
- Down + closing
- —
- Monthly P&I
- —
- Monthly cashflow
- —
- DSCR
- —
- Eligible?
- —
Personal DTI + credit; lowest rate.
DSCR
20% down · 8.5% · 30yr
- Down + closing
- —
- Monthly P&I
- —
- Monthly cashflow
- —
- DSCR
- —
- Eligible?
- —
No personal income docs; deal must DSCR.
Hard money
10% down · 12.0% · 12mo
- Down + closing
- —
- Monthly P&I
- —
- Monthly cashflow
- —
- DSCR
- —
- Eligible?
- —
Short-term bridge; refi at stabilization.
Listing history 12 events
-
2026-06-21days on market $193,500 Active 16 DOM
-
2026-06-19days on market $193,500 Active 14 DOM
-
2026-06-18days on market $193,500 Active 13 DOM
-
2026-06-17days on market $193,500 Active 12 DOM
-
2026-06-16days on market $193,500 Active 11 DOM
-
2026-06-15days on market $193,500 Active 10 DOM
-
2026-06-14days on market $193,500 Active 8 DOM
-
2026-06-12days on market $193,500 Active 7 DOM
-
2026-06-09days on market $193,500 Active 4 DOM
-
2026-06-08days on market $193,500 Active 3 DOM
-
2026-06-07remarks 699-char remark
-
2026-06-07$193,500 Active 2 DOM
ⓘ Source: listings_history table (triggers on properties + properties_extension) + one-shot
backfill from property_details.listing_events for pre-trigger history.
Tax reassessment forecast ME · Partial reset (capped growth)
- Current annual tax
- $1,575 · $131/mo
- Projected year-2 tax
- $2,103 · $175/mo
- Expected delta
- +$528/yr (+$44/mo · 33.5%)
ⓘ Screening estimate from a state-policy table — verify with the county assessor before closing.
Climate risk First Street
- Flood 1/10 Low FEMA zone X (unshaded) · 0% chance over 30 yrs
- Wildfire 3/10 Moderate
- Heat 3/10 Moderate 7 d/yr ≥91°F today · 16 d/yr by 30 yrs out
- Wind 4/10 Moderate 15% chance of damaging wind over 30 yrs
- Air quality 2/10 Low 1 unhealthy d/yr today · 1 by 30 yrs out
Nearby sold comps map
Loading sold comps map…
Walkable amenities ~0.75 mi
Loading nearby amenities…
Taxation est. · year 1
- Rental income
- $23,650
- − Mortgage interest
- −$10,839
- − Property taxes
- −$1,575
- − Insurance
- −$968
- − Repairs & maintenance
- −$1,892
- − Management
- −$1,892
- − Depreciation
- −$5,629
- Taxable income
- $856
- Est. tax owed @ 24.0%
- −$205
- After-tax cash flow
- $3,759/yr
For passive investors: Depreciation is non-cash, so a rental often shows a tax loss while cash-flowing — sheltering income. Rental losses are passive: they offset passive income freely, and up to $25,000/yr can offset ordinary (W-2) income if you actively participate and your MAGI is under $100k (phasing out to $0 by $150k); unused losses carry forward. On sale, claimed depreciation is recaptured at up to 25%, and gains may owe capital-gains tax (a 1031 exchange can defer both). Figures are a year-1 estimate at your 24.0% rate — not tax advice; consult a CPA.
Schools (NCES district)
- District
- RSU 12
- NCES district ID
- 2314780
- Math proficiency
- 86% ▲ 58.00%
- Reading proficiency
- 86% ▲ 35.00%
- Median HH income
- $49,792
- Composite
- 72.62/100
- National rank
- #197
- State rank
- #50 of 112 in ME
Livability — Chelsea
No livability data for this city. (Only ~50 U.S. cities are tracked.)
Census & demographics
- County
- Kennebec County · 54,560 people
- Metro
- Augusta-Waterville, ME
- Population (ZIP)
- 26,690
- Household income
- $54,775
- Rent vs Own
- Severe rent burden
- 760.0
Population outlook (Kennebec County) Hauer SSP2
- Today (2025)
- 115,421 people
- By 2030
- 111,852 · -3.1%
- By 2040
- 103,757 · -10.1%
- By 2050
- 95,710 · -17.1%
- By 2075
- 78,172 · -32.3%
- By 2100
- 59,500 · -48.4%
Race, ethnicity, and origin ACS 2023
- Neighborhood character
- Predominantly White (91%)
- Race & ethnicity
- White 91% Two or more races 4% Hispanic / Latino 2% Black 1% Asian 1%
- Common ancestry
- Lithuanian 18% Slovak 4% Romanian 3%
- Foreign-born
- 3% · Canada
- Languages at home
- 93% English-only · French/Haitian/Cajun 4% Spanish 1%
Political lean MEDSL · Kennebec
- 2024 margin
- Toss-up / Even · D 47.5% · R 50.2% · Other 2.4%
- 2008→2024 swing
- -17.5pp toward R · 2008: 14.8pp · 2024: -2.8pp
- All cycles
- 2024: R+2.8 2020: D+0.2 2016: R+3.7 2012: D+13.5 2008: D+14.8
Not yet ingested
- Civics
- —
Market trends
- HPI YoY
- ▼ -17.46%
- Current HPI
- 353.9463
- Rent YoY
- ▲ 5.35%
- Metro
- Augusta-Waterville, ME
- State GDP YoY
- —
- F500 in state
- 0
Price history
+158.7% since first listed3 events — show timeline
- 2026-06-05 Listed $193,500 MREIS
- 2010-07-16 Listed $69,900 MREIS
- 2009-11-27 Listed $74,793 MREIS
Property tax history
+2.2%/yrLatest (2024): $1,575 · +7.0% YoY. Source: county tax records.
Cash-flow waterfall
monthlySold comps — $/sqft
last 12 mo · ≤1 miLoading sold comps…