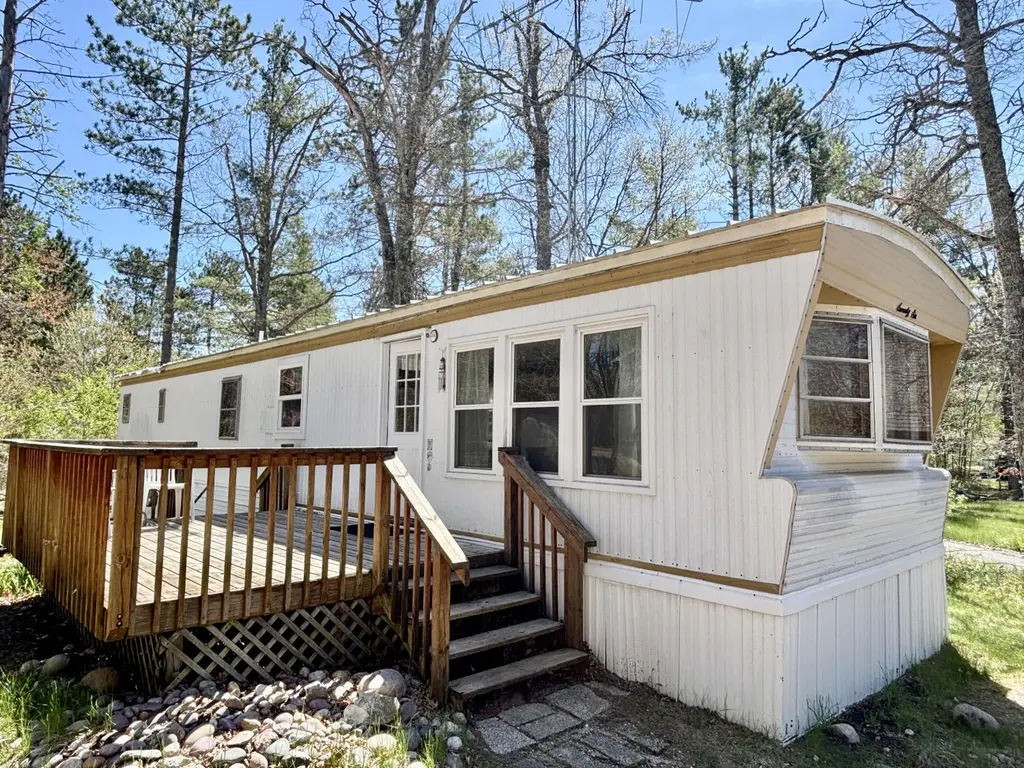
5376 Spruce Dr · Lewiston, MI
Flood risk 1/10 · Minimal
- FEMA flood zone
- —
- Chance of flooding over 30 yrs
- 0.0%
- Est. flood insurance / yr
- —
Fire risk 4/10 · Minor
- Est. fire insurance / yr
- $784 – $1,456
Heat risk 1/10 · Minimal
- Hot days now (above 93°F)
- 7 days/yr
- Hot days in 30 yrs
- 13 days/yr
Wind risk 1/10 · Minimal
- Chance of severe wind over 30 yrs
- —
Air-quality risk 1/10 · Minimal
- Unhealthy air days now
- 0 days/yr
- Unhealthy air days in 30 yrs
- 0 days/yr
Risk factors via First Street. Map © Google.
Why this score? — see what drove the B- grade
The composite is a weighted blend of 9 inputs, each scored 0–100. Each bar is that input's sub-score; the figure is the points it added to the 100-point composite (weight × sub-score).
- Cash flow +30.0/30.0
- 1% rule +10.0/10.0
- DSCR +10.0/10.0
- ARV discount +8.0/15.0
- Livability +3.2/5.0
- Schools +3.1/10.0
- Rent growth +2.5/5.0
- Condition / age +2.5/5.0
- Appreciation +0.0/10.0
$44,900
🖨 Deal sheet (PDF) 📄 Offer letter ✓ Due diligence
Listing remarks MLS
Immaculate and updated Mobile Home in Moon Lake! Own a piece of up north for little money! This property affords you all of the luxuries associated with Moon Lake, ie. Clubhouse, lake access, in ground pool, etc. Large shed to store your Recreational toys! Mobile has many updates, including furnace! SELLER WILL CONSIDER ALL SERIOUS OFFERS! Call for a showing today!
Key facts
- Shed for storage
- New pex installed
- Large back bedroom
Tags
Property features AI
Finance
- HOA & community: Homeowners association with an annual fee of $75 (about $6.25/month)
Exterior
- Utilities: Well water; Septic tank
- Home design: Single-family residence; Residential property
- Exterior features: Deck; Shed(s); On waterfront (Moon Lake); Paved road access; Lot dimensions approximately 65 x 200
Interior
- Kitchen: Dishwasher; Microwave; Refrigerator; Oven; Range
- Flooring: Simulated wood flooring
- Bathrooms: 1 full bathroom
- Heating & cooling: Forced air heating; Natural gas
- Interior features: Dishwasher; Dryer; Microwave; Refrigerator; Washer; Oven; Range
- Laundry & utility: Main level laundry; Washer; Dryer
Neighborhood map
What this means for you Summary
Snapshot
- This is a 2-bed/1.0-bath single-family listed at $45k.
Deal economics
- At list price, monthly cash flow is $394 ($5k/yr) — positive.
- The deal already cash-flows at list — no discount required.
- Meets the 1% rule at list price ($858 rent vs $45k).
- Cap rate 16.8% vs local median 3.7% in Lewiston — top-decile yield for the area; either an underpriced asset or a hidden risk that comps aren't pricing in. Stress-test before assuming the spread holds.
Location & tenants
- Location reads 65/100 on livability (#479 in MI) — a middle-class / working-renter tenant base. Strengths: cost of living A+, housing A+; Watch: crime D, amenities F, commute F.
- Johannesburg-Lewiston Area Schools (rural): math 33% / reading 42% proficiency, ranked #257 of 540 in MI (top 48%) — families likely to look elsewhere, expect single-tenant / working-renter base with shorter leases.
- Zoned schools: Lewiston Elementary School (math 15% / reading 24%, grade F, #1,091 of 1,397 statewide, top 79%, 153 students, 76% FRL); Johannesburglewiston High School (math 34% / reading 54%, grade F, #214 of 713 statewide, top 36%, 218 students, 59% FRL) — zoned schools average 68% FRL vs 46% district-wide (21 pts higher); higher-poverty schools than district average — tighter screening recommended.
- Market conditions: 101 active listings in the ZIP; 29 units permitted in Oscoda County in 2024 (0 in 5+ unit buildings).
Forward outlook
- Local home prices are declining (-3.0%/yr); year-one equity from $310 of loan paydown is wiped out by about $1k of value loss. Plan a longer hold.
- Oscoda County population projected at -32% by 2050 — secular population decline; favor cash flow + early exit over multi-decade hold.
- At projected returns (-3.0% appreciation + 3.0% rent growth), your $13k cash investment doubles in ~4 years — after that, you're playing with house money.
Negotiation context
- Only 2 days on market — expect competitive offers; lowballing is unlikely to land.
- 2 sale attempts since 9y ago with the ask held roughly flat each time — persistent listings suggest the price (not the market) is what's stuck; bring a comps-based counter.
- Current owner paid $16k; list at $45k implies a 181% gain — meaningful room to come down on a strong offer.
Questions for the listing agent
- What does the HOA fee cover, when was the last increase, and are there any pending special assessments or reserve-fund shortfalls?
- Is there a deadline driving the sale (1031 exchange, divorce, estate, relocation)? That informs how much negotiation room exists.
- Schools are F-rated, which usually means shorter tenancies and higher turnover. Who's the typical renter profile here, and what's been the actual vacancy rate?
- Crime grade is D in this area — have there been break-ins, vandalism, or insurance claims at this property in the last 3 years? What carrier currently insures it and at what premium?
- What's the average days-on-market for RENTAL listings here right now (not sales)? A rising rental-DOM trend means longer vacancies and softer asking-rent achievability than the comps imply.
- What's the recent tenant-quality profile in this submarket — average credit score on applications, eviction rate, late-payment / NSF rate, and stable-employment percentage? A property-management company in the area should have these aggregated.
- How much new for-sale + rental construction is in the pipeline within 1–3 miles? Heavy new supply typically softens prices + rents 12–24 months out; constrained supply supports both.
Investment metrics
- 1% rule
- 1.91% ✓
- Cap rate
- 16.83%
- Cash-on-cash
- 37.64%
- DSCR
- 2.67
- GRM
- 4.4
CMA / ARV
- ARV (on-the-fly)
- $45,360
- Comps found
- 2
Show comp detail 2 sales within ~0.75 mi
| Address | Dist | Beds/Ba | Sqft | Sold | Price | $/sf | Match |
|---|---|---|---|---|---|---|---|
| 5376 Spruce Dr | 0.00mi | 2/1.0 | 720 (0%) | 0mo | $45,000 | $63 | 100 |
| 3395 Havenwood Dr | 0.45mi | 2/1.0 | 792 (+10%) | 15mo | $43,000 | $54 | 50 |
Match score weights: distance 35% · size 25% · config 20% · recency 20%. Top-matched comps best support the ARV.
Projected returns pro-forma
-3.0% appreciation · 3.0% rent growth · sell at horizon
- IRR
- 33.6%
- Equity multiple
- 2.42×
- Total profit
- $17,836
- Equity at exit
- $6,695
- IRR
- 40.5%
- Equity multiple
- 4.81×
- Total profit
- $47,856
- Equity at exit
- $3,882
Cash invested: $12,572 (down + closing). Projections, not guarantees.
Landlord ↔ Tenant lean methodology
- Overall (STATE)
- 62 Landlord-Friendly
- State Michigan
- 62 Landlord-Friendly · EVEN
- County
- — inherits STATE
- City
- — inherits STATE
ZIP-level market 49756
- Active inventory
- 101
- Price-to-rent
- 4.4×
Monthly cashflow live
- Estimated rent
- $858 medium interval (Pro) →
- Mortgage (P&I)
- −$235
- Tax from tax record
- −$23 /mo · $279/yr
- Insurance
- −$19
- HOA
- −$6
- Vacancy / Maint / Mgmt
- −$180
- Net cashflow
- $394
Break-even live
Sensitivity live
| Price | -10% $420 | -5% $407 | +0% $394 | +5% $382 | +10% $369 |
|---|---|---|---|---|---|
| Rent | -10% $327 | -5% $360 | +0% $394 | +5% $428 | +10% $462 |
| Rate | -1.0pp $417 | -0.5pp $406 | base $394 | +0.5pp $383 | +1.0pp $371 |
UW: 25.0% down · 7.5% · 30yr · 1.5% tax · 5.0% vac · 8.0% maint · 8.0% mgmt
Financing live
Cash to close
- Down payment
- $11,225
- Closing costs
- $1,347
- Reserves months
- —
- Total cash needed
- —
Loan-product check · same deal, 3 products live
Conventional
25% down · 7.5% · 30yr
- Down + closing
- —
- Monthly P&I
- —
- Monthly cashflow
- —
- DSCR
- —
- Eligible?
- —
Personal DTI + credit; lowest rate.
DSCR
20% down · 8.5% · 30yr
- Down + closing
- —
- Monthly P&I
- —
- Monthly cashflow
- —
- DSCR
- —
- Eligible?
- —
No personal income docs; deal must DSCR.
Hard money
10% down · 12.0% · 12mo
- Down + closing
- —
- Monthly P&I
- —
- Monthly cashflow
- —
- DSCR
- —
- Eligible?
- —
Short-term bridge; refi at stabilization.
HOA detail
- Monthly dues
- $6 · $72/yr
- Likely covers
- pool
Listing history 3 events
-
2026-05-20$44,900 Active
-
2017-10-13soldstatus $16,000 370-char remark
Show marketing remark (370 chars)
Immaculate and updated Mobile Home in Moon Lake! Own a piece of up north for little money! This property affords you all of the luxuries associated with Moon Lake, ie. Clubhouse, lake access, in ground pool, etc. Large shed to store your Recreational toys! Mobile has many updates, including furnace! SELLER WILL CONSIDER ALL SERIOUS OFFERS! Call for a showing today!
-
2017-03-10$17,900 370-char remark
Show marketing remark (370 chars)
Immaculate and updated Mobile Home in Moon Lake! Own a piece of up north for little money! This property affords you all of the luxuries associated with Moon Lake, ie. Clubhouse, lake access, in ground pool, etc. Large shed to store your Recreational toys! Mobile has many updates, including furnace! SELLER WILL CONSIDER ALL SERIOUS OFFERS! Call for a showing today!
ⓘ Source: listings_history table (triggers on properties + properties_extension) + one-shot
backfill from property_details.listing_events for pre-trigger history.
Tax reassessment forecast MI · Partial reset (capped growth)
- Current annual tax
- $279 · $23/mo
- Projected year-2 tax
- $485 · $40/mo
- Expected delta
- +$206/yr (+$17/mo · 74.1%)
ⓘ Screening estimate from a state-policy table — verify with the county assessor before closing.
Climate risk First Street
- Flood 1/10 Low 0% chance over 30 yrs
- Wildfire 4/10 Moderate
- Heat 1/10 Low 7 d/yr ≥93°F today · 13 d/yr by 30 yrs out
- Wind 1/10 Low
- Air quality 1/10 Low 0 unhealthy d/yr today · 0 by 30 yrs out
Nearby sold comps map
Loading sold comps map…
Walkable amenities ~0.75 mi
Loading nearby amenities…
Taxation est. · year 1
- Rental income
- $10,294
- − Mortgage interest
- −$2,515
- − Property taxes
- −$279
- − Insurance
- −$224
- − Repairs & maintenance
- −$824
- − Management
- −$824
- − HOA
- −$72
- − Depreciation
- −$1,306
- Taxable income
- $4,251
- Est. tax owed @ 24.0%
- −$1,020
- After-tax cash flow
- $3,712/yr
For passive investors: Depreciation is non-cash, so a rental often shows a tax loss while cash-flowing — sheltering income. Rental losses are passive: they offset passive income freely, and up to $25,000/yr can offset ordinary (W-2) income if you actively participate and your MAGI is under $100k (phasing out to $0 by $150k); unused losses carry forward. On sale, claimed depreciation is recaptured at up to 25%, and gains may owe capital-gains tax (a 1031 exchange can defer both). Figures are a year-1 estimate at your 24.0% rate — not tax advice; consult a CPA.
Schools (NCES district)
- District
- Johannesburg-Lewiston Area Schools
- NCES district ID
- 2619890
- Math proficiency
- 33% ▼ -6.00%
- Reading proficiency
- 42% ▼ -10.00%
- Median HH income
- $39,218
- Composite
- 31.36/100
- National rank
- #5995
- State rank
- #257 of 540 in MI
Livability — Lewiston
- Score
- 65/100
- State rank
- #479
- US rank
- #13556
Category grades
Schools grade is shown separately in the Schools card above.
Census & demographics
- Population (ZIP)
- 3,965
Population outlook (Oscoda County) Hauer SSP2
- Today (2025)
- 7,410 people
- By 2030
- 6,884 · -7.1%
- By 2040
- 5,853 · -21.0%
- By 2050
- 5,055 · -31.8%
- By 2075
- 3,832 · -48.3%
- By 2100
- 2,863 · -61.4%
Race, ethnicity, and origin ACS 2023
- Neighborhood character
- Predominantly White (93%)
- Race & ethnicity
- White 93% Two or more races 6%
- Common ancestry
- Romanian 14% Lithuanian 8% Iranian 2%
- Foreign-born
- 1% · Canada, China
- Languages at home
- 98% English-only · Spanish 1% French/Haitian/Cajun 1%
Political lean MEDSL · Oscoda
- 2024 margin
- Solid R (+44.3) · D 27.2% · R 71.6% · Other 1.2%
- 2008→2024 swing
- -34.3pp toward R · 2008: -10.0pp · 2024: -44.3pp
- All cycles
- 2024: R+44.3 2020: R+43.6 2016: R+44.3 2012: R+16.2 2008: R+10.0
Not yet ingested
- Civics
- —
Market trends
- HPI YoY
- ▼ -111.19%
- Current HPI
- 134.8693
- Rent YoY
- —
- Metro
- —
- State GDP YoY
- ▲ 1.37%
- F500 in state
- 28
Industry mix (Fortune 500 HQ in MI)
| Industry | F500 HQs | Revenue |
|---|---|---|
| Automotive Parts | 3 | $48B |
|
||
| Automotive | 2 | $372B |
|
||
| Chemicals | 1 | $45B |
|
||
| Automotive Retail | 1 | $29B |
|
||
| Healthcare / Medical Devices | 1 | $23B |
|
||
| Automotive Technology | 1 | $20B |
|
||
Price history
+150.8% since first listed3 events — show timeline
- 2026-05-20 Listed $44,900 WWMLS
- 2017-10-13 Sold (MLS) $16,000 WWMLS
- 2017-03-10 Listed $17,900 WWMLS
Property tax history
+1.6%/yrLatest (2025): $279 · -20.8% YoY. Source: county tax records.
Cash-flow waterfall
monthlySold comps — $/sqft
last 12 mo · ≤1 miLoading sold comps…