1661 Pyrenees Ave #70 · Stockton, CA
Flood risk 3/10 · Minor
- FEMA flood zone
- X
- Chance of flooding over 30 yrs
- 0.2%
- Est. flood insurance / yr
- $507 – $1,088
Fire risk 3/10 · Minor
- Est. fire insurance / yr
- $659 – $1,223
Heat risk 7/10 · Major
- Hot days now (above 102°F)
- 7 days/yr
- Hot days in 30 yrs
- 15 days/yr
Wind risk 1/10 · Minimal
- Chance of severe wind over 30 yrs
- —
Air-quality risk 10/10 · Severe
- Unhealthy air days now
- 30 days/yr
- Unhealthy air days in 30 yrs
- 30 days/yr
Risk factors via First Street. Map © Google.
Why this score? — see what drove the D grade
The composite is a weighted blend of 9 inputs, each scored 0–100. Each bar is that input's sub-score; the figure is the points it added to the 100-point composite (weight × sub-score).
- ARV discount +10.2/15.0
- Cash flow +9.3/30.0
- 1% rule +6.0/10.0
- Rent growth +4.3/5.0
- Livability +2.9/5.0
- Schools +2.7/10.0
- DSCR +2.6/10.0
- Condition / age +2.5/5.0
- Appreciation +0.0/10.0
$127,000
🖨 Deal sheet (PDF) 📄 Offer letter ✓ Due diligence
Listing remarks MLS
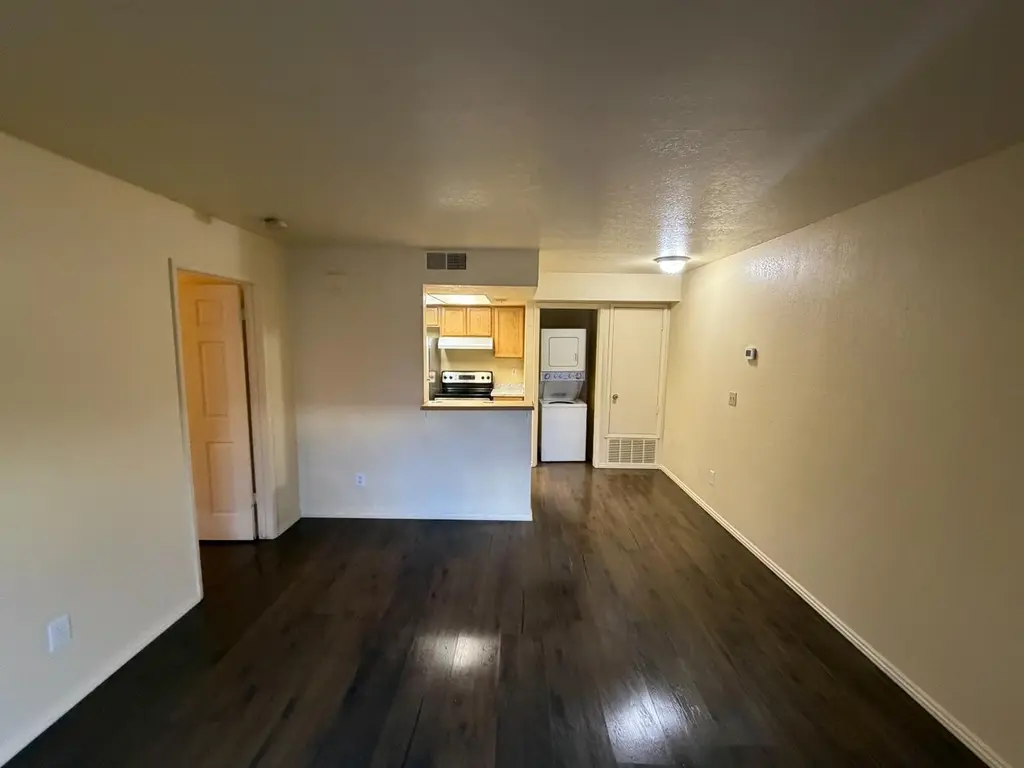
Painted interior, new carpet coming, vacant. Desirable gated CONDO community in Lodi school district, surrounded by waterfalls and trees w/ lots of amenities! Great for investors and 1st time buyers. No occupancy requirments for investors. Lower-level unit w/ washer & dryer hook-ups (must be stacked).
Key facts
- Durable floors
- Brand new dishwasher
- Swimming pool
Tags
Neighborhood map
What this means for you Summary
Snapshot
- This is a 1-bed/1.0-bath condo listed at $127k.
Deal economics
- At list price, monthly cash flow is $-93 ($-1k/yr) — negative.
- To cash-flow at today's rent, offer at most $110k (13.0% below list).
- Meets the 1% rule at list price ($1k rent vs $127k).
- Recommended offer: $110k (13.0% below list) — sets the bar for cash-flow.
- Cap rate 5.4% vs local median 3.6% in Stockton — top-decile yield for the area; either an underpriced asset or a hidden risk that comps aren't pricing in. Stress-test before assuming the spread holds.
Location & tenants
- Location reads 57/100 on livability (#734 in CA) — a working-class tenant base; expect higher turnover. Strengths: housing A+, health & safety A, amenities A-; Watch: employment C-, crime F, commute F.
- Lodi Unified (urban): math 24% / reading 36% proficiency, ranked #325 of 517 in CA (top 63%) — families likely to look elsewhere, expect single-tenant / working-renter base with shorter leases.
- Zoned schools: Clairmont Elementary (math 12% / reading 17%, grade F, #1,428 of 1,571 statewide, top 92%, 377 students, 93% FRL); Morada Middle (math 19% / reading 27%, grade F, #376 of 498 statewide, top 76%, 746 students, 84% FRL); Ronald E. Mcnair High (math 24% / reading 50%, grade F, #578 of 1,170 statewide, top 51%, 1,768 students, 75% FRL) — zoned schools average 84% FRL vs 59% district-wide (25 pts higher); higher-poverty schools than district average — tighter screening recommended.
- Market conditions: Rents rising fast (+7.1%/yr); 106 active listings in the ZIP; 4 comparable units currently listed for rent nearby; rentals lingering (median 46d on market — plan ~5-8 weeks vacancy on turnover, expect pricing pressure); 50% of comp listings sitting > 30 days — soft ceiling on asking rent; 3,779 units permitted in San Joaquin County in 2024 (0 in 5+ unit buildings).
Forward outlook
- Local home prices are declining (-3.0%/yr); year-one equity from $878 of loan paydown is wiped out by about $4k of value loss. Plan a longer hold.
- San Joaquin County population projected at +17% by 2050 — long-run rental-demand tailwind backs the buy-and-hold thesis.
Negotiation context
- It's been on market 48 days — a 3% lower offer ($123k) is reasonable based on typical stale-listing flexibility.
Risks & watch-outs
- Watch-outs: HOA is 32% of rent.
- Climate carrying-cost: extreme-heat days projected 7→15/yr by 2055 (HVAC capex compounding) — expect insurance premiums to compound above CPI over the hold.
Questions for the listing agent
- What do current leases actually rent for vs. the listed asking? Can we see a recent rent roll and the last 12 months of T-12 income?
- It's been on market 48 days. Have you received any prior offers? Is the seller open to a 13% concession, seller financing, or rate buy-down credit?
- What does the HOA fee cover, when was the last increase, and are there any pending special assessments or reserve-fund shortfalls?
- Any open or pending special assessments — roof, HVAC, plumbing, elevator, façade? What's the per-unit balance and payoff schedule, and is the seller paying it off at close or rolling it to the buyer?
- Is there a deadline driving the sale (1031 exchange, divorce, estate, relocation)? That informs how much negotiation room exists.
- Schools are D-rated, which usually means shorter tenancies and higher turnover. Who's the typical renter profile here, and what's been the actual vacancy rate?
- Crime grade is F in this area — have there been break-ins, vandalism, or insurance claims at this property in the last 3 years? What carrier currently insures it and at what premium?
- The area grade is low — what's the realistic commute time and amenity access for the typical tenant pool here? Any planned neighborhood developments (good or bad) we should know about?
- What's the average days-on-market for RENTAL listings here right now (not sales)? A rising rental-DOM trend means longer vacancies and softer asking-rent achievability than the comps imply.
- What's the recent tenant-quality profile in this submarket — average credit score on applications, eviction rate, late-payment / NSF rate, and stable-employment percentage? A property-management company in the area should have these aggregated.
- How much new apartment / multifamily construction is in the pipeline within 1–3 miles? Heavy new supply (>2% of stock underway) typically softens rents 12–24 months out; light construction supports rent growth.
Investment metrics
- 1% rule
- 1.10% ✓
- Cap rate
- 5.41%
- Cash-on-cash
- -3.15%
- DSCR
- 0.86
- GRM
- 7.5
CMA / ARV
- ARV (median comp)
- $135,073
- List price
- $127,000
- Delta
- -5.98%
- Verdict
- FAIR
- Comps
- 12 within 1.0 mi
Projected returns pro-forma
-3.0% appreciation · 7.09% rent growth · sell at horizon
- IRR
- -15.2%
- Equity multiple
- 0.43×
- Total profit
- $-20,302
- Equity at exit
- $18,936
- IRR
- 0.8%
- Equity multiple
- 1.07×
- Total profit
- $2,388
- Equity at exit
- $10,981
Cash invested: $35,560 (down + closing). Projections, not guarantees.
Landlord ↔ Tenant lean methodology
- Overall (STATE)
- 18 Strongly Tenant-Friendly
- State California
- 18 Strongly Tenant-Friendly · D+13
- County
- — inherits STATE
- City
- — inherits STATE
ZIP-level market 95210
- Rents YoY
- 7.1%
- Active inventory
- 106
- Price-to-rent
- 7.5×
Monthly cashflow live
- Estimated rent
- $1,403 medium interval (Pro) →
- Mortgage (P&I)
- −$666
- Tax from tax record
- −$28 /mo · $334/yr
- Insurance
- −$53
- HOA
- −$455
- Vacancy / Maint / Mgmt
- −$295
- Net cashflow
- $-93
Break-even live
Sensitivity live
| Price | -10% $-22 | -5% $-58 | +0% $-93 | +5% $-129 | +10% $-165 |
|---|---|---|---|---|---|
| Rent | -10% $-204 | -5% $-149 | +0% $-93 | +5% $-38 | +10% $17 |
| Rate | -1.0pp $-30 | -0.5pp $-61 | base $-93 | +0.5pp $-126 | +1.0pp $-160 |
UW: 25.0% down · 7.5% · 30yr · 1.5% tax · 5.0% vac · 8.0% maint · 8.0% mgmt
Financing live
Cash to close
- Down payment
- $31,750
- Closing costs
- $3,810
- Reserves months
- —
- Total cash needed
- —
Loan-product check · same deal, 3 products live
Conventional
25% down · 7.5% · 30yr
- Down + closing
- —
- Monthly P&I
- —
- Monthly cashflow
- —
- DSCR
- —
- Eligible?
- —
Personal DTI + credit; lowest rate.
DSCR
20% down · 8.5% · 30yr
- Down + closing
- —
- Monthly P&I
- —
- Monthly cashflow
- —
- DSCR
- —
- Eligible?
- —
No personal income docs; deal must DSCR.
Hard money
10% down · 12.0% · 12mo
- Down + closing
- —
- Monthly P&I
- —
- Monthly cashflow
- —
- DSCR
- —
- Eligible?
- —
Short-term bridge; refi at stabilization.
Rent comps 4 comps
| Address | Beds | Baths | Sqft | Rent | $/sqft | DOM | Units | Dist |
|---|---|---|---|---|---|---|---|---|
| 6465 West Ln Stockton, CA | 1.0 | 1.0 | 539 | $1,320 | $2.45 | 45d | 1 | 0.99mi |
| 6465 West Ln Stockton, CA | 1.0 | 1.0 | 539 | $1,270 | $2.36 | 25d | 1 | 0.99mi |
| 6465 West Ln Stockton, CA | 1.0 | 1.0 | 539 | $1,270 | $2.36 | 13d | 1 | 0.99mi |
| 7620 N El Dorado St Stockton, CA | 1.0–3.0 | 1.0–2.0 | 827 | $1,300 | $1.57 | 45d | 1 | 1.24mi |
HOA detail condo
- Monthly dues
- $455 · $5,460/yr
- Likely covers
- watersecurity
- Assessments
- None detected in remarks — confirm with the listing agent.
Listing history 5 events
-
2006-02-22soldstatus $154,000 308-char remark
Show marketing remark (308 chars)
Painted interior, new carpet coming, vacant. Desirable gated CONDO community in Lodi school district, surrounded by waterfalls and trees w/ lots of amenities! Great for investors and 1st time buyers. No occupancy requirments for investors. Lower-level unit w/ washer & dryer hook-ups (must be stacked).
-
2006-02-22soldstatus $154,000
Show marketing remark (308 chars)
Painted interior, new carpet coming, vacant. Desirable gated CONDO community in Lodi school district, surrounded by waterfalls and trees w/ lots of amenities! Great for investors and 1st time buyers. No occupancy requirments for investors. Lower-level unit w/ washer & dryer hook-ups (must be stacked).
-
2006-02-12historical 308-char remark
Show marketing remark (308 chars)
Painted interior, new carpet coming, vacant. Desirable gated CONDO community in Lodi school district, surrounded by waterfalls and trees w/ lots of amenities! Great for investors and 1st time buyers. No occupancy requirments for investors. Lower-level unit w/ washer & dryer hook-ups (must be stacked).
-
2005-09-17$159,900 308-char remark
Show marketing remark (308 chars)
Painted interior, new carpet coming, vacant. Desirable gated CONDO community in Lodi school district, surrounded by waterfalls and trees w/ lots of amenities! Great for investors and 1st time buyers. No occupancy requirments for investors. Lower-level unit w/ washer & dryer hook-ups (must be stacked).
-
1985-12-16soldstatus $45,500
ⓘ Source: listings_history table (triggers on properties + properties_extension) + one-shot
backfill from property_details.listing_events for pre-trigger history.
Tax reassessment forecast CA · Resets to sale price
- Current annual tax
- $334 · $28/mo
- Projected year-2 tax
- $965 · $80/mo
- Expected delta
- +$631/yr (+$53/mo · 189.0%)
ⓘ Screening estimate from a state-policy table — verify with the county assessor before closing.
Climate risk First Street
- Flood 3/10 Moderate FEMA zone X · 20% chance over 30 yrs
- Wildfire 3/10 Moderate
- Heat 7/10 Severe 7 d/yr ≥102°F today · 15 d/yr by 30 yrs out
- Wind 1/10 Low
- Air quality 10/10 Extreme 30 unhealthy d/yr today · 30 by 30 yrs out
Nearby sold comps map
Loading sold comps map…
Walkable amenities ~0.75 mi
Loading nearby amenities…
Taxation est. · year 1
- Rental income
- $16,835
- − Mortgage interest
- −$7,114
- − Property taxes
- −$334
- − Insurance
- −$635
- − Repairs & maintenance
- −$1,347
- − Management
- −$1,347
- − HOA
- −$5,460
- − Depreciation
- −$3,695
- Taxable loss
- −$3,096
- Est. tax savings @ 24.0%
- +$743
- After-tax cash flow
- $-378/yr
For passive investors: Depreciation is non-cash, so a rental often shows a tax loss while cash-flowing — sheltering income. Rental losses are passive: they offset passive income freely, and up to $25,000/yr can offset ordinary (W-2) income if you actively participate and your MAGI is under $100k (phasing out to $0 by $150k); unused losses carry forward. On sale, claimed depreciation is recaptured at up to 25%, and gains may owe capital-gains tax (a 1031 exchange can defer both). Figures are a year-1 estimate at your 24.0% rate — not tax advice; consult a CPA.
Schools (NCES district)
- District
- Lodi Unified
- NCES district ID
- 0622230
- Math proficiency
- 24% ▼ -8.00%
- Reading proficiency
- 36% ▼ -8.00%
- Median HH income
- $57,165
- Composite
- 26.84/100
- National rank
- #7108
- State rank
- #325 of 517 in CA
Livability — Stockton
- Score
- 57/100
- State rank
- #734
- US rank
- #21638
Category grades
Schools grade is shown separately in the Schools card above.
Census & demographics
- Census place
- Stockton, CA
- County
- San Joaquin County · 729,570 people
- City population
- 332,006
- Metro
- Stockton, CA
- Population (ZIP)
- 41,549
- Household income
- $67,991
- Rent vs Own
- Severe rent burden
- 1817.0
Population outlook (San Joaquin County) Hauer SSP2
- Today (2025)
- 796,965 people
- By 2030
- 828,849 · +4.0%
- By 2040
- 885,611 · +11.1%
- By 2050
- 929,798 · +16.7%
- By 2075
- 994,578 · +24.8%
- By 2100
- 971,291 · +21.9%
Race, ethnicity, and origin ACS 2023
- Neighborhood character
- Highly diverse neighborhood (Simpson 0.73)
- Race & ethnicity
- Hispanic / Latino 38% Asian 31% Two or more races 21% White 13% Black 11% Pacific Islander 1%
- Hispanic origin (detail)
- Mexican 34%
- Common ancestry
- Italian 1% Russian 1%
- Foreign-born
- 27% · Canada, Vietnam, China
- Languages at home
- 49% English-only · Spanish 25% Other Asian/Pacific 12% Other Indo-European 6%
Political lean MEDSL · San Joaquin
- 2024 margin
- Toss-up / Even · D 48.0% · R 48.9% · Other 3.0%
- 2008→2024 swing
- -11.6pp toward R · 2008: 10.7pp · 2024: -0.9pp
- All cycles
- 2024: R+0.9 2020: D+13.9 2016: D+12.9 2012: D+8.9 2008: D+10.7
Not yet ingested
- Civics
- —
Market trends
- HPI YoY
- ▼ -283.31%
- Current HPI
- 349.495
- Rent YoY
- ▲ 7.09%
- Metro
- Stockton, CA
- State GDP YoY
- ▲ 3.21%
- F500 in state
- 116
Industry mix (Fortune 500 HQ in CA)
| Industry | F500 HQs | Revenue |
|---|---|---|
| Technology | 27 | $1,492B |
|
||
| Financial Services | 3 | $174B |
|
||
| Retail | 3 | $44B |
|
||
| Insurance | 3 | $26B |
|
||
| Media / Entertainment | 2 | $115B |
|
||
| Pharmaceuticals / Biotech | 2 | $62B |
|
||
Price history
+238.5% since first listed5 events — show timeline
- 2006-02-22 Sold (Public Records) $154,000 Public Records
- 2006-02-22 Sold (MLS) $154,000 MLSListings
- 2006-02-12 Listing Removed — MLSListings
- 2005-09-17 Listed $159,900 MLSListings
- 1985-12-16 Sold (Public Records) $45,500 Public Records
Property tax history
-6.0%/yrLatest (2025): $334 · +2.6% YoY. Source: county tax records.
Cash-flow waterfall
monthlySold comps — $/sqft
last 12 mo · ≤1 miLoading sold comps…