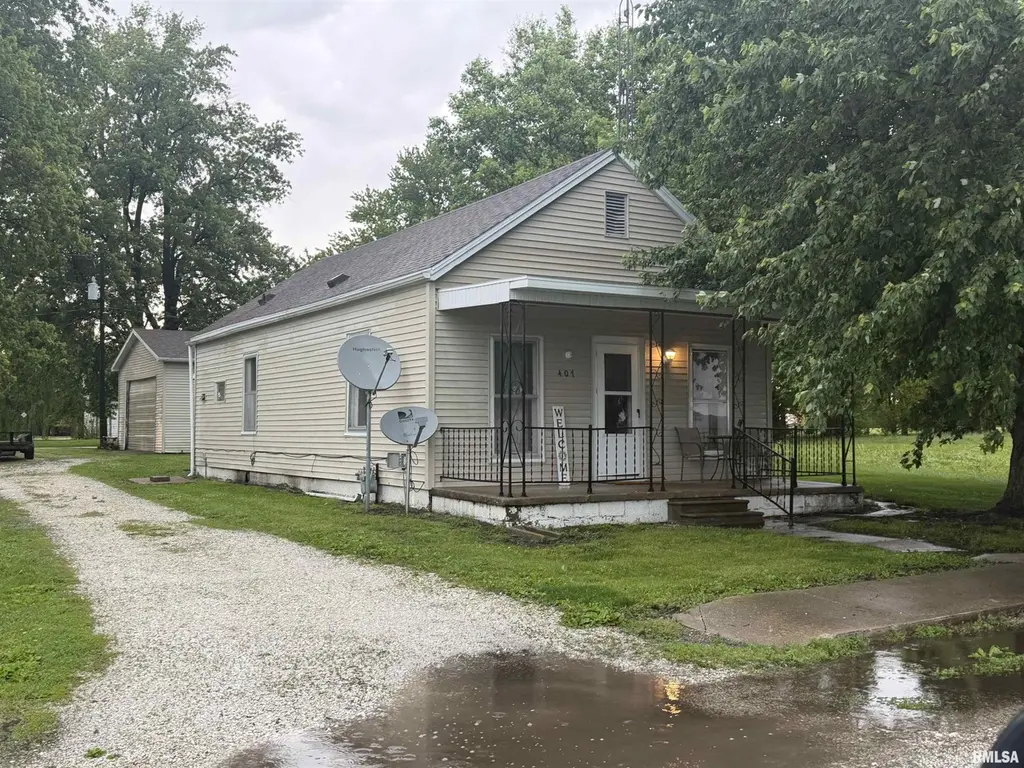
407 Morgan St · Concord, IL
Flood risk 1/10 · Minimal
- FEMA flood zone
- X (unshaded)
- Chance of flooding over 30 yrs
- 0.0%
- Est. flood insurance / yr
- $473 – $860
Fire risk 1/10 · Minimal
- Est. fire insurance / yr
- $804 – $1,492
Heat risk 3/10 · Minor
- Hot days now (above 106°F)
- 7 days/yr
- Hot days in 30 yrs
- 19 days/yr
Wind risk 2/10 · Minimal
- Chance of severe wind over 30 yrs
- 2.0%
Air-quality risk 2/10 · Minimal
- Unhealthy air days now
- 1 days/yr
- Unhealthy air days in 30 yrs
- 2 days/yr
Risk factors via First Street. Map © Google.
Why this score? — see what drove the B- grade
The composite is a weighted blend of 9 inputs, each scored 0–100. Each bar is that input's sub-score; the figure is the points it added to the 100-point composite (weight × sub-score).
- Cash flow +28.8/30.0
- DSCR +10.0/10.0
- 1% rule +7.5/10.0
- ARV discount +7.5/15.0
- Appreciation +4.3/10.0
- Schools +3.5/10.0
- Livability +2.9/5.0
- Rent growth +2.5/5.0
- Condition / age +2.5/5.0
$65,000
🖨 Deal sheet (PDF) 📄 Offer letter ✓ Due diligence
Listing remarks
Adorable 1 bed, 1 bath home located in a quiet Concord setting- featuring a garage that truly steals the show! Enjoy an open-concept feel with a combined living and dining area, perfect for everyday living. The spacious kitchen and convenient in-closet laundry. The updated bathroom includes a walk-in shower, new vanity, and commode. Major updates include a new roof in 2022 on both the home and the shed. The detached shed is a standout feature with a concrete floor and electricity- ideal for a workshop, hobby space, or storage for all your toys. A unique property with big functionality in a cozy footprint!
Key facts
- Spacious kitchen
- Walk-in shower
- In-closet laundry
Tags
Property features AI
Exterior
- Parking: Detached oversized garage with 4 garage spaces
- Utilities: Public water; Public sewer; Electric service
- Home design: Single-family residence; Built in 1930; Single-story sections with additional upper, lower and basement levels
- Construction: Shingle roof; Crawl space foundation
- Exterior features: Level lot; Outbuilding on property
Interior
- Kitchen: Kitchen on main level
- Bedrooms: 1 bedroom (Main level) — approx. 9' x 12', vinyl flooring, egress window
- Flooring: Vinyl flooring in primary living spaces
- Bathrooms: 1 full bathroom
- Heating & cooling: Electric heating; Other heating components; Gas water heater
- Interior features: Crawl space basement; Dryer, Washer, Refrigerator
- Laundry & utility: Washer and dryer included; Gas water heater
Neighborhood map
What this means for you Summary
Snapshot
- This is a 1-bed/1.0-bath single-family listed at $65k.
Deal economics
- At list price, monthly cash flow is $218 ($3k/yr) — positive.
- The deal already cash-flows at list — no discount required.
- Meets the 1% rule at list price ($810 rent vs $65k).
- Recommended offer: $63k (3.0% below list) — sets the bar for market timing.
Location & tenants
- Location reads 58/100 on livability (#1,124 in IL) — a working-class tenant base; expect higher turnover. Strengths: cost of living A+, housing A; Watch: schools D, crime D-, amenities F.
- Triopia CUSD 27 (rural): math 40% / reading 35% proficiency, ranked #353 of 919 in IL (top 38%) — families likely to look elsewhere, expect single-tenant / working-renter base with shorter leases.
- Market conditions: 2 active listings in the ZIP; 3 units permitted in Morgan County in 2024 (0 in 5+ unit buildings).
Forward outlook
- Local home prices are declining (-1.4%/yr); year-one equity from $449 of loan paydown is wiped out by about $919 of value loss. Plan a longer hold.
- Morgan County population projected at -20% by 2050 — secular population decline; favor cash flow + early exit over multi-decade hold.
- At projected returns (-1.4% appreciation + 3.0% rent growth), your $18k cash investment doubles in ~7 years — after that, you're playing with house money.
Negotiation context
- It's been on market 34 days — a 3% lower offer ($63k) is reasonable based on typical stale-listing flexibility.
- 4 sale attempts since 13y ago with the ask held roughly flat each time — persistent listings suggest the price (not the market) is what's stuck; bring a comps-based counter.
- Current owner paid $20k; list at $65k implies a 225% gain — meaningful room to come down on a strong offer.
Risks & watch-outs
- Watch-outs: built in 1930 — expect roof / HVAC / electrical / plumbing capex.
Questions for the listing agent
- It's been on market 34 days. Have you received any prior offers? Is the seller open to a 3% concession, seller financing, or rate buy-down credit?
- Built in 1930 — when were the roof, HVAC, electrical panel, plumbing, and water heater last replaced?
- Is there a deadline driving the sale (1031 exchange, divorce, estate, relocation)? That informs how much negotiation room exists.
- Schools are D-rated, which usually means shorter tenancies and higher turnover. Who's the typical renter profile here, and what's been the actual vacancy rate?
- Crime grade is D in this area — have there been break-ins, vandalism, or insurance claims at this property in the last 3 years? What carrier currently insures it and at what premium?
- What's the average days-on-market for RENTAL listings here right now (not sales)? A rising rental-DOM trend means longer vacancies and softer asking-rent achievability than the comps imply.
- What's the recent tenant-quality profile in this submarket — average credit score on applications, eviction rate, late-payment / NSF rate, and stable-employment percentage? A property-management company in the area should have these aggregated.
- How much new for-sale + rental construction is in the pipeline within 1–3 miles? Heavy new supply typically softens prices + rents 12–24 months out; constrained supply supports both.
Investment metrics
- 1% rule
- 1.25% ✓
- Cap rate
- 10.31%
- Cash-on-cash
- 14.35%
- DSCR
- 1.64
- GRM
- 6.7
CMA / ARV
No comps found within radius.
Projected returns pro-forma
-1.41% appreciation · 3.0% rent growth · sell at horizon
- IRR
- 9.7%
- Equity multiple
- 1.43×
- Total profit
- $7,757
- Equity at exit
- $14,405
- IRR
- 16.4%
- Equity multiple
- 2.57×
- Total profit
- $28,662
- Equity at exit
- $14,056
Cash invested: $18,200 (down + closing). Projections, not guarantees.
Landlord ↔ Tenant lean methodology
- Overall (STATE)
- 43 Moderately Tenant-Leaning
- State Illinois
- 43 Moderately Tenant-Leaning · D+7
- County
- — inherits STATE
- City
- — inherits STATE
ZIP-level market 62631
- Home prices YoY
- -1.5%
- Active inventory
- 2
- Price-to-rent
- 6.7×
Monthly cashflow live
- Estimated rent
- $810 medium interval (Pro) →
- Mortgage (P&I)
- −$341
- Tax from tax record
- −$54 /mo · $647/yr
- Insurance
- −$27
- HOA
- −$0
- Vacancy / Maint / Mgmt
- −$170
- Net cashflow
- $218
Break-even live
Sensitivity live
| Price | -10% $254 | -5% $236 | +0% $218 | +5% $199 | +10% $181 |
|---|---|---|---|---|---|
| Rent | -10% $154 | -5% $186 | +0% $218 | +5% $250 | +10% $282 |
| Rate | -1.0pp $250 | -0.5pp $234 | base $218 | +0.5pp $201 | +1.0pp $184 |
UW: 25.0% down · 7.5% · 30yr · 1.5% tax · 5.0% vac · 8.0% maint · 8.0% mgmt
Financing live
Cash to close
- Down payment
- $16,250
- Closing costs
- $1,950
- Reserves months
- —
- Total cash needed
- —
Loan-product check · same deal, 3 products live
Conventional
25% down · 7.5% · 30yr
- Down + closing
- —
- Monthly P&I
- —
- Monthly cashflow
- —
- DSCR
- —
- Eligible?
- —
Personal DTI + credit; lowest rate.
DSCR
20% down · 8.5% · 30yr
- Down + closing
- —
- Monthly P&I
- —
- Monthly cashflow
- —
- DSCR
- —
- Eligible?
- —
No personal income docs; deal must DSCR.
Hard money
10% down · 12.0% · 12mo
- Down + closing
- —
- Monthly P&I
- —
- Monthly cashflow
- —
- DSCR
- —
- Eligible?
- —
Short-term bridge; refi at stabilization.
Listing history 24 events
-
2026-06-19days on market $65,000 Active 34 DOM
-
2026-06-18days on market $65,000 Active 33 DOM
-
2026-06-17days on market $65,000 Active 32 DOM
-
2026-06-16days on market $65,000 Active 31 DOM
-
2026-06-15days on market $65,000 Active 30 DOM
-
2026-06-14days on market $65,000 Active 28 DOM
-
2026-06-13days on market $65,000 Active 27 DOM
-
2026-06-10days on market $65,000 Active 25 DOM
-
2026-06-09days on market $65,000 Active 24 DOM
-
2026-06-08days on market $65,000 Active 23 DOM
-
2026-06-07days on market $65,000 Active 22 DOM
-
2026-06-03days on market $65,000 Active 18 DOM
-
2026-06-02days on market $65,000 Active 17 DOM
-
2026-06-01days on market $65,000 Active 16 DOM
-
2026-05-31days on market $65,000 Active 15 DOM
-
2026-05-30days on market $65,000 Active 14 DOM
-
2026-05-16$65,000 Active
-
2021-08-06historical
-
2020-01-17soldstatus $20,000
-
2020-01-16$20,000
-
2018-04-11soldstatus $14,000
-
2018-03-17$14,000
-
2013-05-15soldstatus $12,000
-
2013-03-29$15,000
ⓘ Source: listings_history table (triggers on properties + properties_extension) + one-shot
backfill from property_details.listing_events for pre-trigger history.
Tax reassessment forecast IL · Partial reset (capped growth)
- Current annual tax
- $647 · $54/mo
- Projected year-2 tax
- $1,061 · $88/mo
- Expected delta
- +$414/yr (+$35/mo · 64.0%)
ⓘ Screening estimate from a state-policy table — verify with the county assessor before closing.
Climate risk First Street
- Flood 1/10 Low FEMA zone X (unshaded) · 0% chance over 30 yrs
- Wildfire 1/10 Low
- Heat 3/10 Moderate 7 d/yr ≥106°F today · 19 d/yr by 30 yrs out
- Wind 2/10 Low 2% chance of damaging wind over 30 yrs
- Air quality 2/10 Low 1 unhealthy d/yr today · 2 by 30 yrs out
Nearby sold comps map
Loading sold comps map…
Walkable amenities ~0.75 mi
Loading nearby amenities…
Taxation est. · year 1
- Rental income
- $9,715
- − Mortgage interest
- −$3,641
- − Property taxes
- −$647
- − Insurance
- −$325
- − Repairs & maintenance
- −$777
- − Management
- −$777
- − Depreciation
- −$1,891
- Taxable income
- $1,656
- Est. tax owed @ 24.0%
- −$398
- After-tax cash flow
- $2,215/yr
For passive investors: Depreciation is non-cash, so a rental often shows a tax loss while cash-flowing — sheltering income. Rental losses are passive: they offset passive income freely, and up to $25,000/yr can offset ordinary (W-2) income if you actively participate and your MAGI is under $100k (phasing out to $0 by $150k); unused losses carry forward. On sale, claimed depreciation is recaptured at up to 25%, and gains may owe capital-gains tax (a 1031 exchange can defer both). Figures are a year-1 estimate at your 24.0% rate — not tax advice; consult a CPA.
Schools (NCES district)
- District
- Triopia CUSD 27
- NCES district ID
- 1710830
- Math proficiency
- 40% ▼ -1.00%
- Reading proficiency
- 35% ▼ -11.00%
- Median HH income
- $52,870
- Composite
- 35.23/100
- National rank
- #9852
- State rank
- #353 of 919 in IL
Livability — Concord
- Score
- 58/100
- State rank
- #1124
- US rank
- #21220
Category grades
Schools grade is shown separately in the Schools card above.
Census & demographics
- Census place
- Concord, IL
- Population (ZIP)
- 239
Population outlook (Morgan County) Hauer SSP2
- Today (2025)
- 32,874 people
- By 2030
- 31,698 · -3.6%
- By 2040
- 29,050 · -11.6%
- By 2050
- 26,381 · -19.8%
- By 2075
- 20,235 · -38.4%
- By 2100
- 14,324 · -56.4%
Race, ethnicity, and origin ACS 2023
- Neighborhood character
- Predominantly White (100%)
- Race & ethnicity
- White 100%
- Common ancestry
- Russian 6%
- Languages at home
- 99% English-only · French/Haitian/Cajun 1%
Political lean MEDSL · Morgan
- 2024 margin
- Solid R (+32.5) · D 33.1% · R 65.6% · Other 1.3%
- 2008→2024 swing
- -31.7pp toward R · 2008: -0.8pp · 2024: -32.5pp
- All cycles
- 2024: R+32.5 2020: R+31.8 2016: R+29.9 2012: R+15.4 2008: R+0.8
Not yet ingested
- Civics
- —
Market trends
- HPI YoY
- ▼ -1.41%
- Current HPI
- 95.1464
- Rent YoY
- —
- Metro
- —
- State GDP YoY
- ▲ 1.59%
- F500 in state
- 60
Industry mix (Fortune 500 HQ in IL)
| Industry | F500 HQs | Revenue |
|---|---|---|
| Insurance | 4 | $201B |
|
||
| Consumer Goods | 4 | $87B |
|
||
| Industrial Machinery | 3 | $64B |
|
||
| Healthcare | 2 | $55B |
|
||
| Retail / Pharmacy | 1 | $148B |
|
||
| Agriculture / Food | 1 | $86B |
|
||
Price history
+333.3% since first listed8 events — show timeline
- 2026-05-16 Listed $65,000 RMLSA as Distributed by MLS Grid
- 2021-08-06 Listing Removed — RMLSA as Distributed by MLS Grid
- 2020-01-17 Sold (MLS) $20,000 RMLSA as Distributed by MLS Grid
- 2020-01-16 Listed $20,000 RMLSA as Distributed by MLS Grid
- 2018-04-11 Sold (MLS) $14,000 RMLSA as Distributed by MLS Grid
- 2018-03-17 Listed $14,000 RMLSA as Distributed by MLS Grid
- 2013-05-15 Sold (MLS) $12,000 RMLSA as Distributed by MLS Grid
- 2013-03-29 Listed $15,000 RMLSA as Distributed by MLS Grid
Property tax history
-1.9%/yrLatest (2024): $647 · +10.5% YoY. Source: county tax records.
Cash-flow waterfall
monthlySold comps — $/sqft
last 12 mo · ≤1 miLoading sold comps…