77 Appletree Dr · Saugerties South, NY
Flood risk 1/10 · Minimal
- FEMA flood zone
- X (unshaded)
- Chance of flooding over 30 yrs
- 0.0%
- Est. flood insurance / yr
- $473 – $860
Fire risk 2/10 · Minimal
- Est. fire insurance / yr
- $691 – $1,283
Heat risk 4/10 · Minor
- Hot days now (above 99°F)
- 7 days/yr
- Hot days in 30 yrs
- 15 days/yr
Wind risk 3/10 · Minor
- Chance of severe wind over 30 yrs
- 8.0%
Air-quality risk 2/10 · Minimal
- Unhealthy air days now
- 0 days/yr
- Unhealthy air days in 30 yrs
- 1 days/yr
Risk factors via First Street. Map © Google.
Why this score? — see what drove the C grade
The composite is a weighted blend of 9 inputs, each scored 0–100. Each bar is that input's sub-score; the figure is the points it added to the 100-point composite (weight × sub-score).
- Cash flow +19.9/30.0
- ARV discount +15.0/15.0
- DSCR +6.3/10.0
- 1% rule +6.2/10.0
- Schools +4.1/10.0
- Livability +3.2/5.0
- Rent growth +2.5/5.0
- Condition / age +2.5/5.0
- Appreciation +0.0/10.0
$244,900
🖨 Deal sheet 📄 Offer letter ✓ Due diligence
Listing remarks
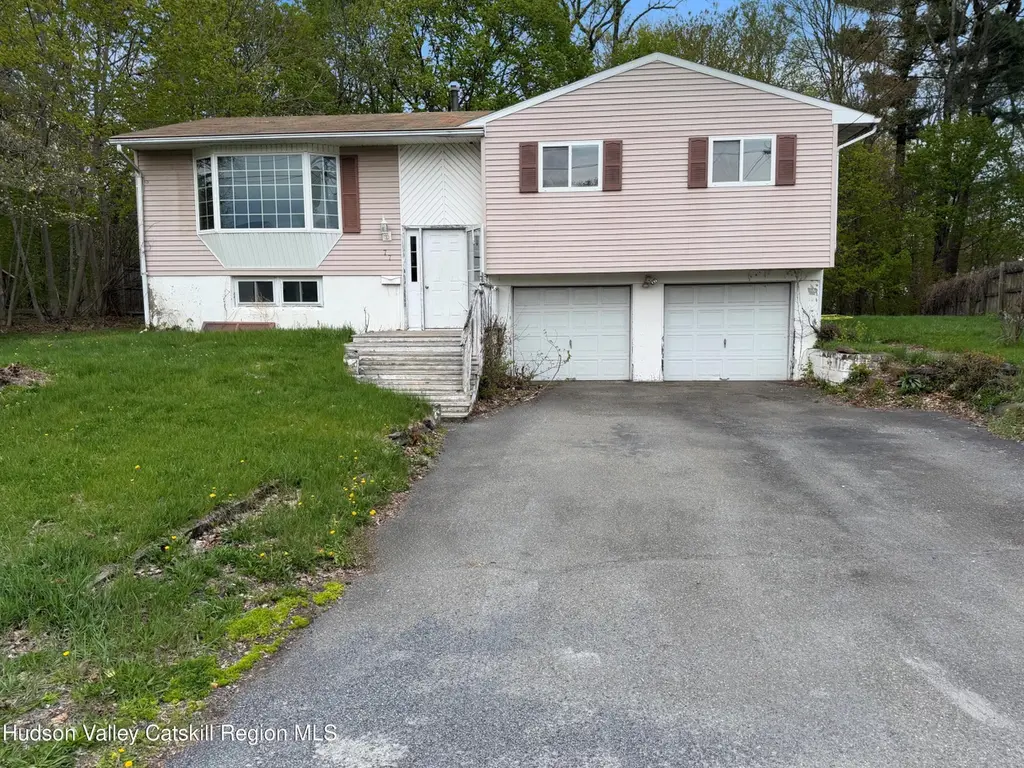
Opportunity knocks in Barclay Heights, Saugerties! This bi-level fixer-upper sits on a generously sized yard backing up to peaceful woods--offering privacy, potential, and a beautiful natural setting. The home needs work and plenty of elbow grease, but the bones and location make it a standout project for investors, flippers, or buyers looking to build equity. With the right vision, this property can truly shine. Being sold as-is--bring your ideas and make it your own
Key facts
- Peaceful woods
- Natural setting
- 8,276 sq ft lot
Tags
Property features AI
Exterior
- Parking: Attached garage; Driveway; 2 garage spaces
- Utilities: Public water; Public sewer
- Home design: Single-family house; Residential property
- Construction: Frame construction; Asphalt roof
- Exterior features: Level lot
Interior
- Kitchen: Dishwasher; Range
- Flooring: Hardwood; Linoleum; Other
- Bathrooms: 1 full bathroom
- Heating & cooling: Forced air heating
- Interior features: Dishwasher; Range; Hardwood flooring; Linoleum flooring; Additional flooring types; Full and partial basement
Neighborhood map
What this means for you Summary
Snapshot
- This is a 3-bed/1.0-bath single-family listed at $245k.
Deal economics
- At list price, monthly cash flow is $294 ($4k/yr) — positive.
- The deal already cash-flows at list — no discount required.
- Meets the 1% rule at list price ($3k rent vs $245k).
- Recommended offer: $238k (3.0% below list) — sets the bar for market timing.
Location & tenants
- Location reads 63/100 on livability (#797 in NY) — a middle-class / working-renter tenant base. Strengths: housing A+, crime A, employment B; Watch: schools D, amenities F, commute F.
- Saugerties Central School District (suburban): math 38% / reading 57% proficiency, ranked #419 of 590 in NY (top 71%) — families likely to look elsewhere, expect single-tenant / working-renter base with shorter leases.
- Market conditions: 173 active listings in the ZIP; 4 comparable units currently listed for rent nearby; rentals at typical pace (median 24d on market — plan ~3-4 weeks tenant-placement turnaround); solid renter incomes; 464 units permitted in Ulster County in 2024 (170 in 5+ unit buildings).
- This rent runs 41% of the median local income ($81k/yr) — at the standard rent-burdened threshold; future hikes will face affordability resistance.
Forward outlook
- Local home prices are declining (-3.0%/yr); year-one equity from $2k of loan paydown is wiped out by about $7k of value loss. Plan a longer hold.
- Ulster County population projected at -14% by 2050 — secular population decline; favor cash flow + early exit over multi-decade hold.
Negotiation context
- It's been on market 32 days — a 3% lower offer ($238k) is reasonable based on typical stale-listing flexibility.
- Current owner paid $68k; list at $245k implies a 260% gain — meaningful room to come down on a strong offer.
Risks & watch-outs
- Watch-outs: built in 1958 — expect roof / HVAC / electrical / plumbing capex.
Questions for the listing agent
- It's been on market 32 days. Have you received any prior offers? Is the seller open to a 3% concession, seller financing, or rate buy-down credit?
- Built in 1958 — when were the roof, HVAC, electrical panel, plumbing, and water heater last replaced?
- Is there a deadline driving the sale (1031 exchange, divorce, estate, relocation)? That informs how much negotiation room exists.
- Schools are D-rated, which usually means shorter tenancies and higher turnover. Who's the typical renter profile here, and what's been the actual vacancy rate?
- What's the average days-on-market for RENTAL listings here right now (not sales)? A rising rental-DOM trend means longer vacancies and softer asking-rent achievability than the comps imply.
- What's the recent tenant-quality profile in this submarket — average credit score on applications, eviction rate, late-payment / NSF rate, and stable-employment percentage? A property-management company in the area should have these aggregated.
- How much new for-sale + rental construction is in the pipeline within 1–3 miles? Heavy new supply typically softens prices + rents 12–24 months out; constrained supply supports both.
Investment metrics
- 1% rule
- 1.12% ✓
- Cap rate
- 7.73%
- Cash-on-cash
- 5.14%
- DSCR
- 1.23
- GRM
- 7.4
CMA / ARV
- ARV (on-the-fly)
- $347,130
- Comps found
- 12
Show comp detail 12 sales within ~0.75 mi
| Address | Dist | Beds/Ba | Sqft | Sold | Price | $/sf | Match |
|---|---|---|---|---|---|---|---|
| 77 Appletree Dr | 0.00mi | 3/1.0 | 1,305 (0%) | 1mo | $250,900 | $192 | 99 |
| 27 Appletree Dr | 0.13mi | 3/1.5 | 1,414 (+8%) | 3mo | $360,000 | $255 | 76 |
| 2 Spaulding Ln | 0.49mi | 3/2.0 | 1,281 (-2%) | 3mo | $325,000 | $254 | 67 |
| 11 Mountain View Ave | 0.44mi | 3/2.0 | 1,231 (-6%) | 0mo | $369,000 | $300 | 66 |
| 19 Edgewood Dr | 0.07mi | 3/2.0 | 1,458 (+12%) | 10mo | $455,000 | $312 | 65 |
| 21 Edith Ave | 0.27mi | 3/1.0 | 1,483 (+14%) | 1mo | $395,000 | $266 | 64 |
| 3 Cedar Ln | 0.53mi | 3/1.0 | 1,219 (-7%) | 2mo | $355,000 | $291 | 62 |
| 15 Simmons Dr | 0.41mi | 3/1.5 | 1,402 (+7%) | 10mo | $355,000 | $253 | 58 |
| 44 Lamb Ave | 0.50mi | 3/1.5 | 1,183 (-9%) | 4mo | $343,500 | $290 | 56 |
| 5 Simmons Dr | 0.48mi | 2/1.0 (-1) | 1,120 (-14%) | 0mo | $389,000 | $347 | 49 |
| 14 & 16 Underwood St | 0.75mi | 4/— (+1) | 1,400 (+7%) | 6mo | $107,000 | $76 | 43 |
| 99 W Bridge St | 0.72mi | 2/1.0 (-1) | 1,152 (-12%) | 4mo | $220,000 | $191 | 38 |
Match score weights: distance 35% · size 25% · config 20% · recency 20%. Top-matched comps best support the ARV.
Projected returns pro-forma
-3.0% appreciation · 3.0% rent growth · sell at horizon
- IRR
- -8.2%
- Equity multiple
- 0.70×
- Total profit
- $-20,822
- Equity at exit
- $36,515
- IRR
- 1.4%
- Equity multiple
- 1.10×
- Total profit
- $6,596
- Equity at exit
- $21,174
Cash invested: $68,572 (down + closing). Projections, not guarantees.
Landlord ↔ Tenant lean methodology
- Overall (STATE)
- 15 Strongly Tenant-Friendly
- State New York
- 15 Strongly Tenant-Friendly · D+10
- County
- — inherits STATE
- City
- — inherits STATE
ZIP-level market 12477
- Home prices YoY
- -18.1%
- Active inventory
- 173
- Price-to-rent
- 7.4×
Monthly cashflow live
- Estimated rent
- $2,754 medium interval (Pro) →
- Mortgage (P&I)
- −$1,284
- Tax from tax record
- −$496 /mo · $5,952/yr
- Insurance
- −$102
- HOA
- −$0
- Vacancy / Maint / Mgmt
- −$578
- Net cashflow
- $294
Break-even live
UW: 25.0% down · 7.5% · 30yr · 1.5% tax · 5.0% vac · 8.0% maint · 8.0% mgmt
Financing live
Cash to close
- Down payment
- $61,225
- Closing costs
- $7,347
- Reserves months
- —
- Total cash needed
- —
Loan-product check · same deal, 3 products live
Conventional
25% down · 7.5% · 30yr
- Down + closing
- —
- Monthly P&I
- —
- Monthly cashflow
- —
- DSCR
- —
- Eligible?
- —
Personal DTI + credit; lowest rate.
DSCR
20% down · 8.5% · 30yr
- Down + closing
- —
- Monthly P&I
- —
- Monthly cashflow
- —
- DSCR
- —
- Eligible?
- —
No personal income docs; deal must DSCR.
Hard money
10% down · 12.0% · 12mo
- Down + closing
- —
- Monthly P&I
- —
- Monthly cashflow
- —
- DSCR
- —
- Eligible?
- —
Short-term bridge; refi at stabilization.
Rent comps 4 comps
| Address | Beds | Baths | Sqft | Rent | $/sqft | DOM | Units | Dist |
|---|---|---|---|---|---|---|---|---|
| 14 Montross St Unit A Saugerties, NY | 3.0 | 1.5 | 1300 | $2,400 | $1.85 | 23d | 1 | 0.78mi |
| 42 Russell St Saugerties, NY | 2.0 | 2.0 | 1408 | $2,500 | $1.78 | 23d | 1 | 0.93mi |
| 1 Trinity Ct Saugerties, NY | 1.0–2.0 | 1.0–2.0 | 1015 | $2,970 | $2.93 | 13d | 6 | 1.36mi |
| 1 Trinity Ct Saugerties, NY | 1.0–2.0 | 1.0–2.0 | 988 | $2,800 | $2.83 | 43d | 13 | 1.36mi |
Listing history 4 events
-
2026-05-17status Pending
-
2026-05-01historical Active Under Contract
-
2026-04-16$244,900 Active
-
2002-02-20soldstatus $68,000
ⓘ Source: listings_history table (triggers on properties + properties_extension) + one-shot
backfill from property_details.listing_events for pre-trigger history.
Tax reassessment forecast NY · Partial reset (capped growth)
- Current annual tax
- $5,952 · $496/mo
- Projected year-2 tax
- $5,952 · $496/mo
- Expected delta
- $0/yr ($0/mo · 0.0%)
ⓘ Screening estimate from a state-policy table — verify with the county assessor before closing.
Climate risk First Street
- Flood 1/10 Low FEMA zone X (unshaded) · 0% chance over 30 yrs
- Wildfire 2/10 Low
- Heat 4/10 Moderate 7 d/yr ≥99°F today · 15 d/yr by 30 yrs out
- Wind 3/10 Moderate 8% chance of damaging wind over 30 yrs
- Air quality 2/10 Low 0 unhealthy d/yr today · 1 by 30 yrs out
Nearby sold comps map
Loading sold comps map…
Walkable amenities ~0.75 mi
Loading nearby amenities…
Taxation est. · year 1
- Rental income
- $33,053
- − Mortgage interest
- −$13,718
- − Property taxes
- −$5,952
- − Insurance
- −$1,224
- − Repairs & maintenance
- −$2,644
- − Management
- −$2,644
- − Depreciation
- −$7,124
- Taxable loss
- −$254
- Est. tax savings @ 24.0%
- +$61
- After-tax cash flow
- $3,585/yr
For passive investors: Depreciation is non-cash, so a rental often shows a tax loss while cash-flowing — sheltering income. Rental losses are passive: they offset passive income freely, and up to $25,000/yr can offset ordinary (W-2) income if you actively participate and your MAGI is under $100k (phasing out to $0 by $150k); unused losses carry forward. On sale, claimed depreciation is recaptured at up to 25%, and gains may owe capital-gains tax (a 1031 exchange can defer both). Figures are a year-1 estimate at your 24.0% rate — not tax advice; consult a CPA.
Schools (NCES district)
- District
- Saugerties Central School District
- NCES district ID
- 3625800
- Math proficiency
- 38% ▼ -16.00%
- Reading proficiency
- 57% ▲ 8.00%
- Median HH income
- $56,897
- Composite
- 41.3/100
- National rank
- #3515
- State rank
- #419 of 590 in NY
Livability — Saugerties South
- Score
- 63/100
- State rank
- #797
- US rank
- #15405
Category grades
Schools grade is shown separately in the Schools card above.
Census & demographics
- Census place
- Saugerties South, NY
- County
- Ulster County · 56,183 people
- Metro
- Kingston, NY
- Population (ZIP)
- 19,066
- Household income
- $80,861
- Rent vs Own
- Severe rent burden
- 725.0
Population outlook (Ulster County) Hauer SSP2
- Today (2025)
- 175,887 people
- By 2030
- 171,876 · -2.3%
- By 2040
- 161,771 · -8.0%
- By 2050
- 151,470 · -13.9%
- By 2075
- 133,023 · -24.4%
- By 2100
- 113,504 · -35.5%
Race, ethnicity, and origin ACS 2023
- Neighborhood character
- Predominantly White (82%)
- Race & ethnicity
- White 82% Two or more races 12% Hispanic / Latino 6% Black 1%
- Hispanic origin (detail)
- Puerto Rican 2% Cuban 1%
- Common ancestry
- Romanian 5% Iranian 4% Italian 3%
- Foreign-born
- 4% · Canada
- Languages at home
- 92% English-only · Spanish 4% Other Indo-European 1% German/W. Germanic 1%
Political lean MEDSL · Ulster
- 2024 margin
- D (+18.7) · D 59.3% · R 40.7%
- 2008→2024 swing
- -4.9pp toward R · 2008: 23.6pp · 2024: 18.7pp
- All cycles
- 2024: D+18.7 2020: D+20.9 2016: D+9.1 2012: D+21.9 2008: D+23.6
Not yet ingested
- Civics
- —
Market trends
- HPI YoY
- ▼ -72.47%
- Current HPI
- 327.9975
- Rent YoY
- —
- Metro
- Kingston, NY
- State GDP YoY
- ▲ 2.60%
- F500 in state
- 92
Industry mix (Fortune 500 HQ in NY)
| Industry | F500 HQs | Revenue |
|---|---|---|
| Financial Services | 10 | $950B |
|
||
| Consumer Goods | 9 | $162B |
|
||
| Insurance | 4 | $225B |
|
||
| Telecommunications | 2 | $144B |
|
||
| Pharmaceuticals | 2 | $112B |
|
||
| Media / Entertainment | 2 | $69B |
|
||
Price history
+260.1% since first listed4 events — show timeline
- 2026-05-17 Pending — HVCRMLS
- 2026-05-01 Contingent — HVCRMLS
- 2026-04-16 Listed $244,900 HVCRMLS
- 2002-02-20 Sold (Public Records) $68,000 Public Records
Property tax history
+2.5%/yrLatest (2025): $5,952 · +4.0% YoY. Source: county tax records.
Cash-flow waterfall
monthlySold comps — $/sqft
last 12 mo · ≤1 miLoading sold comps…