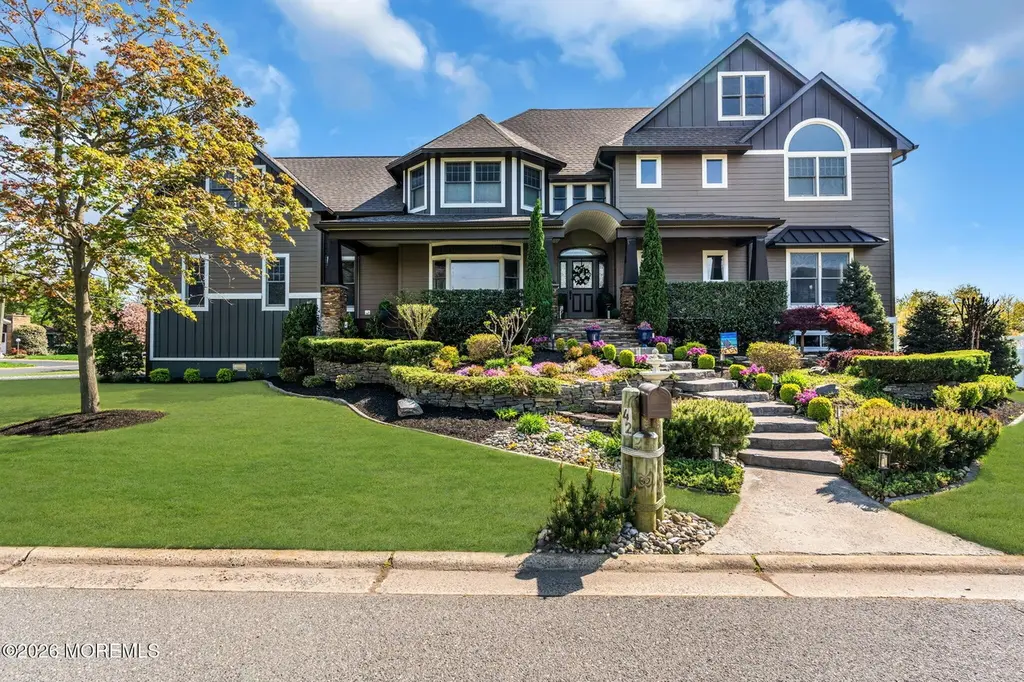
42 Cayuga Ave · Oceanport, NJ
Flood risk 7/10 · Major
- FEMA flood zone
- AE
- Chance of flooding over 30 yrs
- 0.96%
- Est. flood insurance / yr
- $2,026 – $9,024
Fire risk 1/10 · Minimal
- Est. fire insurance / yr
- $526 – $976
Heat risk 7/10 · Major
- Hot days now (above 93°F)
- 7 days/yr
- Hot days in 30 yrs
- 16 days/yr
Wind risk 8/10 · Major
- Chance of severe wind over 30 yrs
- 80.0%
Air-quality risk 3/10 · Minor
- Unhealthy air days now
- 3 days/yr
- Unhealthy air days in 30 yrs
- 4 days/yr
Risk factors via First Street. Map © Google.
Why this score? — see what drove the C- grade
The composite is a weighted blend of 9 inputs, each scored 0–100. Each bar is that input's sub-score; the figure is the points it added to the 100-point composite (weight × sub-score).
- Cash flow +18.8/30.0
- ARV discount +12.1/15.0
- DSCR +5.9/10.0
- Schools +4.9/10.0
- 1% rule +4.5/10.0
- Livability +3.7/5.0
- Rent growth +2.5/5.0
- Condition / age +2.5/5.0
- Appreciation +0.0/10.0
$1,850,000
🖨 Deal sheet 📄 Offer letter ✓ Due diligence
Listing remarks
Nestled in the coveted Blackberry Bay section of Oceanport, 42 Cayuga Avenue offers the perfect blend of luxury coastal living and small-town charm. The homeowner has made major upgrades in 2025 which offer true turn-key, peace of mind to the buyer, including a brand new roof, Hardie Board siding and HVAC system. This spacious 4 bedroom, 3 bath home easily converts to 5 bedrooms/guest suite. Located just minutes from premier local beaches for a quite day at the beach, or exciting nightlife at Pier Village. What could be better than having Blackberry Bay Park right next door? Spend time at the brand new playground, play pickleball, or watching the sun set over the Shrewsbury river. If you lo
Key facts
- Front deck
- Back deck
- Motorized pergola
Tags
Property features AI
Exterior
- Parking: Attached 2-car garage
- Utilities: Public sewer
- Home design: Custom Colonial model
- Construction: Full basement
- Exterior features: Shingle roof
Interior
- Kitchen: Gas cooking; Dishwasher; Refrigerator
- Bedrooms: 4 bedrooms
- Flooring: Wood flooring
- Bathrooms: 2 full bathrooms; 1 half bathroom (2.5 total)
- Heating & cooling: Forced air heating with 2 heat zones; Central air conditioning with 2 AC zones
- Interior features: Ceiling fans; Fireplace (1); Outdoor lighting; Window treatments; Awnings; Garage door opener
- Laundry & utility: Dryer
Neighborhood map
What this means for you Summary
Snapshot
- This is a 4-bed/3.0-bath single-family listed at $1.85M.
Deal economics
- At list price, monthly cash flow is $1k ($17k/yr) — positive.
- The deal already cash-flows at list — no discount required.
- To meet the 1% rule (rent ≥ 1% of price), the offer needs to be $1.75M (5.3% below list).
- Recommended offer: $1.75M (5.3% below list) — sets the bar for 1% rule.
Location & tenants
- Location reads 73/100 on livability (#199 in NJ) — a middle-class / working-renter tenant base. Strengths: schools A+, crime A+, employment A+; Watch: amenities F, cost of living F.
- Oceanport School District (suburban): math 49% / reading 57% proficiency, ranked #102 of 472 in NJ (top 22%) — acceptable for families but not a draw, mixed tenant base, ~2y average lease; only 5% free/reduced lunch — higher-income household profile.
- Market conditions: 29 active listings in the ZIP; 3 comparable units currently listed for rent nearby; rentals leasing fast (median 1d on market — plan ~1-2 weeks tenant-placement turnaround); 2,840 units permitted in Monmouth County in 2024 (484 in 5+ unit buildings).
Forward outlook
- Local home prices are declining (-3.0%/yr); year-one equity from $13k of loan paydown is wiped out by about $56k of value loss. Plan a longer hold.
- Monmouth County population projected at -11% by 2050 — secular population decline; favor cash flow + early exit over multi-decade hold.
Negotiation context
- Only 13 days on market — expect competitive offers; lowballing is unlikely to land.
- Current owner paid $900k; list at $1.85M implies a 106% gain — meaningful room to come down on a strong offer.
Risks & watch-outs
- Watch-outs: flood insurance adds $460/mo.
- Climate carrying-cost: in FEMA flood zone AE (mandatory federal flood insurance); severe wind risk, 80% chance of damaging wind over 30y; extreme-heat days projected 7→16/yr by 2055 (HVAC capex compounding) — expect insurance premiums to compound above CPI over the hold.
Questions for the listing agent
- What's the actual annual flood-insurance premium (NFIP or private), and is the property in a SFHA with mandatory coverage?
- Is there a deadline driving the sale (1031 exchange, divorce, estate, relocation)? That informs how much negotiation room exists.
- Schools are A-rated — typically a magnet for longer-tenancy family renters. What's the average tenant stay here, and is there a school-zone premium baked into asking?
- What's the average days-on-market for RENTAL listings here right now (not sales)? A rising rental-DOM trend means longer vacancies and softer asking-rent achievability than the comps imply.
- What's the recent tenant-quality profile in this submarket — average credit score on applications, eviction rate, late-payment / NSF rate, and stable-employment percentage? A property-management company in the area should have these aggregated.
- How much new for-sale + rental construction is in the pipeline within 1–3 miles? Heavy new supply typically softens prices + rents 12–24 months out; constrained supply supports both.
Investment metrics
- 1% rule
- 0.95% ✗
- Cap rate
- 7.50%
- Cash-on-cash
- 4.32%
- DSCR
- 1.19
- GRM
- 8.8
CMA / ARV
- ARV (on-the-fly)
- $2,059,020
- Comps found
- 7
Show comp detail 7 sales within ~0.75 mi
| Address | Dist | Beds/Ba | Sqft | Sold | Price | $/sf | Match |
|---|---|---|---|---|---|---|---|
| 42 Mohican Ave | 0.12mi | 5/2.5 (+1) | 3,400 (-8%) | 12mo | $1,625,000 | $478 | 64 |
| 66 Shrewsbury Ave | 0.63mi | 5/3.5 (+1) | 3,679 (-0%) | 2mo | $1,875,000 | $510 | 62 |
| 27 Wardell Cir | 0.50mi | 4/3.5 | 3,430 (-7%) | 11mo | $2,150,000 | $627 | 54 |
| 6 Cordelia Ct | 0.48mi | 4/3.5 | 3,224 (-13%) | 1mo | $1,799,999 | $558 | 54 |
| 12 Balmer Ct | 0.75mi | 5/3.0 (+1) | 3,517 (-5%) | 3mo | $1,970,000 | $560 | 50 |
| 6 Blue Point Cv | 0.68mi | 4/3.5 | 3,764 (+2%) | 22mo | $2,200,000 | $584 | 45 |
| 10 Cordelia Ct | 0.48mi | 4/3.5 | 3,232 (-12%) | 14mo | $1,775,000 | $549 | 43 |
Match score weights: distance 35% · size 25% · config 20% · recency 20%. Top-matched comps best support the ARV.
Projected returns pro-forma
-3.0% appreciation · 3.0% rent growth · sell at horizon
- IRR
- -11.2%
- Equity multiple
- 0.59×
- Total profit
- $-210,390
- Equity at exit
- $275,841
- IRR
- -1.9%
- Equity multiple
- 0.87×
- Total profit
- $-67,950
- Equity at exit
- $159,954
Cash invested: $518,000 (down + closing). Projections, not guarantees.
Landlord ↔ Tenant lean methodology
- Overall (STATE)
- 21 Tenant-Leaning
- State New Jersey
- 21 Tenant-Leaning · D+6
- County
- — inherits STATE
- City
- — inherits STATE
ZIP-level market 07757
- Home prices YoY
- -32.7%
- Active inventory
- 29
- Price-to-rent
- 8.8×
Monthly cashflow live
- Estimated rent
- $17,526 medium interval (Pro) →
- Mortgage (P&I)
- −$9,702
- Tax from tax record
- −$1,510 /mo · $18,125/yr
- Insurance
- −$771
- Flood insurance flood zone
- −$460 /mo · $5,525/yr
- HOA
- −$0
- Vacancy / Maint / Mgmt
- −$3,681
- Net cashflow
- $1,403
Break-even live
UW: 25.0% down · 7.5% · 30yr · 1.5% tax · 5.0% vac · 8.0% maint · 8.0% mgmt
Financing live
Cash to close
- Down payment
- $462,500
- Closing costs
- $55,500
- Reserves months
- —
- Total cash needed
- —
Loan-product check · same deal, 3 products live
Conventional
25% down · 7.5% · 30yr
- Down + closing
- —
- Monthly P&I
- —
- Monthly cashflow
- —
- DSCR
- —
- Eligible?
- —
Personal DTI + credit; lowest rate.
DSCR
20% down · 8.5% · 30yr
- Down + closing
- —
- Monthly P&I
- —
- Monthly cashflow
- —
- DSCR
- —
- Eligible?
- —
No personal income docs; deal must DSCR.
Hard money
10% down · 12.0% · 12mo
- Down + closing
- —
- Monthly P&I
- —
- Monthly cashflow
- —
- DSCR
- —
- Eligible?
- —
Short-term bridge; refi at stabilization.
Rent comps 3 comps
| Address | Beds | Baths | Sqft | Rent | $/sqft | DOM | Units | Dist |
|---|---|---|---|---|---|---|---|---|
| 27 Shrewsbury Dr Monmouth Beach, NJ | 3.0 | 2.5 | 2757 | $20,000 | $7.25 | 1d | 1 | 1.25mi |
| 485 Joline Ave Unit 2 Long Branch, NJ | 3.0 | 2.0 | 2960 | $3,500 | $1.18 | 24d | 1 | 1.34mi |
| 17 Beach Rd Monmouth Beach, NJ | 4.0 | 3.0 | 2891 | $30,000 | $10.38 | 1d | 1 | 1.42mi |
Listing history 23 events
-
2026-06-18days on market $1,850,000 Active 13 DOM
-
2026-06-17pricedays on market $1,850,000 Active 12 DOM
-
2026-06-17days on market $1,775,000 Active 47 DOM
-
2026-06-16days on market $1,775,000 Active 46 DOM
-
2026-06-15days on market $1,775,000 Active 45 DOM
-
2026-06-13days on market $1,775,000 Active 43 DOM
-
2026-06-13days on market $1,775,000 Active 42 DOM
-
2026-06-09days on market $1,775,000 Active 39 DOM
-
2026-06-08pricedays on market $1,775,000 Active 38 DOM
-
2026-06-07days on market $1,849,000 Active 37 DOM
-
2026-06-04days on market $1,849,000 Active 34 DOM
-
2026-06-03days on market $1,849,000 Active 33 DOM
-
2026-06-02days on market $1,849,000 Active 32 DOM
-
2026-06-01days on market $1,849,000 Active 31 DOM
-
2026-05-31days on market $1,849,000 Active 30 DOM
-
2026-05-19price $1,849,000
-
2026-05-01$1,950,000 Active
-
2026-04-28historical $1,950,000
-
2008-06-05soldstatus $900,000
-
2005-07-12soldstatus $917,500
-
1999-01-22soldstatus $228,500
-
1990-08-03soldstatus $185,000
-
1983-06-01soldstatus $84,000
ⓘ Source: listings_history table (triggers on properties + properties_extension) + one-shot
backfill from property_details.listing_events for pre-trigger history.
Tax reassessment forecast NJ · Partial reset (capped growth)
- Current annual tax
- $18,125 · $1,510/mo
- Projected year-2 tax
- $32,095 · $2,675/mo
- Expected delta
- +$13,970/yr (+$1,164/mo · 77.1%)
ⓘ Screening estimate from a state-policy table — verify with the county assessor before closing.
Climate risk First Street
- Flood 7/10 Severe FEMA zone AE · 96% chance over 30 yrs
- Wildfire 1/10 Low
- Heat 7/10 Severe 7 d/yr ≥93°F today · 16 d/yr by 30 yrs out
- Wind 8/10 Severe 80% chance of damaging wind over 30 yrs
- Air quality 3/10 Moderate 3 unhealthy d/yr today · 4 by 30 yrs out
Nearby sold comps map
Loading sold comps map…
Walkable amenities ~0.75 mi
Loading nearby amenities…
Taxation est. · year 1
- Rental income
- $210,317
- − Mortgage interest
- −$103,629
- − Property taxes
- −$18,125
- − Insurance
- −$14,775
- − Repairs & maintenance
- −$16,825
- − Management
- −$16,825
- − Depreciation
- −$53,818
- Taxable loss
- −$13,680
- Est. tax savings @ 24.0%
- +$3,283
- After-tax cash flow
- $20,115/yr
For passive investors: Depreciation is non-cash, so a rental often shows a tax loss while cash-flowing — sheltering income. Rental losses are passive: they offset passive income freely, and up to $25,000/yr can offset ordinary (W-2) income if you actively participate and your MAGI is under $100k (phasing out to $0 by $150k); unused losses carry forward. On sale, claimed depreciation is recaptured at up to 25%, and gains may owe capital-gains tax (a 1031 exchange can defer both). Figures are a year-1 estimate at your 24.0% rate — not tax advice; consult a CPA.
Schools (NCES district)
- District
- Oceanport School District
- NCES district ID
- 3412120
- Math proficiency
- 49% ▼ -18.00%
- Reading proficiency
- 57% ▼ -22.00%
- Median HH income
- $86,350
- Composite
- 48.72/100
- National rank
- #2099
- State rank
- #102 of 472 in NJ
Livability — Oceanport
- Score
- 73/100
- State rank
- #199
- US rank
- #5659
Category grades
Schools grade is shown separately in the Schools card above.
Census & demographics
- Census place
- Oceanport, NJ
- City population
- 6,130
- Population (ZIP)
- 6,130
Population outlook (Monmouth County) Hauer SSP2
- Today (2025)
- 620,308 people
- By 2030
- 612,309 · -1.3%
- By 2040
- 587,297 · -5.3%
- By 2050
- 551,342 · -11.1%
- By 2075
- 472,934 · -23.8%
- By 2100
- 381,534 · -38.5%
Race, ethnicity, and origin ACS 2023
- Neighborhood character
- Predominantly White (84%)
- Race & ethnicity
- White 84% Two or more races 8% Hispanic / Latino 5% Asian 3%
- Common ancestry
- Romanian 5% Subsaharan African 4% Scotch-Irish 2%
- Foreign-born
- 4% · Canada, South Korea
- Languages at home
- 92% English-only · Other Indo-European 3% Spanish 1% Korean 1%
Political lean MEDSL · Monmouth
- 2024 margin
- R (+11.4) · D 43.4% · R 54.8% · Other 1.8%
- 2008→2024 swing
- -7.7pp toward R · 2008: -3.7pp · 2024: -11.4pp
- All cycles
- 2024: R+11.4 2020: R+2.8 2016: R+9.5 2012: R+5.5 2008: R+3.7
Not yet ingested
- Civics
- —
Market trends
- HPI YoY
- ▼ -156.25%
- Current HPI
- 321.9243
- Rent YoY
- —
- Metro
- —
- State GDP YoY
- ▲ 2.05%
- F500 in state
- 34
Industry mix (Fortune 500 HQ in NJ)
| Industry | F500 HQs | Revenue |
|---|---|---|
| Consumer Goods | 3 | $31B |
|
||
| Pharmaceuticals | 2 | $153B |
|
||
| Technology | 2 | $21B |
|
||
| Insurance | 2 | $20B |
|
||
| Healthcare | 2 | $19B |
|
||
| Financial Services | 1 | $70B |
|
||
Price history
+2101.2% since first listed8 events — show timeline
- 2026-05-19 Price Changed $1,849,000 MOMLS
- 2026-05-01 Listed $1,950,000 MOMLS
- 2026-04-28 Coming Soon $1,950,000 MOMLS
- 2008-06-05 Sold (Public Records) $900,000 Public Records
- 2005-07-12 Sold (Public Records) $917,500 Public Records
- 1999-01-22 Sold (Public Records) $228,500 Public Records
- 1990-08-03 Sold (Public Records) $185,000 Public Records
- 1983-06-01 Sold (Public Records) $84,000 Public Records
Property tax history
+2.4%/yrLatest (2025): $18,125 · +5.4% YoY. Source: county tax records.
Cash-flow waterfall
monthlySold comps — $/sqft
last 12 mo · ≤1 miLoading sold comps…