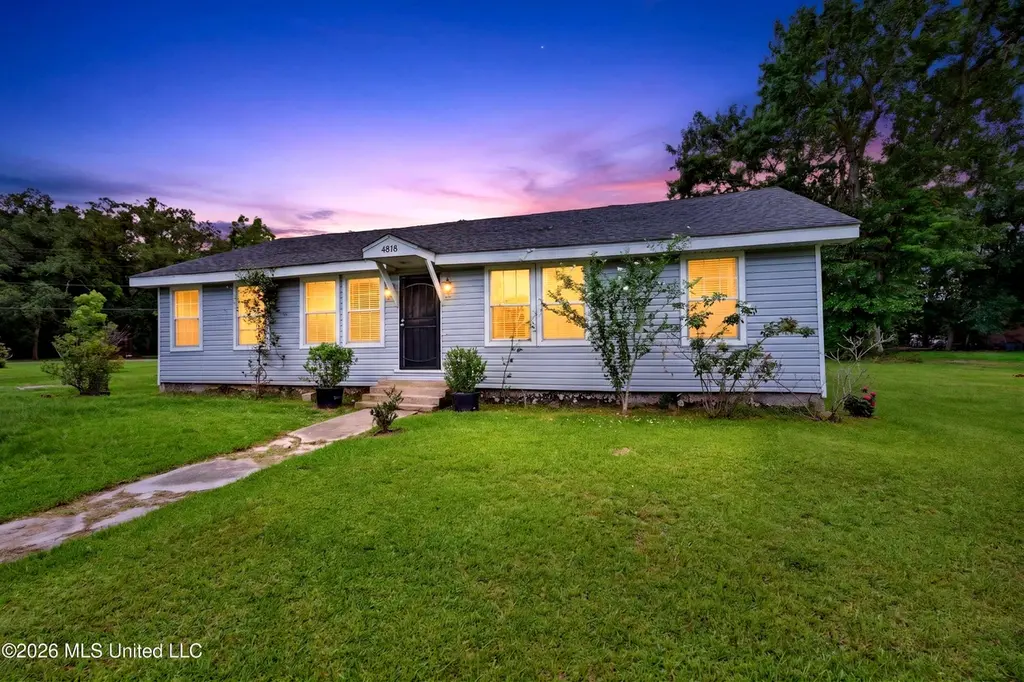
4818 Mcinnis Ave · Moss Point, MS
Flood risk 3/10 · Minor
- FEMA flood zone
- X (unshaded)
- Chance of flooding over 30 yrs
- 0.12%
- Est. flood insurance / yr
- $507 – $1,088
Fire risk 3/10 · Minor
- Est. fire insurance / yr
- $1,241 – $2,305
Heat risk 10/10 · Severe
- Hot days now (above 106°F)
- 7 days/yr
- Hot days in 30 yrs
- 22 days/yr
Wind risk 9/10 · Severe
- Chance of severe wind over 30 yrs
- 99.0%
Air-quality risk 3/10 · Minor
- Unhealthy air days now
- 2 days/yr
- Unhealthy air days in 30 yrs
- 3 days/yr
Risk factors via First Street. Map © Google.
Why this score? — see what drove the C grade
The composite is a weighted blend of 9 inputs, each scored 0–100. Each bar is that input's sub-score; the figure is the points it added to the 100-point composite (weight × sub-score).
- Cash flow +23.1/30.0
- DSCR +7.4/10.0
- Appreciation +7.3/10.0
- 1% rule +6.5/10.0
- ARV discount +3.5/15.0
- Livability +3.4/5.0
- Rent growth +2.5/5.0
- Condition / age +2.5/5.0
- Schools +1.6/10.0
$120,000
🖨 Deal sheet 📄 Offer letter ✓ Due diligence
Listing remarks MLS
Endless possibilities! Very spacious home with an open kitchen and 2 living areas. BRAND NEW 5 Ton HVAC installed August 2024. Includes warranty on the HVAC unit. Lean-to carport with a detached 14' x 36' shed. This property is situated on a corner lot on over 1/2 acre. CASH, conventional or renovation loan available. Very affordable and in a good area. Seller is selling property as is, where is. Step inside and let this home win you over! Don't miss out on this one!
Key facts
- Not in a flood zone
- Two living areas
- Corner lot
Tags
Property features AI
Finance
- Other: Estimated living/building area: 2,450 (source: estimated); Lot size about 0.59 acres (approx. 25,700 sq ft) with dimensions 345.52 x 203.10 x 264.24; Property is listed as move-in ready
Exterior
- Parking: Other parking
- Utilities: Public water; Public sewer; Electricity connected; Sewer connected; Water connected
- Home design: Single family residence; One level
- Construction: Siding exterior; Slab foundation; Shingle roof; Estimated year built
- Exterior features: Corner lot; Shed(s); Other exterior features
Interior
- Kitchen: Refrigerator
- Flooring: Ceramic tile; Concrete; Wood
- Bathrooms: 2 full bathrooms
- Heating & cooling: Heating present (type: Other); Cooling present (type: Other)
- Interior features: Move-in ready condition; Refrigerator; Washer and dryer
- Laundry & utility: Washer and dryer
Neighborhood map
What this means for you Summary
Snapshot
- This is a 3-bed/2.0-bath single-family listed at $120k.
Deal economics
- At list price, monthly cash flow is $216 ($3k/yr) — positive.
- The deal already cash-flows at list — no discount required.
- Meets the 1% rule at list price ($1k rent vs $120k).
- Cap rate 8.5% vs local median 6.8% in Moss Point — meaningfully above typical; check what's discounted (condition, days-on-market, listing class) to confirm the premium yield is real.
Location & tenants
- Location reads 67/100 on livability (#77 in MS) — a middle-class / working-renter tenant base. Strengths: cost of living A+, housing A+, crime A-; Watch: health & safety D+, schools D, amenities F.
- Moss Point Separate School District (suburban): math 17% / reading 22% proficiency, ranked #94 of 130 in MS (top 72%) — low school quality limits family demand, transient renter base, plan for 1-2y turnover; 83% free/reduced lunch — lower-income household profile, screen leases tightly.
- Market conditions: 86 active listings in the ZIP; 2 comparable units currently listed for rent nearby; 516 units permitted in Jackson County in 2024 (6 in 5+ unit buildings).
Forward outlook
- In year one you build about $6k of equity ($830 loan paydown + $6k appreciation (4.6% local appreciation)).
- At projected returns (4.6% appreciation + 3.0% rent growth), your $34k cash investment doubles in ~4 years — after that, you're playing with house money.
- By year 6, paydown + projected appreciation supports a ~$34k cash-out refi (75% LTV) — recoverable capital for the next deal without selling this one.
Negotiation context
- Only 3 days on market — expect competitive offers; lowballing is unlikely to land.
- 4 sale attempts since 7y ago with the ask held roughly flat each time — persistent listings suggest the price (not the market) is what's stuck; bring a comps-based counter.
Risks & watch-outs
- Watch-outs: built in 1938 — expect roof / HVAC / electrical / plumbing capex.
- Climate carrying-cost: severe wind risk, 99% chance of damaging wind over 30y; extreme-heat days projected 7→22/yr by 2055 (HVAC capex compounding) — expect insurance premiums to compound above CPI over the hold.
Questions for the listing agent
- Built in 1938 — when were the roof, HVAC, electrical panel, plumbing, and water heater last replaced?
- Is there a deadline driving the sale (1031 exchange, divorce, estate, relocation)? That informs how much negotiation room exists.
- Schools are D-rated, which usually means shorter tenancies and higher turnover. Who's the typical renter profile here, and what's been the actual vacancy rate?
- What's the average days-on-market for RENTAL listings here right now (not sales)? A rising rental-DOM trend means longer vacancies and softer asking-rent achievability than the comps imply.
- What's the recent tenant-quality profile in this submarket — average credit score on applications, eviction rate, late-payment / NSF rate, and stable-employment percentage? A property-management company in the area should have these aggregated.
- How much new for-sale + rental construction is in the pipeline within 1–3 miles? Heavy new supply typically softens prices + rents 12–24 months out; constrained supply supports both.
Investment metrics
- 1% rule
- 1.15% ✓
- Cap rate
- 8.45%
- Cash-on-cash
- 7.71%
- DSCR
- 1.34
- GRM
- 7.3
CMA / ARV
- ARV (on-the-fly)
- $110,250
- Comps found
- 3
Show comp detail 3 sales within ~0.75 mi
| Address | Dist | Beds/Ba | Sqft | Sold | Price | $/sf | Match |
|---|---|---|---|---|---|---|---|
| 4818 Mcinnis Ave | 0.00mi | 3/2.0 | 2,450 (0%) | 19mo | $110,000 | $45 | 84 |
| 4230 Martin Luther King Blvd | 0.64mi | 4/2.0 (+1) | 2,241 (-8%) | 3mo | $75,000 | $33 | 49 |
| 4430 Mcinnis Ave | 0.54mi | 4/3.0 (+1) | 2,692 (+10%) | 23mo | $145,000 | $54 | 30 |
Match score weights: distance 35% · size 25% · config 20% · recency 20%. Top-matched comps best support the ARV.
Projected returns pro-forma
4.6% appreciation · 3.0% rent growth · sell at horizon
- IRR
- 18.6%
- Equity multiple
- 2.15×
- Total profit
- $38,740
- Equity at exit
- $65,121
- IRR
- 18.8%
- Equity multiple
- 4.18×
- Total profit
- $106,686
- Equity at exit
- $110,077
Cash invested: $33,600 (down + closing). Projections, not guarantees.
Landlord ↔ Tenant lean methodology
- Overall (STATE)
- 90 Strongly Landlord-Friendly
- State Mississippi
- 90 Strongly Landlord-Friendly · R+11
- County
- — inherits STATE
- City
- — inherits STATE
ZIP-level market 39563
- Home prices YoY
- 3.0%
- Active inventory
- 86
- Price-to-rent
- 7.3×
Monthly cashflow live
- Estimated rent
- $1,379 medium interval (Pro) →
- Mortgage (P&I)
- −$629
- Tax from tax record
- −$194 /mo · $2,329/yr
- Insurance
- −$50
- HOA
- −$0
- Vacancy / Maint / Mgmt
- −$290
- Net cashflow
- $216
Break-even live
UW: 25.0% down · 7.5% · 30yr · 1.5% tax · 5.0% vac · 8.0% maint · 8.0% mgmt
Financing live
Cash to close
- Down payment
- $30,000
- Closing costs
- $3,600
- Reserves months
- —
- Total cash needed
- —
Loan-product check · same deal, 3 products live
Conventional
25% down · 7.5% · 30yr
- Down + closing
- —
- Monthly P&I
- —
- Monthly cashflow
- —
- DSCR
- —
- Eligible?
- —
Personal DTI + credit; lowest rate.
DSCR
20% down · 8.5% · 30yr
- Down + closing
- —
- Monthly P&I
- —
- Monthly cashflow
- —
- DSCR
- —
- Eligible?
- —
No personal income docs; deal must DSCR.
Hard money
10% down · 12.0% · 12mo
- Down + closing
- —
- Monthly P&I
- —
- Monthly cashflow
- —
- DSCR
- —
- Eligible?
- —
Short-term bridge; refi at stabilization.
Rent comps 2 comps
| Address | Beds | Baths | Sqft | Rent | $/sqft | DOM | Units | Dist |
|---|---|---|---|---|---|---|---|---|
| 5443 Hubert St Moss Point, MS | 3.0 | 2.0 | 1750 | $1,300 | $0.74 | 21d | 1 | 0.89mi |
| 3395 Howze St Moss Point, MS | 3.0 | 2.0 | 1868 | $1,500 | $0.80 | 21d | 1 | 1.46mi |
Listing history 3 events
-
2026-06-13statusdays on market $120,000 Pending 3 DOM
-
2026-06-10remarks 266-char remark
-
2026-06-10$120,000 Active 1 DOM
ⓘ Source: listings_history table (triggers on properties + properties_extension) + one-shot
backfill from property_details.listing_events for pre-trigger history.
Tax reassessment forecast MS · Resets to sale price
- Current annual tax
- $2,329 · $194/mo
- Projected year-2 tax
- $2,329 · $194/mo
- Expected delta
- $0/yr ($0/mo · 0.0%)
ⓘ Screening estimate from a state-policy table — verify with the county assessor before closing.
Climate risk First Street
- Flood 3/10 Moderate FEMA zone X (unshaded) · 12% chance over 30 yrs
- Wildfire 3/10 Moderate
- Heat 10/10 Extreme 7 d/yr ≥106°F today · 22 d/yr by 30 yrs out
- Wind 9/10 Extreme 99% chance of damaging wind over 30 yrs
- Air quality 3/10 Moderate 2 unhealthy d/yr today · 3 by 30 yrs out
Nearby sold comps map
Loading sold comps map…
Walkable amenities ~0.75 mi
Loading nearby amenities…
Taxation est. · year 1
- Rental income
- $16,544
- − Mortgage interest
- −$6,722
- − Property taxes
- −$2,329
- − Insurance
- −$600
- − Repairs & maintenance
- −$1,323
- − Management
- −$1,323
- − Depreciation
- −$3,491
- Taxable income
- $755
- Est. tax owed @ 24.0%
- −$181
- After-tax cash flow
- $2,408/yr
For passive investors: Depreciation is non-cash, so a rental often shows a tax loss while cash-flowing — sheltering income. Rental losses are passive: they offset passive income freely, and up to $25,000/yr can offset ordinary (W-2) income if you actively participate and your MAGI is under $100k (phasing out to $0 by $150k); unused losses carry forward. On sale, claimed depreciation is recaptured at up to 25%, and gains may owe capital-gains tax (a 1031 exchange can defer both). Figures are a year-1 estimate at your 24.0% rate — not tax advice; consult a CPA.
Schools (NCES district)
- District
- Moss Point Separate School District
- NCES district ID
- 2803000
- Math proficiency
- 17% ▼ -3.00%
- Reading proficiency
- 22% ▬ 0.00%
- Median HH income
- $38,041
- Composite
- 16.34/100
- National rank
- #9205
- State rank
- #94 of 130 in MS
Livability — Moss Point
- Score
- 67/100
- State rank
- #77
- US rank
- #10398
Category grades
Schools grade is shown separately in the Schools card above.
Census & demographics
- Census place
- Moss Point, MS
- City population
- 12,023
- Population (ZIP)
- 12,023
Population outlook (Jackson County) Hauer SSP2
- Today (2025)
- 146,926 people
- By 2030
- 148,442 · +1.0%
- By 2040
- 149,631 · +1.8%
- By 2050
- 148,723 · +1.2%
- By 2075
- 147,845 · +0.6%
- By 2100
- 144,510 · -1.6%
Race, ethnicity, and origin ACS 2023
- Neighborhood character
- Predominantly Black (74%)
- Race & ethnicity
- Black 74% White 18% Hispanic / Latino 4% Two or more races 2%
- Common ancestry
- Lithuanian 0%
- Foreign-born
- 1% · Canada
- Languages at home
- 97% English-only · Spanish 3%
Political lean MEDSL · Jackson
- 2024 margin
- Solid R (+39.9) · D 29.5% · R 69.4% · Other 1.1%
- 2008→2024 swing
- -6.4pp toward R · 2008: -33.5pp · 2024: -39.9pp
- All cycles
- 2024: R+39.9 2020: R+34.6 2016: R+39.9 2012: R+36.1 2008: R+33.5
Not yet ingested
- Civics
- —
Market trends
- HPI YoY
- ▲ 4.60%
- Current HPI
- 155.3138
- Rent YoY
- —
- Metro
- —
- State GDP YoY
- —
- F500 in state
- 0
Price history
+166.7% since first listed12 events — show timeline
- 2026-06-09 Listed $120,000 MLSU
- 2024-12-03 Sold (Public Records) — Public Records
- 2024-11-22 Sold (MLS) — MLSU
- 2024-10-12 Pending — MLSU
- 2024-10-04 Listed $110,000 MLSU
- 2024-08-07 Sold (Public Records) — Public Records
- 2024-04-19 Listing Removed — MLSU
- 2024-04-09 Price Changed $125,000 MLSU
- 2024-03-26 Listed $130,000 MLSU
- 2020-03-06 Sold (Public Records) — Public Records
- 2020-03-03 Sold (MLS) — MLSU
- 2019-03-11 Listed $45,000 MLSU
Property tax history
+22.6%/yrLatest (2025): $2,329 · +58852.7% YoY. Source: county tax records.
Cash-flow waterfall
monthlySold comps — $/sqft
last 12 mo · ≤1 miLoading sold comps…