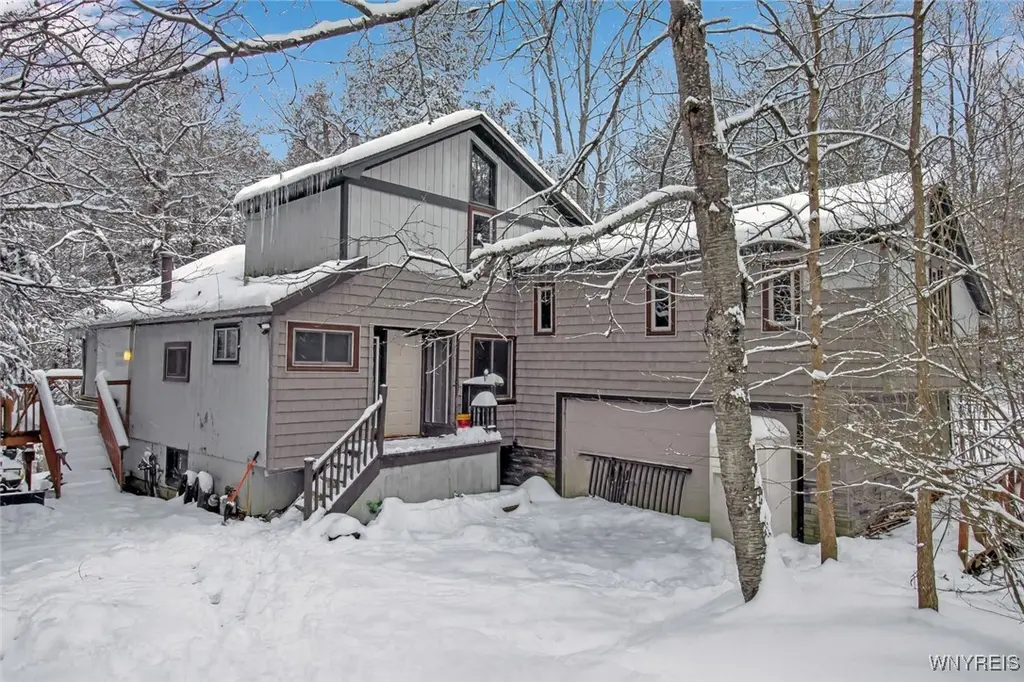
76 Tarn Trl · Holland, NY
Flood risk 1/10 · Minimal
- FEMA flood zone
- X (unshaded)
- Chance of flooding over 30 yrs
- 0.0%
- Est. flood insurance / yr
- $473 – $860
Fire risk 1/10 · Minimal
- Est. fire insurance / yr
- $691 – $1,283
Heat risk 1/10 · Minimal
- Hot days now (above 89°F)
- 7 days/yr
- Hot days in 30 yrs
- 16 days/yr
Wind risk 1/10 · Minimal
- Chance of severe wind over 30 yrs
- —
Air-quality risk 2/10 · Minimal
- Unhealthy air days now
- 0 days/yr
- Unhealthy air days in 30 yrs
- 1 days/yr
Risk factors via First Street. Map © Google.
Why this score? — see what drove the A- grade
The composite is a weighted blend of 9 inputs, each scored 0–100. Each bar is that input's sub-score; the figure is the points it added to the 100-point composite (weight × sub-score).
- Cash flow +30.0/30.0
- ARV discount +15.0/15.0
- 1% rule +10.0/10.0
- DSCR +10.0/10.0
- Appreciation +6.1/10.0
- Schools +4.3/10.0
- Livability +3.0/5.0
- Rent growth +2.5/5.0
- Condition / age +2.5/5.0
$199,900
🖨 Deal sheet 📄 Offer letter ✓ Due diligence
Listing remarks MLS
Opportunity awaits at 76 Tarn Trail, a contemporary home set on a wooded and secluded lot directly across from Kissing Bridge Ski Resort. This property is in need of renovations and is being sold as is, making it an ideal project for investors, contractors, or buyers looking to take on a rehab project. The home features a large footprint and an open layout potential, with multiple levels and expansive deck areas that once took advantage of the surrounding woodland setting. The setting remains a standout, offering privacy, natural views, and proximity to outdoor recreation including skiing, hiking, and Sprague Brook Park. This is a true value add opportunity for the right buyer with vision. Bring your contractor and imagination to restore or reimagine this property in a prime four season recreational location.
Key facts
- Wooded lot
- Natural views
- Secluded lot
Tags
Neighborhood map
What this means for you Summary
Snapshot
- This is a 4-bed/3.5-bath single-family listed at $200k.
Deal economics
- At list price, monthly cash flow is $1k ($14k/yr) — positive.
- The deal already cash-flows at list — no discount required.
- Meets the 1% rule at list price ($4k rent vs $200k).
- Recommended offer: $176k (12.0% below list) — sets the bar for market timing.
- Cap rate 13.2% vs local median 1.7% in Holland — top-decile yield for the area; either an underpriced asset or a hidden risk that comps aren't pricing in. Stress-test before assuming the spread holds.
Location & tenants
- Location reads 59/100 on livability (#1,016 in NY) — a working-class tenant base; expect higher turnover. Strengths: crime A, cost of living A, housing A; Watch: schools C-, amenities F, commute F.
- Springville-Griffith Institute Central School District (town): math 47% / reading 52% proficiency, ranked #385 of 590 in NY (top 65%) — families likely to look elsewhere, expect single-tenant / working-renter base with shorter leases.
- Market conditions: 4 active listings in the ZIP; 1 comparable units currently listed for rent nearby; 1,244 units permitted in Erie County in 2024 (563 in 5+ unit buildings).
Forward outlook
- In year one you build about $6k of equity ($1k loan paydown + $4k appreciation (2.2% local appreciation)).
- At projected returns (2.2% appreciation + 3.0% rent growth), your $56k cash investment doubles in ~3 years — after that, you're playing with house money.
- By year 6, paydown + projected appreciation supports a ~$31k cash-out refi (75% LTV) — recoverable capital for the next deal without selling this one.
Negotiation context
- It's been on market 170 days — a 12% lower offer ($176k) is reasonable based on typical stale-listing flexibility.
- 5 sale attempts since 14y ago; this cycle's ask has dropped $25k (11%) from the opening price — seller is motivated, your offer sets the floor, not the list.
- Current owner paid $148k; 35% above their basis — modest negotiation headroom, anchor on the comps not their cost.
Risks & watch-outs
- Watch-outs: property tax is 3.8% of price.
Questions for the listing agent
- It's been on market 170 days. Have you received any prior offers? Is the seller open to a 12% concession, seller financing, or rate buy-down credit?
- Built in 1971 — when were the roof, HVAC, electrical panel, plumbing, and water heater last replaced?
- Property tax is high relative to price — has the assessment been appealed recently, and will the sale trigger a re-assessment?
- What does the HOA fee cover, when was the last increase, and are there any pending special assessments or reserve-fund shortfalls?
- Why hasn't it sold? Are there any deal-killer items the seller is aware of (foundation, flood, title, zoning, code violations)?
- Is there a deadline driving the sale (1031 exchange, divorce, estate, relocation)? That informs how much negotiation room exists.
- What's the average days-on-market for RENTAL listings here right now (not sales)? A rising rental-DOM trend means longer vacancies and softer asking-rent achievability than the comps imply.
- What's the recent tenant-quality profile in this submarket — average credit score on applications, eviction rate, late-payment / NSF rate, and stable-employment percentage? A property-management company in the area should have these aggregated.
- How much new for-sale + rental construction is in the pipeline within 1–3 miles? Heavy new supply typically softens prices + rents 12–24 months out; constrained supply supports both.
Investment metrics
- 1% rule
- 1.88% ✓
- Cap rate
- 13.25%
- Cash-on-cash
- 24.84%
- DSCR
- 2.11
- GRM
- 4.4
CMA / ARV
- ARV (median comp)
- $395,844
- List price
- $199,900
- Delta
- -49.50%
- Verdict
- UNDERPRICED
- Comps
- 18 within 1.0 mi
Show comp detail 2 sales within ~0.75 mi
| Address | Dist | Beds/Ba | Sqft | Sold | Price | $/sf | Match |
|---|---|---|---|---|---|---|---|
| 7 Woodstock Rd | 0.25mi | 5/3.0 (+1) | 2,460 (+15%) | 10mo | $395,000 | $161 | 48 |
| 9386 Crane Rd | 0.29mi | 3/2.0 (-1) | 1,892 (-12%) | 17mo | $250,000 | $132 | 42 |
Match score weights: distance 35% · size 25% · config 20% · recency 20%. Top-matched comps best support the ARV.
Projected returns pro-forma
2.24% appreciation · 3.0% rent growth · sell at horizon
- IRR
- 29.6%
- Equity multiple
- 2.61×
- Total profit
- $90,270
- Equity at exit
- $81,458
- IRR
- 30.8%
- Equity multiple
- 5.08×
- Total profit
- $228,564
- Equity at exit
- $119,342
Cash invested: $55,972 (down + closing). Projections, not guarantees.
Landlord ↔ Tenant lean methodology
- Overall (STATE)
- 15 Strongly Tenant-Friendly
- State New York
- 15 Strongly Tenant-Friendly · D+10
- County
- — inherits STATE
- City
- — inherits STATE
ZIP-level market 14069
- Home prices YoY
- 0.7%
- Active inventory
- 4
- Price-to-rent
- 4.4×
Monthly cashflow live
- Estimated rent
- $3,750 medium interval (Pro) →
- Mortgage (P&I)
- −$1,048
- Tax from tax record
- −$626 /mo · $7,516/yr
- Insurance
- −$83
- HOA
- −$46
- Vacancy / Maint / Mgmt
- −$788
- Net cashflow
- $1,159
Break-even live
UW: 25.0% down · 7.5% · 30yr · 1.5% tax · 5.0% vac · 8.0% maint · 8.0% mgmt
Financing live
Cash to close
- Down payment
- $49,975
- Closing costs
- $5,997
- Reserves months
- —
- Total cash needed
- —
Loan-product check · same deal, 3 products live
Conventional
25% down · 7.5% · 30yr
- Down + closing
- —
- Monthly P&I
- —
- Monthly cashflow
- —
- DSCR
- —
- Eligible?
- —
Personal DTI + credit; lowest rate.
DSCR
20% down · 8.5% · 30yr
- Down + closing
- —
- Monthly P&I
- —
- Monthly cashflow
- —
- DSCR
- —
- Eligible?
- —
No personal income docs; deal must DSCR.
Hard money
10% down · 12.0% · 12mo
- Down + closing
- —
- Monthly P&I
- —
- Monthly cashflow
- —
- DSCR
- —
- Eligible?
- —
Short-term bridge; refi at stabilization.
Rent comps 1 comps
| Address | Beds | Baths | Sqft | Rent | $/sqft | DOM | Units | Dist |
|---|---|---|---|---|---|---|---|---|
| 33 Woodstock Rd Glenwood, NY | 5.0 | 2.0 | 2718 | $3,750 | $1.38 | 3d | 1 | 0.17mi |
HOA detail
- Monthly dues
- $46 · $552/yr
Listing history 11 events
-
2026-06-01days on market $199,900 Active 170 DOM
-
2026-05-31days on market $199,900 Active 169 DOM
-
2026-02-12price $199,900 820-char remark
Show marketing remark (820 chars)
Opportunity awaits at 76 Tarn Trail, a contemporary home set on a wooded and secluded lot directly across from Kissing Bridge Ski Resort. This property is in need of renovations and is being sold as is, making it an ideal project for investors, contractors, or buyers looking to take on a rehab project. The home features a large footprint and an open layout potential, with multiple levels and expansive deck areas that once took advantage of the surrounding woodland setting. The setting remains a standout, offering privacy, natural views, and proximity to outdoor recreation including skiing, hiking, and Sprague Brook Park. This is a true value add opportunity for the right buyer with vision. Bring your contractor and imagination to restore or reimagine this property in a prime four season recreational location.
-
2025-12-13$224,900 Active 820-char remark
Show marketing remark (820 chars)
Opportunity awaits at 76 Tarn Trail, a contemporary home set on a wooded and secluded lot directly across from Kissing Bridge Ski Resort. This property is in need of renovations and is being sold as is, making it an ideal project for investors, contractors, or buyers looking to take on a rehab project. The home features a large footprint and an open layout potential, with multiple levels and expansive deck areas that once took advantage of the surrounding woodland setting. The setting remains a standout, offering privacy, natural views, and proximity to outdoor recreation including skiing, hiking, and Sprague Brook Park. This is a true value add opportunity for the right buyer with vision. Bring your contractor and imagination to restore or reimagine this property in a prime four season recreational location.
-
2012-10-31$144,900
-
2012-10-31$1,600
-
2012-10-19$1,600
-
2012-04-30$149,900
-
2007-12-21soldstatus $148,320
-
2005-03-28soldstatus $82,000
-
1997-10-29soldstatus $115,000
ⓘ Source: listings_history table (triggers on properties + properties_extension) + one-shot
backfill from property_details.listing_events for pre-trigger history.
Tax reassessment forecast NY · Partial reset (capped growth)
- Current annual tax
- $7,516 · $626/mo
- Projected year-2 tax
- $7,516 · $626/mo
- Expected delta
- $0/yr ($0/mo · 0.0%)
ⓘ Screening estimate from a state-policy table — verify with the county assessor before closing.
Climate risk First Street
- Flood 1/10 Low FEMA zone X (unshaded) · 0% chance over 30 yrs
- Wildfire 1/10 Low
- Heat 1/10 Low 7 d/yr ≥89°F today · 16 d/yr by 30 yrs out
- Wind 1/10 Low
- Air quality 2/10 Low 0 unhealthy d/yr today · 1 by 30 yrs out
Nearby sold comps map
Loading sold comps map…
Walkable amenities ~0.75 mi
Loading nearby amenities…
Taxation est. · year 1
- Rental income
- $45,000
- − Mortgage interest
- −$11,198
- − Property taxes
- −$7,516
- − Insurance
- −$1,000
- − Repairs & maintenance
- −$3,600
- − Management
- −$3,600
- − HOA
- −$552
- − Depreciation
- −$5,815
- Taxable income
- $11,720
- Est. tax owed @ 24.0%
- −$2,813
- After-tax cash flow
- $11,090/yr
For passive investors: Depreciation is non-cash, so a rental often shows a tax loss while cash-flowing — sheltering income. Rental losses are passive: they offset passive income freely, and up to $25,000/yr can offset ordinary (W-2) income if you actively participate and your MAGI is under $100k (phasing out to $0 by $150k); unused losses carry forward. On sale, claimed depreciation is recaptured at up to 25%, and gains may owe capital-gains tax (a 1031 exchange can defer both). Figures are a year-1 estimate at your 24.0% rate — not tax advice; consult a CPA.
Schools (NCES district)
- District
- Springville-Griffith Institute Central School District
- NCES district ID
- 3612990
- Math proficiency
- 47% ▼ -15.00%
- Reading proficiency
- 52% ▲ 7.00%
- Median HH income
- $53,569
- Composite
- 42.7/100
- National rank
- #3170
- State rank
- #385 of 590 in NY
Livability — Holland
- Score
- 59/100
- State rank
- #1016
- US rank
- #19853
Category grades
Schools grade is shown separately in the Schools card above.
Census & demographics
- City population
- 4,434
- Population (ZIP)
- 492
Population outlook (Erie County) Hauer SSP2
- Today (2025)
- 933,037 people
- By 2030
- 935,181 · +0.2%
- By 2040
- 928,531 · -0.5%
- By 2050
- 905,725 · -2.9%
- By 2075
- 834,037 · -10.6%
- By 2100
- 708,033 · -24.1%
Race, ethnicity, and origin ACS 2023
- Neighborhood character
- Predominantly White (88%)
- Race & ethnicity
- White 88% Two or more races 11% Hispanic / Latino 4%
- Common ancestry
- Romanian 12% Slovak 4% Iranian 2%
- Foreign-born
- 3% · Canada
- Languages at home
- 96% English-only · Spanish 4%
Political lean MEDSL · Erie
- 2024 margin
- Lean D (+9.7) · D 54.8% · R 45.2%
- 2008→2024 swing
- -7.9pp toward R · 2008: 17.5pp · 2024: 9.7pp
- All cycles
- 2024: D+9.7 2020: D+14.7 2016: D+4.8 2012: D+15.6 2008: D+17.5
Not yet ingested
- Civics
- —
Market trends
- HPI YoY
- ▲ 2.24%
- Current HPI
- 310.293
- Rent YoY
- —
- Metro
- —
- State GDP YoY
- ▲ 2.60%
- F500 in state
- 92
Industry mix (Fortune 500 HQ in NY)
| Industry | F500 HQs | Revenue |
|---|---|---|
| Financial Services | 10 | $950B |
|
||
| Consumer Goods | 9 | $162B |
|
||
| Insurance | 4 | $225B |
|
||
| Telecommunications | 2 | $144B |
|
||
| Pharmaceuticals | 2 | $112B |
|
||
| Media / Entertainment | 2 | $69B |
|
||
Price history
+73.8% since first listed9 events — show timeline
- 2026-02-12 Price Changed $199,900 WNYREIS
- 2025-12-13 Listed $224,900 WNYREIS
- 2012-10-31 Listed $1,600 WNYREIS
- 2012-10-31 Listed $144,900 WNYREIS
- 2012-10-19 Listed $1,600 WNYREIS
- 2012-04-30 Listed $149,900 WNYREIS
- 2007-12-21 Sold (Public Records) $148,320 Public Records
- 2005-03-28 Sold (Public Records) $82,000 Public Records
- 1997-10-29 Sold (Public Records) $115,000 Public Records
Property tax history
+1.3%/yrLatest (2025): $7,516 · +3.9% YoY. Source: county tax records.
Cash-flow waterfall
monthlySold comps — $/sqft
last 12 mo · ≤1 miLoading sold comps…