6800 Placida Rd · Rotonda, FL
Flood risk 10/10 · Severe
- FEMA flood zone
- AE
- Chance of flooding over 30 yrs
- 0.99%
- Est. flood insurance / yr
- $1,737 – $8,500
Fire risk 1/10 · Minimal
- Est. fire insurance / yr
- $947 – $1,759
Heat risk 10/10 · Severe
- Hot days now (above 107°F)
- 6 days/yr
- Hot days in 30 yrs
- 24 days/yr
Wind risk 10/10 · Severe
- Chance of severe wind over 30 yrs
- 99.0%
Air-quality risk 2/10 · Minimal
- Unhealthy air days now
- 1 days/yr
- Unhealthy air days in 30 yrs
- 1 days/yr
Risk factors via First Street. Map © Google.
Why this score? — see what drove the D grade
The composite is a weighted blend of 9 inputs, each scored 0–100. Each bar is that input's sub-score; the figure is the points it added to the 100-point composite (weight × sub-score).
- Cash flow +11.7/30.0
- ARV discount +7.5/15.0
- 1% rule +5.9/10.0
- Schools +4.6/10.0
- DSCR +3.4/10.0
- Livability +3.4/5.0
- Rent growth +2.5/5.0
- Condition / age +2.5/5.0
- Appreciation +0.0/10.0
$126,000
🖨 Deal sheet 📄 Offer letter ✓ Due diligence
Listing remarks MLS
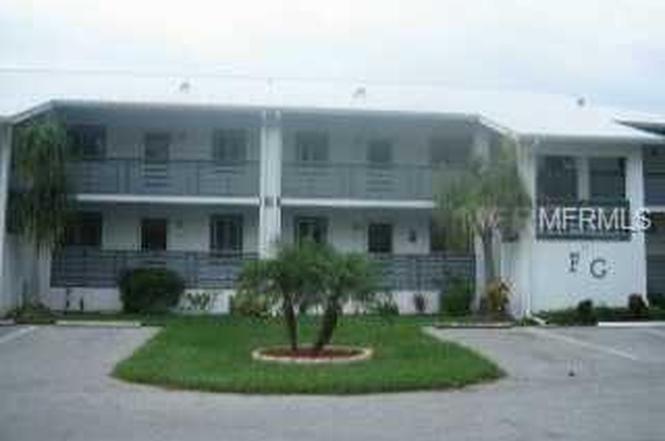
Picturesque view of pond from front of condo and peaceful wooded setting to the rear. This 2 bedroom unit is beautifully furnished and features tile floors, a mirrored dry bar, walk-in-closet, eat-in-kitchen and vinyl enclosed sun room. Fiddlers Green offers a heated community pool, tennis, shuffleboard, tennis, exercise room, BBQ area and more. It`s located near area beaches, schools, shopping, fishing and over 25 golf courses. Experience Florida living at its best! Immediate occupancy.
Key facts
- Large storage closet
- Walk in closets
- New roof
Tags
Neighborhood map
What this means for you Summary
Snapshot
- This is a 2-bed/2.0-bath condo listed at $126k.
Deal economics
- At list price, monthly cash flow is $-464 ($-6k/yr) — negative.
- To cash-flow at today's rent, offer at most $95k (24.9% below list).
- Meets the 1% rule at list price ($1k rent vs $126k).
- Recommended offer: $95k (24.9% below list) — sets the bar for cash-flow.
- Cap rate 5.9% vs local median 3.1% in Rotonda — top-decile yield for the area; either an underpriced asset or a hidden risk that comps aren't pricing in. Stress-test before assuming the spread holds.
Location & tenants
- Location reads 67/100 on livability (#548 in FL) — a middle-class / working-renter tenant base. Strengths: crime A+, housing A-, cost of living B+; Watch: schools D, amenities F, commute F.
- Charlotte (suburban): math 54% / reading 54% proficiency, ranked #22 of 73 in FL (top 30%) — acceptable for families but not a draw, mixed tenant base, ~2y average lease.
- Market conditions: Rents soft (-0.1%/yr); 734 active listings in the ZIP; 4,585 units permitted in Charlotte County in 2024 (703 in 5+ unit buildings).
Forward outlook
- Local home prices are declining (-3.0%/yr); year-one equity from $871 of loan paydown is wiped out by about $4k of value loss. Plan a longer hold.
- Charlotte County population projected at +24% by 2050 — long-run rental-demand tailwind backs the buy-and-hold thesis.
Negotiation context
- It's been on market 133 days — a 12% lower offer ($111k) is reasonable based on typical stale-listing flexibility.
- 13 sale attempts since 22y ago; this cycle's ask has dropped $14k (10%) from the opening price — seller is motivated, your offer sets the floor, not the list.
Risks & watch-outs
- Watch-outs: flood insurance adds $427/mo.
- Climate carrying-cost: in FEMA flood zone AE (mandatory federal flood insurance); severe wind risk, 99% chance of damaging wind over 30y; extreme-heat days projected 6→24/yr by 2055 (HVAC capex compounding) — expect insurance premiums to compound above CPI over the hold.
Questions for the listing agent
- What do current leases actually rent for vs. the listed asking? Can we see a recent rent roll and the last 12 months of T-12 income?
- It's been on market 133 days. Have you received any prior offers? Is the seller open to a 25% concession, seller financing, or rate buy-down credit?
- What's the actual annual flood-insurance premium (NFIP or private), and is the property in a SFHA with mandatory coverage?
- What does the HOA fee cover, when was the last increase, and are there any pending special assessments or reserve-fund shortfalls?
- Any open or pending special assessments — roof, HVAC, plumbing, elevator, façade? What's the per-unit balance and payoff schedule, and is the seller paying it off at close or rolling it to the buyer?
- Why hasn't it sold? Are there any deal-killer items the seller is aware of (foundation, flood, title, zoning, code violations)?
- Is there a deadline driving the sale (1031 exchange, divorce, estate, relocation)? That informs how much negotiation room exists.
- Schools are D-rated, which usually means shorter tenancies and higher turnover. Who's the typical renter profile here, and what's been the actual vacancy rate?
- The area grade is low — what's the realistic commute time and amenity access for the typical tenant pool here? Any planned neighborhood developments (good or bad) we should know about?
- What's the average days-on-market for RENTAL listings here right now (not sales)? A rising rental-DOM trend means longer vacancies and softer asking-rent achievability than the comps imply.
- What's the recent tenant-quality profile in this submarket — average credit score on applications, eviction rate, late-payment / NSF rate, and stable-employment percentage? A property-management company in the area should have these aggregated.
- How much new apartment / multifamily construction is in the pipeline within 1–3 miles? Heavy new supply (>2% of stock underway) typically softens rents 12–24 months out; light construction supports rent growth.
Investment metrics
- 1% rule
- 1.09% ✓
- Cap rate
- 5.94%
- Cash-on-cash
- -1.27%
- DSCR
- 0.94
- GRM
- 7.7
CMA / ARV
No comps found within radius.
Projected returns pro-forma
-3.0% appreciation · 0.0% rent growth · sell at horizon
- IRR
- -54.6%
- Equity multiple
- -0.52×
- Total profit
- $-53,536
- Equity at exit
- $18,787
- IRR
- —
- Equity multiple
- -1.79×
- Total profit
- $-98,387
- Equity at exit
- $10,894
Cash invested: $35,280 (down + closing). Projections, not guarantees.
Landlord ↔ Tenant lean methodology
- Overall (STATE)
- 87 Strongly Landlord-Friendly
- State Florida
- 87 Strongly Landlord-Friendly · R+3
- County
- — inherits STATE
- City
- — inherits STATE
ZIP-level market 34224
- Home prices YoY
- -18.9%
- Rents YoY
- -0.1%
- Active inventory
- 734
- Price-to-rent
- 7.7×
Monthly cashflow live
- Estimated rent
- $1,368 medium interval (Pro) →
- Mortgage (P&I)
- −$661
- Tax est. 1.5%
- −$158 /mo · $1,890/yr
- Insurance
- −$52
- Flood insurance flood zone
- −$427 /mo · $5,118/yr
- HOA est. from 26 same-building comps
- −$247
- Vacancy / Maint / Mgmt
- −$287
- Net cashflow
- $-464
Break-even live
UW: 25.0% down · 7.5% · 30yr · 1.5% tax · 5.0% vac · 8.0% maint · 8.0% mgmt
Financing live
Cash to close
- Down payment
- $31,500
- Closing costs
- $3,780
- Reserves months
- —
- Total cash needed
- —
Loan-product check · same deal, 3 products live
Conventional
25% down · 7.5% · 30yr
- Down + closing
- —
- Monthly P&I
- —
- Monthly cashflow
- —
- DSCR
- —
- Eligible?
- —
Personal DTI + credit; lowest rate.
DSCR
20% down · 8.5% · 30yr
- Down + closing
- —
- Monthly P&I
- —
- Monthly cashflow
- —
- DSCR
- —
- Eligible?
- —
No personal income docs; deal must DSCR.
Hard money
10% down · 12.0% · 12mo
- Down + closing
- —
- Monthly P&I
- —
- Monthly cashflow
- —
- DSCR
- —
- Eligible?
- —
Short-term bridge; refi at stabilization.
HOA detail condo
- Monthly dues
- $0 · $0/yr
- Likely covers
- pool
- Assessments
- None detected in remarks — confirm with the listing agent.
Listing history 28 events
-
2026-06-02days on market $126,000 Active 133 DOM
-
2026-06-01days on market $126,000 Active 132 DOM
-
2026-05-31days on market $126,000 Active 131 DOM
-
2026-05-30days on market $126,000 Active 130 DOM
-
2026-03-07price $126,000
-
2026-01-20$139,900 Active
-
2025-08-18historical $3,300
-
2025-08-03$3,300
-
2025-08-01historical $1,300
-
2025-07-31$1,300
-
2025-07-25historical $1,300
-
2025-07-19$1,300
-
2025-01-16historical $3,000
-
2025-01-01$3,000
-
2025-01-01historical $3,000
-
2024-11-10$3,000
-
2008-04-23soldstatus $130,000 492-char remark
Show marketing remark (492 chars)
Picturesque view of pond from front of condo and peaceful wooded setting to the rear. This 2 bedroom unit is beautifully furnished and features tile floors, a mirrored dry bar, walk-in-closet, eat-in-kitchen and vinyl enclosed sun room. Fiddlers Green offers a heated community pool, tennis, shuffleboard, tennis, exercise room, BBQ area and more. It`s located near area beaches, schools, shopping, fishing and over 25 golf courses. Experience Florida living at its best! Immediate occupancy.
-
2007-10-25$145,000 492-char remark
Show marketing remark (492 chars)
Picturesque view of pond from front of condo and peaceful wooded setting to the rear. This 2 bedroom unit is beautifully furnished and features tile floors, a mirrored dry bar, walk-in-closet, eat-in-kitchen and vinyl enclosed sun room. Fiddlers Green offers a heated community pool, tennis, shuffleboard, tennis, exercise room, BBQ area and more. It`s located near area beaches, schools, shopping, fishing and over 25 golf courses. Experience Florida living at its best! Immediate occupancy.
-
2007-04-27soldstatus $147,000 398-char remark
Show marketing remark (398 chars)
Attention all snowbirds!!! If you are looking for fine dining, shopping, beautiful beaches, and golfing galore. .. .. .This is the place for you!!! This Fiddlers Green condo is located within minutes of Palm Island and Boca Grande! The seller is offeringa $2500.00 appliance allowance to the new owner! The condo comes fully furnished and ready for your enjoyment! Don t let this one get away!
-
2007-01-17$159,900 398-char remark
Show marketing remark (398 chars)
Attention all snowbirds!!! If you are looking for fine dining, shopping, beautiful beaches, and golfing galore. .. .. .This is the place for you!!! This Fiddlers Green condo is located within minutes of Palm Island and Boca Grande! The seller is offeringa $2500.00 appliance allowance to the new owner! The condo comes fully furnished and ready for your enjoyment! Don t let this one get away!
-
2006-09-06$214,900
-
2006-04-13historical
-
2006-03-24historical
-
2006-01-30$183,000
-
2006-01-25$239,900
-
2006-01-14$249,900
-
2005-10-03historical
-
2004-11-02$235,000
ⓘ Source: listings_history table (triggers on properties + properties_extension) + one-shot
backfill from property_details.listing_events for pre-trigger history.
Climate risk First Street
- Flood 10/10 Extreme FEMA zone AE · 99% chance over 30 yrs
- Wildfire 1/10 Low
- Heat 10/10 Extreme 6 d/yr ≥107°F today · 24 d/yr by 30 yrs out
- Wind 10/10 Extreme 99% chance of damaging wind over 30 yrs
- Air quality 2/10 Low 1 unhealthy d/yr today · 1 by 30 yrs out
Nearby sold comps map
Loading sold comps map…
Walkable amenities ~0.75 mi
Loading nearby amenities…
Taxation est. · year 1
- Rental income
- $16,411
- − Mortgage interest
- −$7,058
- − Property taxes
- −$1,890
- − Insurance
- −$5,748
- − Repairs & maintenance
- −$1,313
- − Management
- −$1,313
- − HOA
- −$2,964
- − Depreciation
- −$3,665
- Taxable loss
- −$7,541
- Est. tax savings @ 24.0%
- +$1,810
- After-tax cash flow
- $-3,757/yr
For passive investors: Depreciation is non-cash, so a rental often shows a tax loss while cash-flowing — sheltering income. Rental losses are passive: they offset passive income freely, and up to $25,000/yr can offset ordinary (W-2) income if you actively participate and your MAGI is under $100k (phasing out to $0 by $150k); unused losses carry forward. On sale, claimed depreciation is recaptured at up to 25%, and gains may owe capital-gains tax (a 1031 exchange can defer both). Figures are a year-1 estimate at your 24.0% rate — not tax advice; consult a CPA.
Schools (NCES district)
- District
- Charlotte
- NCES district ID
- 1200240
- Math proficiency
- 54% ▼ -6.00%
- Reading proficiency
- 54% ▼ -1.00%
- Median HH income
- $44,864
- Composite
- 45.62/100
- National rank
- #2586
- State rank
- #22 of 73 in FL
Livability — Rotonda
- Score
- 67/100
- State rank
- #548
- US rank
- #10359
Category grades
Schools grade is shown separately in the Schools card above.
Census & demographics
- Census place
- Rotonda, FL
- County
- Charlotte County · 196,994 people
- City population
- 10,490
- Metro
- Punta Gorda, FL
- Population (ZIP)
- 15,536
- Household income
- $57,281
- Rent vs Own
- Severe rent burden
- 329.0
Population outlook (Charlotte County) Hauer SSP2
- Today (2025)
- 198,646 people
- By 2030
- 210,507 · +6.0%
- By 2040
- 230,857 · +16.2%
- By 2050
- 247,148 · +24.4%
- By 2075
- 281,777 · +41.8%
- By 2100
- 293,609 · +47.8%
Race, ethnicity, and origin ACS 2023
- Neighborhood character
- Predominantly White (92%)
- Race & ethnicity
- White 92% Two or more races 5% Hispanic / Latino 3% Asian 1%
- Common ancestry
- Romanian 4% Slovak 4% Lithuanian 4%
- Foreign-born
- 9% · Canada
- Languages at home
- 92% English-only · Other Indo-European 2% Spanish 2% German/W. Germanic 1%
Political lean MEDSL · Charlotte
- 2024 margin
- Solid R (+34.0) · D 32.7% · R 66.7%
- 2008→2024 swing
- -26.7pp toward R · 2008: -7.2pp · 2024: -34.0pp
- All cycles
- 2024: R+34.0 2020: R+26.6 2016: R+27.8 2012: R+14.3 2008: R+7.2
Not yet ingested
- Civics
- —
Market trends
- HPI YoY
- ▼ -75.76%
- Current HPI
- 325.0345
- Rent YoY
- ▼ -0.11%
- Metro
- Punta Gorda, FL
- State GDP YoY
- ▲ 3.28%
- F500 in state
- 36
Industry mix (Fortune 500 HQ in FL)
| Industry | F500 HQs | Revenue |
|---|---|---|
| Industrial Technology | 2 | $29B |
|
||
| Insurance | 2 | $17B |
|
||
| Retail | 1 | $60B |
|
||
| Technology Distribution | 1 | $58B |
|
||
| Homebuilding | 1 | $35B |
|
||
| Technology Manufacturing | 1 | $35B |
|
||
Price history
-46.4% since first listed24 events — show timeline
- 2026-03-07 Price Changed $126,000 ForSaleByOwner.com
- 2026-01-20 Listed $139,900 ForSaleByOwner.com
- 2025-08-18 Rental Removed $3,300 RENTALBEAST
- 2025-08-03 Listed for Rent $3,300 RENTALBEAST
- 2025-08-01 Rental Removed $1,300 RENTALBEAST
- 2025-07-31 Listed for Rent $1,300 RENTALBEAST
- 2025-07-25 Rental Removed $1,300 RENTALBEAST
- 2025-07-19 Listed for Rent $1,300 RENTALBEAST
- 2025-01-16 Rental Removed $3,000 PROPERTYWARE
- 2025-01-01 Listed for Rent $3,000 PROPERTYWARE
- 2025-01-01 Rental Removed $3,000 RENTALBEAST
- 2024-11-10 Listed for Rent $3,000 RENTALBEAST
- 2008-04-23 Sold (MLS) $130,000 Stellar MLS as Distributed by MLS Grid
- 2007-10-25 Listed $145,000 Stellar MLS as Distributed by MLS Grid
- 2007-04-27 Sold (MLS) $147,000 Stellar MLS as Distributed by MLS Grid
- 2007-01-17 Listed $159,900 Stellar MLS as Distributed by MLS Grid
- 2006-09-06 Listed $214,900 Stellar MLS as Distributed by MLS Grid
- 2006-04-13 Listing Removed — Stellar MLS as Distributed by MLS Grid
- 2006-03-24 Listing Removed — Stellar MLS as Distributed by MLS Grid
- 2006-01-30 Listed $183,000 Stellar MLS as Distributed by MLS Grid
- 2006-01-25 Listed $239,900 Stellar MLS as Distributed by MLS Grid
- 2006-01-14 Listed $249,900 Stellar MLS as Distributed by MLS Grid
- 2005-10-03 Listing Removed — Stellar MLS as Distributed by MLS Grid
- 2004-11-02 Listed $235,000 Stellar MLS as Distributed by MLS Grid
Cash-flow waterfall
monthlySold comps — $/sqft
last 12 mo · ≤1 miLoading sold comps…