 🏗️ New Construction
Hailey C Plan · Saratoga Springs, UT
Flood risk No data
- FEMA flood zone
- —
- Chance of flooding over 30 yrs
- —
- Est. flood insurance / yr
- —
Fire risk No data
- Est. fire insurance / yr
- —
Heat risk No data
- Hot days now (above threshold)
- —
- Hot days in 30 yrs
- —
Wind risk No data
- Chance of severe wind over 30 yrs
- —
Air-quality risk No data
- Unhealthy air days now
- —
- Unhealthy air days in 30 yrs
- —
Risk factors via First Street. Map © Google.
Why this score? — see what drove the D grade
The composite is a weighted blend of 9 inputs, each scored 0–100. Each bar is that input's sub-score; the figure is the points it added to the 100-point composite (weight × sub-score).
- Appreciation +10.0/10.0
- ARV discount +7.5/15.0
- Cash flow +6.8/30.0
- Schools +4.2/10.0
- Livability +3.5/5.0
- Rent growth +2.7/5.0
- Condition / age +2.5/5.0
- 1% rule +1.8/10.0
- DSCR +1.1/10.0
$578,900
🖨 Deal sheet 📄 Offer letter ✓ Due diligence
Listing remarks
As part of the Mt. Saratoga master plan, Highridge offers a welcoming community with beautifully designed single-family homes, townhomes, and condos with amphitheater views. This community features a variety of amenities, including a unique pickleball island featuring 6 courts, a pool, clubhouse with a gym, and scenic trails throughout. Located in the heart of Saratoga Springs, residents can explore nearby recreation like Utah Lake, The Ranches Golf Club, and local parks and trails. Easy access to Pioneer Crossing also allows for an easy commute. .. .
Key facts
- Scenic trails
- Utah lake
- Pool
Tags
Property features AI
Finance
- Financial info: List price $578,900
Exterior
- Parking: 2 total parking spaces; 2-car garage
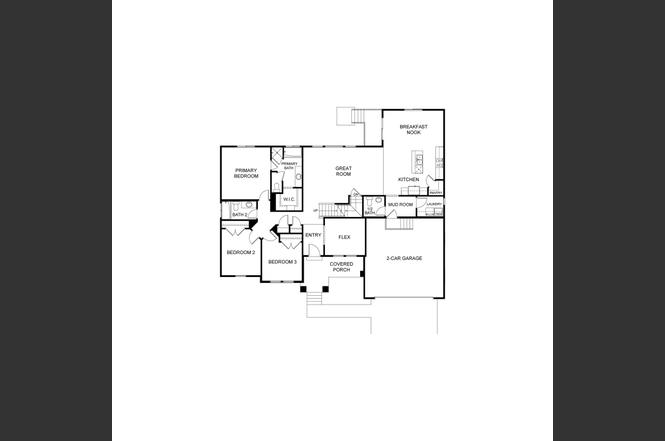
- Home design: Located in Saratoga Springs, UT; Addressed as 974 N Olson Dr
- Exterior features: Living area of 4,493
Interior
- Bedrooms: 5 bedrooms
- Bathrooms: 3 full bathrooms and 1 half bathroom
- Interior features: Plan: Hailey C (new construction)
Neighborhood map
What this means for you Summary
Snapshot
- This is a 5-bed/3.5-bath single-family listed at $579k.
Deal economics
- At list price, monthly cash flow is $-888 ($-11k/yr) — negative.
- To cash-flow at today's rent, offer at most $450k (22.2% below list).
- To meet the 1% rule (rent ≥ 1% of price), the offer needs to be $394k (31.9% below list).
- Recommended offer: $394k (31.9% below list) — sets the bar for 1% rule.
Location & tenants
- Location reads 70/100 on livability (#93 in UT) — a middle-class / working-renter tenant base. Strengths: crime A+, employment A+, housing A+; Watch: amenities F, commute F, cost of living F.
- Alpine District (suburban): math 45% / reading 50% proficiency, ranked #25 of 80 in UT (top 31%) — families likely to look elsewhere, expect single-tenant / working-renter base with shorter leases; only 18% free/reduced lunch — higher-income household profile.
- Market conditions: Rents flat; 1175 active listings in the ZIP; 7 comparable units currently listed for rent nearby; rentals at typical pace (median 14d on market — plan ~3-4 weeks tenant-placement turnaround); high-income renter base; 6,326 units permitted in Utah County in 2024 (1,053 in 5+ unit buildings).
- This rent runs 36% of the median local income ($130k/yr) — at the standard rent-burdened threshold; future hikes will face affordability resistance.
Forward outlook
- In year one you build about $62k of equity ($4k loan paydown + $58k appreciation (10.0% local appreciation)).
- Utah County population projected at +49% by 2050 — long-run rental-demand tailwind backs the buy-and-hold thesis.
- By year 2, paydown + projected appreciation supports a ~$99k cash-out refi (75% LTV) — recoverable capital for the next deal without selling this one.
Negotiation context
- It's been on market 212 days — a 12% lower offer ($509k) is reasonable based on typical stale-listing flexibility.
Questions for the listing agent
- What do current leases actually rent for vs. the listed asking? Can we see a recent rent roll and the last 12 months of T-12 income?
- It's been on market 212 days. Have you received any prior offers? Is the seller open to a 32% concession, seller financing, or rate buy-down credit?
- Why hasn't it sold? Are there any deal-killer items the seller is aware of (foundation, flood, title, zoning, code violations)?
- Is there a deadline driving the sale (1031 exchange, divorce, estate, relocation)? That informs how much negotiation room exists.
- Schools are B-rated — typically a magnet for longer-tenancy family renters. What's the average tenant stay here, and is there a school-zone premium baked into asking?
- The area grade is low — what's the realistic commute time and amenity access for the typical tenant pool here? Any planned neighborhood developments (good or bad) we should know about?
- What's the average days-on-market for RENTAL listings here right now (not sales)? A rising rental-DOM trend means longer vacancies and softer asking-rent achievability than the comps imply.
- What's the recent tenant-quality profile in this submarket — average credit score on applications, eviction rate, late-payment / NSF rate, and stable-employment percentage? A property-management company in the area should have these aggregated.
- How much new for-sale + rental construction is in the pipeline within 1–3 miles? Heavy new supply typically softens prices + rents 12–24 months out; constrained supply supports both.
Investment metrics
- 1% rule
- 0.68% ✗
- Cap rate
- 4.45%
- Cash-on-cash
- -6.57%
- DSCR
- 0.71
- GRM
- 12.2
CMA / ARV
No comps found within radius.
Projected returns pro-forma
10.0% appreciation · 0.68% rent growth · sell at horizon
- IRR
- 19.0%
- Equity multiple
- 2.54×
- Total profit
- $249,814
- Equity at exit
- $521,519
- IRR
- 17.2%
- Equity multiple
- 5.71×
- Total profit
- $763,673
- Equity at exit
- $1,124,675
Cash invested: $162,092 (down + closing). Projections, not guarantees.
Landlord ↔ Tenant lean methodology
- Overall (STATE)
- 86 Strongly Landlord-Friendly
- State Utah
- 86 Strongly Landlord-Friendly · R+15
- County
- — inherits STATE
- City
- — inherits STATE
ZIP-level market 84045
- Home prices YoY
- 3.9%
- Rents YoY
- 0.7%
- Active inventory
- 1175
- Price-to-rent
- 12.2×
Monthly cashflow live
- Estimated rent
- $3,940 high interval (Pro) →
- Mortgage (P&I)
- −$3,036
- Tax est. 1.5%
- −$724 /mo · $8,684/yr
- Insurance
- −$241
- HOA
- −$0
- Vacancy / Maint / Mgmt
- −$827
- Net cashflow
- $-888
Break-even live
UW: 25.0% down · 7.5% · 30yr · 1.5% tax · 5.0% vac · 8.0% maint · 8.0% mgmt
Financing live
Cash to close
- Down payment
- $144,725
- Closing costs
- $17,367
- Reserves months
- —
- Total cash needed
- —
Loan-product check · same deal, 3 products live
Conventional
25% down · 7.5% · 30yr
- Down + closing
- —
- Monthly P&I
- —
- Monthly cashflow
- —
- DSCR
- —
- Eligible?
- —
Personal DTI + credit; lowest rate.
DSCR
20% down · 8.5% · 30yr
- Down + closing
- —
- Monthly P&I
- —
- Monthly cashflow
- —
- DSCR
- —
- Eligible?
- —
No personal income docs; deal must DSCR.
Hard money
10% down · 12.0% · 12mo
- Down + closing
- —
- Monthly P&I
- —
- Monthly cashflow
- —
- DSCR
- —
- Eligible?
- —
Short-term bridge; refi at stabilization.
Rent comps 7 comps
| Address | Beds | Baths | Sqft | Rent | $/sqft | DOM | Units | Dist |
|---|---|---|---|---|---|---|---|---|
| 909 N Sage Hill Dr Saratoga Springs, UT | 5.0 | 3.5 | 4815 | $3,975 | $0.83 | 2d | 1 | 0.08mi |
| 1482 W Russo Dr Saratoga Springs, UT | 5.0 | 4.0 | 3700 | $4,795 | $1.30 | 14d | 1 | 0.12mi |
| 8995 N Cornwall Way Eagle Mountain, UT | 4.0 | 2.5 | 3500 | $2,850 | $0.81 | 23d | 1 | 0.81mi |
| 1331 W Quailhill Rd Saratoga Springs, UT | 5.0 | 3.5 | 3640 | $3,195 | $0.88 | 14d | 1 | 1.08mi |
| 108 N Morning View Dr Saratoga Springs, UT | 4.0 | 2.5 | 3376 | $2,500 | $0.74 | 14d | 1 | 1.10mi |
| 1531 W Stone Gate Dr Saratoga Springs, UT | 5.0 | 3.5 | 3450 | $3,650 | $1.06 | 23d | 1 | 1.22mi |
| 4366 E Willow Oak Way Eagle Mountain, UT | 4.0 | 2.5 | 3231 | $2,545 | $0.79 | 2d | 1 | 1.43mi |
Listing history 15 events
-
2026-06-18days on market $578,900 Active 212 DOM
-
2026-06-17days on market $578,900 Active 211 DOM
-
2026-06-16days on market $578,900 Active 210 DOM
-
2026-06-15days on market $578,900 Active 209 DOM
-
2026-06-14days on market $578,900 Active 207 DOM
-
2026-06-13days on market $578,900 Active 206 DOM
-
2026-06-10days on market $578,900 Active 204 DOM
-
2026-06-09days on market $578,900 Active 203 DOM
-
2026-06-08days on market $578,900 Active 202 DOM
-
2026-06-07days on market $578,900 Active 201 DOM
-
2026-06-03days on market $578,900 Active 197 DOM
-
2026-06-03days on market $578,900 Active 196 DOM
-
2026-06-01days on market $578,900 Active 195 DOM
-
2026-05-31days on market $578,900 Active 194 DOM
-
2026-05-31days on market $578,900 Active 193 DOM
ⓘ Source: listings_history table (triggers on properties + properties_extension) + one-shot
backfill from property_details.listing_events for pre-trigger history.
Nearby sold comps map
Loading sold comps map…
Walkable amenities ~0.75 mi
Loading nearby amenities…
Taxation est. · year 1
- Rental income
- $47,285
- − Mortgage interest
- −$32,427
- − Property taxes
- −$8,684
- − Insurance
- −$2,894
- − Repairs & maintenance
- −$3,783
- − Management
- −$3,783
- − Depreciation
- −$16,841
- Taxable loss
- −$21,127
- Est. tax savings @ 24.0%
- +$5,070
- After-tax cash flow
- $-5,582/yr
For passive investors: Depreciation is non-cash, so a rental often shows a tax loss while cash-flowing — sheltering income. Rental losses are passive: they offset passive income freely, and up to $25,000/yr can offset ordinary (W-2) income if you actively participate and your MAGI is under $100k (phasing out to $0 by $150k); unused losses carry forward. On sale, claimed depreciation is recaptured at up to 25%, and gains may owe capital-gains tax (a 1031 exchange can defer both). Figures are a year-1 estimate at your 24.0% rate — not tax advice; consult a CPA.
Schools (NCES district)
- District
- Alpine District
- NCES district ID
- 4900030
- Math proficiency
- 45% ▼ -4.00%
- Reading proficiency
- 50% ▼ -2.00%
- Median HH income
- $68,595
- Composite
- 42.48/100
- National rank
- #3213
- State rank
- #25 of 80 in UT
Livability — Saratoga Springs
- Score
- 70/100
- State rank
- #93
- US rank
- #7648
Category grades
Schools grade is shown separately in the Schools card above.
Census & demographics
- Census place
- Saratoga Springs, UT
- County
- Utah County · 661,754 people
- City population
- 45,429
- Metro
- Provo-Orem, UT
- Population (ZIP)
- 45,429
- Household income
- $130,331
- Rent vs Own
- Severe rent burden
- 476.0
Population outlook (Utah County) Hauer SSP2
- Today (2025)
- 693,420 people
- By 2030
- 757,324 · +9.2%
- By 2040
- 893,178 · +28.8%
- By 2050
- 1,035,842 · +49.4%
- By 2075
- 1,376,733 · +98.5%
- By 2100
- 1,609,388 · +132.1%
Race, ethnicity, and origin ACS 2023
- Neighborhood character
- Predominantly White (83%)
- Race & ethnicity
- White 83% Hispanic / Latino 12% Two or more races 9% Asian 1%
- Hispanic origin (detail)
- Mexican 6%
- Common ancestry
- Italian 7% Scottish 4% Slovak 4%
- Foreign-born
- 6% · Canada, Jamaica
- Languages at home
- 88% English-only · Spanish 9% Other Indo-European 1% Chinese 1%
Political lean MEDSL · Utah
- 2024 margin
- Solid R (+39.8) · D 28.5% · R 68.3% · Other 3.2%
- 2008→2024 swing
- +19.1pp toward D · 2008: -58.9pp · 2024: -39.8pp
- All cycles
- 2024: R+39.8 2020: R+41.0 2016: R+37.3 2012: R+78.5 2008: R+58.9
Not yet ingested
- Civics
- —
Market trends
- HPI YoY
- ▲ 11.09%
- Current HPI
- 298.0545
- Rent YoY
- ▲ 0.68%
- Metro
- Provo-Orem, UT
- State GDP YoY
- ▲ 3.54%
- F500 in state
- 2
Industry mix (Fortune 500 HQ in UT)
| Industry | F500 HQs | Revenue |
|---|---|---|
| Financial Services | 1 | $3B |
|
||
Cash-flow waterfall
monthlySold comps — $/sqft
last 12 mo · ≤1 miLoading sold comps…