 Triplex
362 SE Main St · Blackfoot, ID
Flood risk No data
- FEMA flood zone
- —
- Chance of flooding over 30 yrs
- —
- Est. flood insurance / yr
- —
Fire risk No data
- Est. fire insurance / yr
- —
Heat risk No data
- Hot days now (above threshold)
- —
- Hot days in 30 yrs
- —
Wind risk No data
- Chance of severe wind over 30 yrs
- —
Air-quality risk No data
- Unhealthy air days now
- —
- Unhealthy air days in 30 yrs
- —
Risk factors via First Street. Map © Google.
Why this score? — see what drove the B- grade
The composite is a weighted blend of 9 inputs, each scored 0–100. Each bar is that input's sub-score; the figure is the points it added to the 100-point composite (weight × sub-score).
- Cash flow +30.0/30.0
- 1% rule +10.0/10.0
- DSCR +10.0/10.0
- ARV discount +7.5/15.0
- Livability +4.2/5.0
- Schools +3.3/10.0
- Rent growth +2.5/5.0
- Condition / age +2.5/5.0
- Appreciation +0.0/10.0
$289,000
🖨 Deal sheet 📄 Offer letter ✓ Due diligence
Multi-family units
County records classify this as Multi-Family (2-4 Unit). Listing-text estimate: 3 units. confirmed
Listing remarks MLS
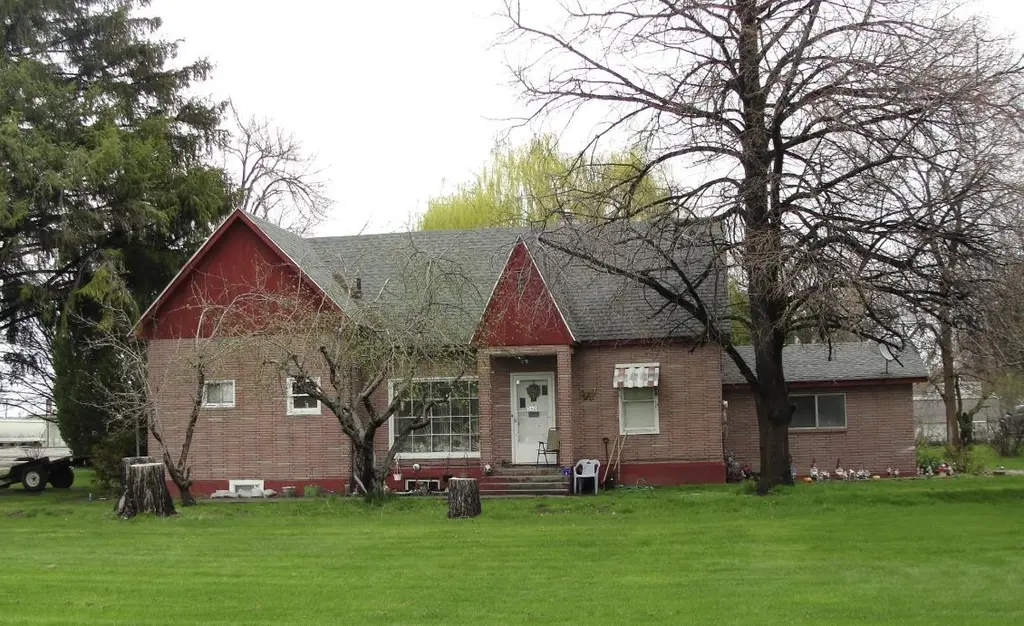
Attention investors! Exceptional rental opportunity with this triplex situated on a large 0.40-acre lot offering income potential. The main level unit features 2 bedrooms and 1 bathroom with washer/dryer hook ups, while both the upstairs and downstairs units offer 1 bedroom and 1 bathroom each, providing flexible rental options to attract long-term tenants. With room for improvements and increased rental income potential, this property is ideal for investors looking to build equity and maximize their cash flow. It is conveniently located close to amenities with plenty of outdoor space and development potential. Don't miss this great investment opportunity! Home is being sold as-is. Additional pictures comming soon.
Key facts
- Income potential
- Large lot
- Outdoor space
Tags
Property features AI
Exterior
- Parking: Gravel detached parking
- Utilities: Public water; Public sewer
- Home design: Residential income property (triplex)
- Construction: Frame and brick construction
- Exterior features: Corner lot
Interior
- Bathrooms: Three full bathrooms
- Heating & cooling: Natural gas heating; Forced air heating
- Interior features: Unfinished basement
Neighborhood map
What this means for you Summary
Snapshot
- This is a 3 × 4-bed/3.0-bath units multifamily listed at $289k.
Deal economics
- At list price, monthly cash flow is $2k ($28k/yr) — positive. Per door: $790/mo.
- The deal already cash-flows at list — no discount required.
- Meets the 1% rule at list price ($5k rent vs $289k).
- Recommended offer: $285k (1.5% below list) — sets the bar for market timing.
Location & tenants
- Location reads 83/100 on livability (#8 in ID, #904 nationally) — a professional / high-income tenant draw. Strengths: commute A+, cost of living A+, housing A+; Watch: amenities F.
- Blackfoot District (town): math 34% / reading 45% proficiency, ranked #69 of 92 in ID (top 75%) — families likely to look elsewhere, expect single-tenant / working-renter base with shorter leases.
- Zoned schools: Mountain View Middle School (math 33% / reading 46%, grade F, #72 of 109 statewide, top 67%, 588 students, 47% FRL); Blackfoot High School (math 26% / reading 47%, grade F, #105 of 169 statewide, top 63%, 1,286 students, 40% FRL).
- Market conditions: 282 active listings in the ZIP; solid renter incomes; 251 units permitted in Bingham County in 2024 (0 in 5+ unit buildings).
- At $5,308/mo this rent would consume 85% of the median local household income ($75k/yr) (locally 286% of renters already pay >50% of income on rent) — very limited rent-growth headroom before tenants either downsize or default.
Forward outlook
- Local home prices are declining (-3.0%/yr); year-one equity from $2k of loan paydown is wiped out by about $9k of value loss. Plan a longer hold.
- Bingham County population projected at -23% by 2050 — secular population decline; favor cash flow + early exit over multi-decade hold.
- At projected returns (-3.0% appreciation + 3.0% rent growth), your $81k cash investment doubles in ~4 years — after that, you're playing with house money.
Negotiation context
- It's been on market 28 days — a 2% lower offer ($285k) is reasonable based on typical stale-listing flexibility.
- 2 sale attempts with the ask held roughly flat each time — persistent listings suggest the price (not the market) is what's stuck; bring a comps-based counter.
Risks & watch-outs
- Watch-outs: built in 1940 — expect roof / HVAC / electrical / plumbing capex.
Questions for the listing agent
- Can we see the unit-by-unit rent roll, current vacancy, and any below-market leases? What's the average tenancy length?
- What capital expenditures (roof, boiler, parking lot, exteriors) have been made in the last 5 years, and what's planned in the next 2?
- Built in 1940 — when were the roof, HVAC, electrical panel, plumbing, and water heater last replaced?
- Is there a deadline driving the sale (1031 exchange, divorce, estate, relocation)? That informs how much negotiation room exists.
- What's the average days-on-market for RENTAL listings here right now (not sales)? A rising rental-DOM trend means longer vacancies and softer asking-rent achievability than the comps imply.
- What's the recent tenant-quality profile in this submarket — average credit score on applications, eviction rate, late-payment / NSF rate, and stable-employment percentage? A property-management company in the area should have these aggregated.
- How much new apartment / multifamily construction is in the pipeline within 1–3 miles? Heavy new supply (>2% of stock underway) typically softens rents 12–24 months out; light construction supports rent growth.
Investment metrics
- 1% rule
- 1.84% ✓
- Cap rate
- 16.13%
- Cash-on-cash
- 35.14%
- DSCR
- 2.56
- GRM
- 4.5
CMA / ARV
No comps found within radius.
Projected returns pro-forma
-3.0% appreciation · 3.0% rent growth · sell at horizon
- IRR
- 30.7%
- Equity multiple
- 2.29×
- Total profit
- $104,043
- Equity at exit
- $43,091
- IRR
- 37.9%
- Equity multiple
- 4.52×
- Total profit
- $284,800
- Equity at exit
- $24,987
Cash invested: $80,920 (down + closing). Projections, not guarantees.
Landlord ↔ Tenant lean methodology
- Overall (STATE)
- 91 Strongly Landlord-Friendly
- State Idaho
- 91 Strongly Landlord-Friendly · R+18
- County
- — inherits STATE
- City
- — inherits STATE
ZIP-level market 83221
- Active inventory
- 282
- Price-to-rent
- 13.6×
Monthly cashflow live
- Estimated rent
- $5,308 medium interval (Pro) →
- Mortgage (P&I)
- −$1,516
- Tax from tax record
- −$188 /mo · $2,257/yr
- Insurance
- −$120
- HOA
- −$0
- Vacancy / Maint / Mgmt
- −$1,115
- Net cashflow
- $2,369
Break-even live
3-unit breakdown (identical units grouped — click to expand)
| Units | Beds | Baths | Est. rent |
|---|---|---|---|
| 3× units | 4 | 3 | $5,307 |
| #1 | 4 | 3 | $1,769 |
| #2 | 4 | 3 | $1,769 |
| #3 | 4 | 3 | $1,769 |
| Total (3 units) | $5,308 | ||
UW: 25.0% down · 7.5% · 30yr · 1.5% tax · 5.0% vac · 8.0% maint · 8.0% mgmt
Financing live
Cash to close
- Down payment
- $72,250
- Closing costs
- $8,670
- Reserves months
- —
- Total cash needed
- —
Loan-product check · same deal, 3 products live
Conventional
25% down · 7.5% · 30yr
- Down + closing
- —
- Monthly P&I
- —
- Monthly cashflow
- —
- DSCR
- —
- Eligible?
- —
Personal DTI + credit; lowest rate.
DSCR
20% down · 8.5% · 30yr
- Down + closing
- —
- Monthly P&I
- —
- Monthly cashflow
- —
- DSCR
- —
- Eligible?
- —
No personal income docs; deal must DSCR.
Hard money
10% down · 12.0% · 12mo
- Down + closing
- —
- Monthly P&I
- —
- Monthly cashflow
- —
- DSCR
- —
- Eligible?
- —
Short-term bridge; refi at stabilization.
Listing history 18 events
-
2026-06-19days on market $289,000 Active 28 DOM
-
2026-06-18days on market $289,000 Active 27 DOM
-
2026-06-17days on market $289,000 Active 26 DOM
-
2026-06-16days on market $289,000 Active 25 DOM
-
2026-06-15days on market $289,000 Active 24 DOM
-
2026-06-14days on market $289,000 Active 22 DOM
-
2026-06-12days on market $289,000 Active 21 DOM
-
2026-06-09days on market $289,000 Active 18 DOM
-
2026-06-08days on market $289,000 Active 17 DOM
-
2026-06-07days on market $289,000 Active 16 DOM
-
2026-06-05days on market $289,000 Active 13 DOM
-
2026-06-03days on market $289,000 Active 12 DOM
-
2026-06-02days on market $289,000 Active 11 DOM
-
2026-06-01days on market $289,000 Active 10 DOM
-
2026-05-31days on market $289,000 Active 9 DOM
-
2026-05-30days on market $289,000 Active 8 DOM
-
2026-05-21$289,000 Active
Show marketing remark (724 chars)
Attention investors! Exceptional rental opportunity with this triplex situated on a large 0.40-acre lot offering income potential. The main level unit features 2 bedrooms and 1 bathroom with washer/dryer hook ups, while both the upstairs and downstairs units offer 1 bedroom and 1 bathroom each, providing flexible rental options to attract long-term tenants. With room for improvements and increased rental income potential, this property is ideal for investors looking to build equity and maximize their cash flow. It is conveniently located close to amenities with plenty of outdoor space and development potential. Don't miss this great investment opportunity! Home is being sold as-is. Additional pictures comming soon.
-
2026-05-21$289,000 Active 724-char remark
Show marketing remark (724 chars)
Attention investors! Exceptional rental opportunity with this triplex situated on a large 0.40-acre lot offering income potential. The main level unit features 2 bedrooms and 1 bathroom with washer/dryer hook ups, while both the upstairs and downstairs units offer 1 bedroom and 1 bathroom each, providing flexible rental options to attract long-term tenants. With room for improvements and increased rental income potential, this property is ideal for investors looking to build equity and maximize their cash flow. It is conveniently located close to amenities with plenty of outdoor space and development potential. Don't miss this great investment opportunity! Home is being sold as-is. Additional pictures comming soon.
ⓘ Source: listings_history table (triggers on properties + properties_extension) + one-shot
backfill from property_details.listing_events for pre-trigger history.
Tax reassessment forecast ID · Resets to sale price
- Current annual tax
- $2,257 · $188/mo
- Projected year-2 tax
- $2,257 · $188/mo
- Expected delta
- $0/yr ($0/mo · 0.0%)
ⓘ Screening estimate from a state-policy table — verify with the county assessor before closing.
Nearby sold comps map
Loading sold comps map…
Walkable amenities ~0.75 mi
Loading nearby amenities…
Taxation est. · year 1
- Rental income
- $63,696
- − Mortgage interest
- −$16,188
- − Property taxes
- −$2,257
- − Insurance
- −$1,445
- − Repairs & maintenance
- −$5,096
- − Management
- −$5,096
- − Depreciation
- −$8,407
- Taxable income
- $25,207
- Est. tax owed @ 24.0%
- −$6,050
- After-tax cash flow
- $22,382/yr
For passive investors: Depreciation is non-cash, so a rental often shows a tax loss while cash-flowing — sheltering income. Rental losses are passive: they offset passive income freely, and up to $25,000/yr can offset ordinary (W-2) income if you actively participate and your MAGI is under $100k (phasing out to $0 by $150k); unused losses carry forward. On sale, claimed depreciation is recaptured at up to 25%, and gains may owe capital-gains tax (a 1031 exchange can defer both). Figures are a year-1 estimate at your 24.0% rate — not tax advice; consult a CPA.
Schools (NCES district)
- District
- Blackfoot District
- NCES district ID
- 1600270
- Math proficiency
- 34% ▼ -4.00%
- Reading proficiency
- 45% ▲ 1.00%
- Median HH income
- $43,903
- Composite
- 33.46/100
- National rank
- #5455
- State rank
- #69 of 92 in ID
Livability — Blackfoot
- Score
- 83/100
- State rank
- #8
- US rank
- #904
Category grades
Schools grade is shown separately in the Schools card above.
Census & demographics
- Census place
- Blackfoot, ID
- County
- Bingham County · 29,081 people
- City population
- 29,081
- Metro
- Blackfoot, ID
- Population (ZIP)
- 29,081
- Household income
- $75,172
- Rent vs Own
- Severe rent burden
- 286.0
Population outlook (Bingham County) Hauer SSP2
- Today (2025)
- 42,176 people
- By 2030
- 40,396 · -4.2%
- By 2040
- 36,693 · -13.0%
- By 2050
- 32,485 · -23.0%
- By 2075
- 21,927 · -48.0%
- By 2100
- 12,716 · -69.9%
Race, ethnicity, and origin ACS 2023
- Neighborhood character
- Predominantly White (74%)
- Race & ethnicity
- White 74% Hispanic / Latino 18% Two or more races 8% Native American 5%
- Hispanic origin (detail)
- Mexican 15%
- Common ancestry
- Slovak 4% Italian 3% Lithuanian 1%
- Foreign-born
- 4% · Canada
- Languages at home
- 89% English-only · Spanish 10%
Political lean MEDSL · Bingham
- 2024 margin
- Solid R (+59.6) · D 18.8% · R 78.4% · Other 2.8%
- 2008→2024 swing
- -14.1pp toward R · 2008: -45.5pp · 2024: -59.6pp
- All cycles
- 2024: R+59.6 2020: R+55.6 2016: R+48.0 2012: R+54.6 2008: R+45.5
Not yet ingested
- Civics
- —
Market trends
- HPI YoY
- ▼ -176.20%
- Current HPI
- 252.1938
- Rent YoY
- —
- Metro
- Blackfoot, ID
- State GDP YoY
- ▲ 4.51%
- F500 in state
- 6
Industry mix (Fortune 500 HQ in ID)
| Industry | F500 HQs | Revenue |
|---|---|---|
| Retail | 1 | $79B |
|
||
| Technology | 1 | $25B |
|
||
| Food / Agriculture | 1 | $6B |
|
||
Price history
+0.0% since first listed2 events — show timeline
- 2026-05-21 Listed $289,000 SRMLS
- 2026-05-21 Listed $289,000 PCTMLS
Property tax history
+3.6%/yrLatest (2016): $2,257 · +1.7% YoY. Source: county tax records.
Cash-flow waterfall
monthlySold comps — $/sqft
last 12 mo · ≤1 miLoading sold comps…