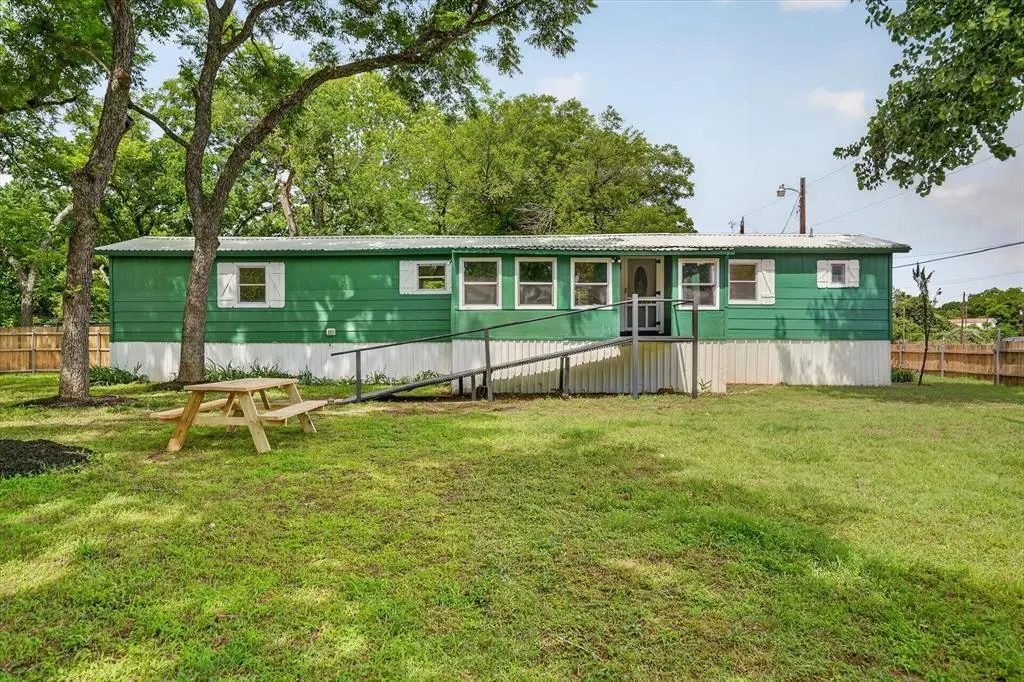
5469 Lake Granbury Trl · Oak Trail Shores, TX
Flood risk 9/10 · Severe
- FEMA flood zone
- A
- Chance of flooding over 30 yrs
- 0.99%
- Est. flood insurance / yr
- $1,009 – $1,996
Fire risk 6/10 · Moderate
- Est. fire insurance / yr
- $1,222 – $2,270
Heat risk 7/10 · Major
- Hot days now (above 108°F)
- 7 days/yr
- Hot days in 30 yrs
- 21 days/yr
Wind risk 4/10 · Minor
- Chance of severe wind over 30 yrs
- 24.0%
Air-quality risk 2/10 · Minimal
- Unhealthy air days now
- 1 days/yr
- Unhealthy air days in 30 yrs
- 2 days/yr
Risk factors via First Street. Map © Google.
Why this score? — see what drove the C- grade
The composite is a weighted blend of 9 inputs, each scored 0–100. Each bar is that input's sub-score; the figure is the points it added to the 100-point composite (weight × sub-score).
- Cash flow +23.5/30.0
- DSCR +7.6/10.0
- 1% rule +5.8/10.0
- Schools +4.0/10.0
- Livability +2.9/5.0
- Rent growth +2.8/5.0
- Condition / age +2.5/5.0
- ARV discount +1.3/15.0
- Appreciation +0.0/10.0
$164,900
🖨 Deal sheet (PDF) 📄 Offer letter ✓ Due diligence
Listing remarks MLS
Nestled within a serene lake community, this home features 3 bedroom and 2 bathrooms. Step inside to discover a cozy and bright open living area, with updated flooring, fresh paint, and newer fixtures throughout. There is access to the creek behind the property making ideal for your future lakeside retreat. The included detached apartment offers a unique opportunity to build a workshop, a guest house, even an income-generating rental. The generous sized lot makes ideal to create a stunning outdoor oasis. Come and make this charming home your own.
Key facts
- Wood fence
- Lake granbury
- Robinson creek
Tags
Property features AI
Finance
- Financial info: Listing terms: Cash, Conventional, FHA, VA
- HOA & community: Mandatory HOA (Lake Granbury Harbor); Annual HOA fee of $48; Association fee includes management fees
Exterior
- Parking: Additional parking available; Direct access; On-street parking; Open/outside parking
- Security: Security lights
- Utilities: Co-op water; Septic; Electricity available and connected; Overhead utilities; Cable available; Phone available; All weather road access
- Home design: Manufactured home (residential); One story; Accessible approach with ramp
- Construction: Metal roof; Wood siding construction; Other foundation; Year built 1983 (preowned)
- Exterior features: Covered rear porch/patio; Covered porches; Private yard; Yard lighting; Full wood privacy fence with gate; Landscaped, mostly level lot with few trees and large backyard grass; Interior lot in subdivision
Interior
- Kitchen: Built-in cabinets; Natural stone/granite countertops; Pantry and walk-in pantry; Disposal; Electric cooktop; Electric oven; Electric range
- Bedrooms: 3 bedrooms (all on one level); Primary bedroom with ensuite bath, separate shower, and walk-in closet; Additional bedrooms with walk-in closets
- Flooring: Ceramic tile; Hardwood; Stone; Tile; Wood
- Bathrooms: 3 full bathrooms; Primary bathroom features separate shower and built-in cabinets
- Heating & cooling: Ceiling fan(s); Window unit(s); Other heating
- Interior features: Open floorplan; Eat-in kitchen; Decorative lighting; Cable TV available; High speed internet available
- Laundry & utility: Separate utility room with built-in cabinets; Washer hookup; Electric dryer hookup; Electric water heater
Neighborhood map
What this means for you Summary
Snapshot
- This is a 3-bed/3.0-bath manufactured listed at $165k.
Deal economics
- At list price, monthly cash flow is $183 ($2k/yr) — positive.
- The deal already cash-flows at list — no discount required.
- Meets the 1% rule at list price ($2k rent vs $165k).
- Recommended offer: $162k (1.5% below list) — sets the bar for market timing.
- Cap rate 8.5% vs local median 5.9% in Oak Trail Shores — top-decile yield for the area; either an underpriced asset or a hidden risk that comps aren't pricing in. Stress-test before assuming the spread holds.
Location & tenants
- Location reads 58/100 on livability (#1,187 in TX) — a working-class tenant base; expect higher turnover. Strengths: cost of living A+, housing A+, crime B+; Watch: health & safety D+, amenities F, commute F.
- Granbury ISD (town): math 46% / reading 46% proficiency, ranked #237 of 826 in TX (top 29%) — families likely to look elsewhere, expect single-tenant / working-renter base with shorter leases.
- Zoned schools: Nettie Baccus El (math 39% / reading 36%, grade F, #1,744 of 4,322 statewide, top 41%, 466 students, 81% FRL) — zoned schools average 81% FRL vs 43% district-wide (38 pts higher); higher-poverty schools than district average — tighter screening recommended.
- Market conditions: Rents rising (+1.1%/yr); 929 active listings in the ZIP; 2 comparable units currently listed for rent nearby; 125 units permitted in Hood County in 2024 (0 in 5+ unit buildings).
- This rent runs 30% of the median local income ($70k/yr) — at the standard rent-burdened threshold; future hikes will face affordability resistance.
Forward outlook
- Local home prices are declining (-3.0%/yr); year-one equity from $1k of loan paydown is wiped out by about $5k of value loss. Plan a longer hold.
- Hood County population projected at +29% by 2050 — long-run rental-demand tailwind backs the buy-and-hold thesis.
Negotiation context
- It's been on market 17 days — a 2% lower offer ($162k) is reasonable based on typical stale-listing flexibility.
- 5 sale attempts since 16y ago; this cycle's ask has dropped $35k (18%) from the opening price — seller is motivated, your offer sets the floor, not the list.
Risks & watch-outs
- Watch-outs: flood insurance adds $125/mo.
- Climate carrying-cost: in FEMA flood zone A (mandatory federal flood insurance); major wildfire risk; extreme-heat days projected 7→21/yr by 2055 (HVAC capex compounding) — expect insurance premiums to compound above CPI over the hold.
Questions for the listing agent
- What's the actual annual flood-insurance premium (NFIP or private), and is the property in a SFHA with mandatory coverage?
- What does the HOA fee cover, when was the last increase, and are there any pending special assessments or reserve-fund shortfalls?
- Is there a deadline driving the sale (1031 exchange, divorce, estate, relocation)? That informs how much negotiation room exists.
- Schools are F-rated, which usually means shorter tenancies and higher turnover. Who's the typical renter profile here, and what's been the actual vacancy rate?
- What's the average days-on-market for RENTAL listings here right now (not sales)? A rising rental-DOM trend means longer vacancies and softer asking-rent achievability than the comps imply.
- What's the recent tenant-quality profile in this submarket — average credit score on applications, eviction rate, late-payment / NSF rate, and stable-employment percentage? A property-management company in the area should have these aggregated.
- How much new for-sale + rental construction is in the pipeline within 1–3 miles? Heavy new supply typically softens prices + rents 12–24 months out; constrained supply supports both.
Investment metrics
- 1% rule
- 1.08% ✓
- Cap rate
- 8.54%
- Cash-on-cash
- 8.01%
- DSCR
- 1.36
- GRM
- 7.7
CMA / ARV
- ARV (on-the-fly)
- $145,040
- Comps found
- 10
Show comp detail 10 sales within ~0.75 mi
| Address | Dist | Beds/Ba | Sqft | Sold | Price | $/sf | Match |
|---|---|---|---|---|---|---|---|
| 5469 Lake Granbury Trl | 0.00mi | 3/2.0 | 980 (0%) | 8mo | $125,000 | $128 | 90 |
| 5515 S Oklahoma Trl | 0.13mi | 2/2.0 (-1) | 938 (-4%) | 11mo | $89,500 | $95 | 68 |
| 5422 Clear View Dr | 0.37mi | 3/2.0 | 902 (-8%) | 5mo | $139,995 | $155 | 62 |
| 5410 Arrowhead | 0.26mi | 2/2.0 (-1) | 1,020 (+4%) | 14mo | $139,900 | $137 | 60 |
| 5701 Texas Trl | 0.24mi | 2/2.0 (-1) | 900 (-8%) | 10mo | $139,900 | $155 | 58 |
| 5717 Arkansas Trl | 0.35mi | 3/2.0 | 924 (-6%) | 15mo | $154,900 | $168 | 57 |
| 5718 Arkansas Trl | 0.34mi | 2/2.0 (-1) | 960 (-2%) | 18mo | $29,999 | $31 | 57 |
| 5703 Texas Trl | 0.25mi | 2/2.0 (-1) | 960 (-2%) | 23mo | $159,900 | $167 | 56 |
| 5803 Georgia Trl | 0.32mi | 3/2.0 | 1,116 (+14%) | 22mo | $165,000 | $148 | 40 |
| 3701 New York Ct | 0.66mi | 2/1.0 (-1) | 850 (-13%) | 15mo | $85,000 | $100 | 22 |
Match score weights: distance 35% · size 25% · config 20% · recency 20%. Top-matched comps best support the ARV.
Projected returns pro-forma
-3.0% appreciation · 1.1% rent growth · sell at horizon
- IRR
- -11.1%
- Equity multiple
- 0.60×
- Total profit
- $-18,325
- Equity at exit
- $24,587
- IRR
- -5.0%
- Equity multiple
- 0.70×
- Total profit
- $-13,808
- Equity at exit
- $14,258
Cash invested: $46,172 (down + closing). Projections, not guarantees.
Landlord ↔ Tenant lean methodology
- Overall (STATE)
- 87 Strongly Landlord-Friendly
- State Texas
- 87 Strongly Landlord-Friendly · R+5
- County
- — inherits STATE
- City
- — inherits STATE
ZIP-level market 76048
- Home prices YoY
- -23.4%
- Rents YoY
- 1.1%
- Active inventory
- 929
- Price-to-rent
- 7.7×
Monthly cashflow live
- Estimated rent
- $1,776 medium interval (Pro) →
- Mortgage (P&I)
- −$865
- Tax from tax record
- −$158 /mo · $1,894/yr
- Insurance
- −$69
- Flood insurance flood zone
- −$125 /mo · $1,502/yr
- HOA
- −$4
- Vacancy / Maint / Mgmt
- −$373
- Net cashflow
- $183
Break-even live
Sensitivity live
| Price | -10% $276 | -5% $230 | +0% $183 | +5% $136 | +10% $90 |
|---|---|---|---|---|---|
| Rent | -10% $43 | -5% $113 | +0% $183 | +5% $253 | +10% $323 |
| Rate | -1.0pp $266 | -0.5pp $225 | base $183 | +0.5pp $140 | +1.0pp $97 |
UW: 25.0% down · 7.5% · 30yr · 1.5% tax · 5.0% vac · 8.0% maint · 8.0% mgmt
Financing live
Cash to close
- Down payment
- $41,225
- Closing costs
- $4,947
- Reserves months
- —
- Total cash needed
- —
Loan-product check · same deal, 3 products live
Conventional
25% down · 7.5% · 30yr
- Down + closing
- —
- Monthly P&I
- —
- Monthly cashflow
- —
- DSCR
- —
- Eligible?
- —
Personal DTI + credit; lowest rate.
DSCR
20% down · 8.5% · 30yr
- Down + closing
- —
- Monthly P&I
- —
- Monthly cashflow
- —
- DSCR
- —
- Eligible?
- —
No personal income docs; deal must DSCR.
Hard money
10% down · 12.0% · 12mo
- Down + closing
- —
- Monthly P&I
- —
- Monthly cashflow
- —
- DSCR
- —
- Eligible?
- —
Short-term bridge; refi at stabilization.
Rent comps 2 comps
| Address | Beds | Baths | Sqft | Rent | $/sqft | DOM | Units | Dist |
|---|---|---|---|---|---|---|---|---|
| 4214 W Virginia Dr Granbury, TX | 3.0 | 2.0 | 1064 | $1,595 | $1.50 | 44d | 1 | 1.15mi |
| 3225 Evergreen Dr Granbury, TX | 3.0 | 1.0 | 916 | $1,425 | $1.56 | 2d | 1 | 1.26mi |
HOA detail
- Monthly dues
- $4 · $48/yr
Listing history 13 events
-
2026-06-18days on market $164,900 Active 17 DOM
-
2026-06-17price $164,900 Active 16 DOM
-
2026-06-17days on market $175,000 Active 16 DOM
-
2026-06-16days on market $175,000 Active 15 DOM
-
2026-06-15days on market $175,000 Active 14 DOM
-
2026-06-13pricedays on market $175,000 Active 12 DOM
-
2026-06-09days on market $199,900 Active 8 DOM
-
2026-06-08days on market $199,900 Active 7 DOM
-
2026-06-07days on market $199,900 Active 6 DOM
-
2026-06-04days on market $199,900 Active 3 DOM
-
2026-06-03days on market $199,900 Active 2 DOM
-
2026-06-02remarks 699-char remark
-
2026-06-02$199,900 Active 1 DOM
ⓘ Source: listings_history table (triggers on properties + properties_extension) + one-shot
backfill from property_details.listing_events for pre-trigger history.
Tax reassessment forecast TX · Resets to sale price
- Current annual tax
- $1,894 · $158/mo
- Projected year-2 tax
- $3,018 · $251/mo
- Expected delta
- +$1,124/yr (+$94/mo · 59.3%)
ⓘ Screening estimate from a state-policy table — verify with the county assessor before closing.
Climate risk First Street
- Flood 9/10 Extreme FEMA zone A · 99% chance over 30 yrs
- Wildfire 6/10 Major
- Heat 7/10 Severe 7 d/yr ≥108°F today · 21 d/yr by 30 yrs out
- Wind 4/10 Moderate 24% chance of damaging wind over 30 yrs
- Air quality 2/10 Low 1 unhealthy d/yr today · 2 by 30 yrs out
Nearby sold comps map
Loading sold comps map…
Walkable amenities ~0.75 mi
Loading nearby amenities…
Taxation est. · year 1
- Rental income
- $21,318
- − Mortgage interest
- −$9,237
- − Property taxes
- −$1,894
- − Insurance
- −$2,327
- − Repairs & maintenance
- −$1,705
- − Management
- −$1,705
- − HOA
- −$48
- − Depreciation
- −$4,797
- Taxable loss
- −$396
- Est. tax savings @ 24.0%
- +$95
- After-tax cash flow
- $2,290/yr
For passive investors: Depreciation is non-cash, so a rental often shows a tax loss while cash-flowing — sheltering income. Rental losses are passive: they offset passive income freely, and up to $25,000/yr can offset ordinary (W-2) income if you actively participate and your MAGI is under $100k (phasing out to $0 by $150k); unused losses carry forward. On sale, claimed depreciation is recaptured at up to 25%, and gains may owe capital-gains tax (a 1031 exchange can defer both). Figures are a year-1 estimate at your 24.0% rate — not tax advice; consult a CPA.
Schools (NCES district)
- District
- Granbury ISD
- NCES district ID
- 4821390
- Math proficiency
- 46% ▬ 0.00%
- Reading proficiency
- 46% ▲ 4.00%
- Median HH income
- $55,856
- Composite
- 40.04/100
- National rank
- #3820
- State rank
- #237 of 826 in TX
Livability — Oak Trail Shores
- Score
- 58/100
- State rank
- #1187
- US rank
- #20758
Category grades
Schools grade is shown separately in the Schools card above.
Census & demographics
- County
- Hood County · 58,506 people
- Metro
- Granbury, TX
- Population (ZIP)
- 27,000
- Household income
- $70,346
- Rent vs Own
- Severe rent burden
- 612.0
Population outlook (Hood County) Hauer SSP2
- Today (2025)
- 63,502 people
- By 2030
- 67,459 · +6.2%
- By 2040
- 74,958 · +18.0%
- By 2050
- 81,922 · +29.0%
- By 2075
- 98,872 · +55.7%
- By 2100
- 107,796 · +69.8%
Race, ethnicity, and origin ACS 2023
- Neighborhood character
- Predominantly White (80%)
- Race & ethnicity
- White 80% Hispanic / Latino 14% Two or more races 11% Black 1%
- Hispanic origin (detail)
- Mexican 13%
- Common ancestry
- Italian 2% Slovak 2% Portuguese 1%
- Foreign-born
- 4% · Canada
- Languages at home
- 89% English-only · Spanish 10%
Political lean MEDSL · Hood
- 2024 margin
- Solid R (+66.0) · D 16.6% · R 82.6%
- 2008→2024 swing
- -11.9pp toward R · 2008: -54.0pp · 2024: -66.0pp
- All cycles
- 2024: R+66.0 2020: R+64.1 2016: R+66.5 2012: R+64.7 2008: R+54.0
Not yet ingested
- Civics
- —
Market trends
- HPI YoY
- ▼ -83.25%
- Current HPI
- 272.2126
- Rent YoY
- ▲ 1.10%
- Metro
- Granbury, TX
- State GDP YoY
- ▲ 3.95%
- F500 in state
- 110
Industry mix (Fortune 500 HQ in TX)
| Industry | F500 HQs | Revenue |
|---|---|---|
| Energy | 16 | $1,198B |
|
||
| Technology | 5 | $198B |
|
||
| Engineering / Construction | 4 | $72B |
|
||
| Energy Services | 3 | $60B |
|
||
| Utilities | 3 | $41B |
|
||
| Healthcare | 2 | $330B |
|
||
Price history
+233.7% since first listed20 events — show timeline
- 2026-06-01 Listed $199,900 NTREIS
- 2025-11-04 Sold (Public Records) — Public Records
- 2025-10-29 Sold (MLS) — NTREIS
- 2025-10-17 Pending — NTREIS
- 2025-10-03 Price Changed $125,000 NTREIS
- 2025-04-17 Price Changed $130,000 NTREIS
- 2025-01-20 Price Changed $146,000 NTREIS
- 2024-12-11 Listed $152,000 NTREIS
- 2024-11-08 Listing Removed — NTREIS
- 2024-10-02 Price Changed $152,000 NTREIS
- 2024-07-01 Price Changed $160,000 NTREIS
- 2024-05-08 Listed $170,000 NTREIS
- 2023-11-01 Sold (Public Records) — Public Records
- 2023-10-31 Sold (MLS) — NTREIS
- 2023-10-19 Pending — NTREIS
- 2023-10-12 Listed $60,000 NTREIS
- 2023-09-12 Sold (Public Records) — Public Records
- 2010-10-14 Listing Removed — NTREIS
- 2010-06-07 Listed $59,900 NTREIS
- 2008-11-24 Sold (Public Records) — Public Records
Property tax history
+12.7%/yrLatest (2025): $1,894 · +119.2% YoY. Source: county tax records.
Cash-flow waterfall
monthlySold comps — $/sqft
last 12 mo · ≤1 miLoading sold comps…