 🌊 Lakefront
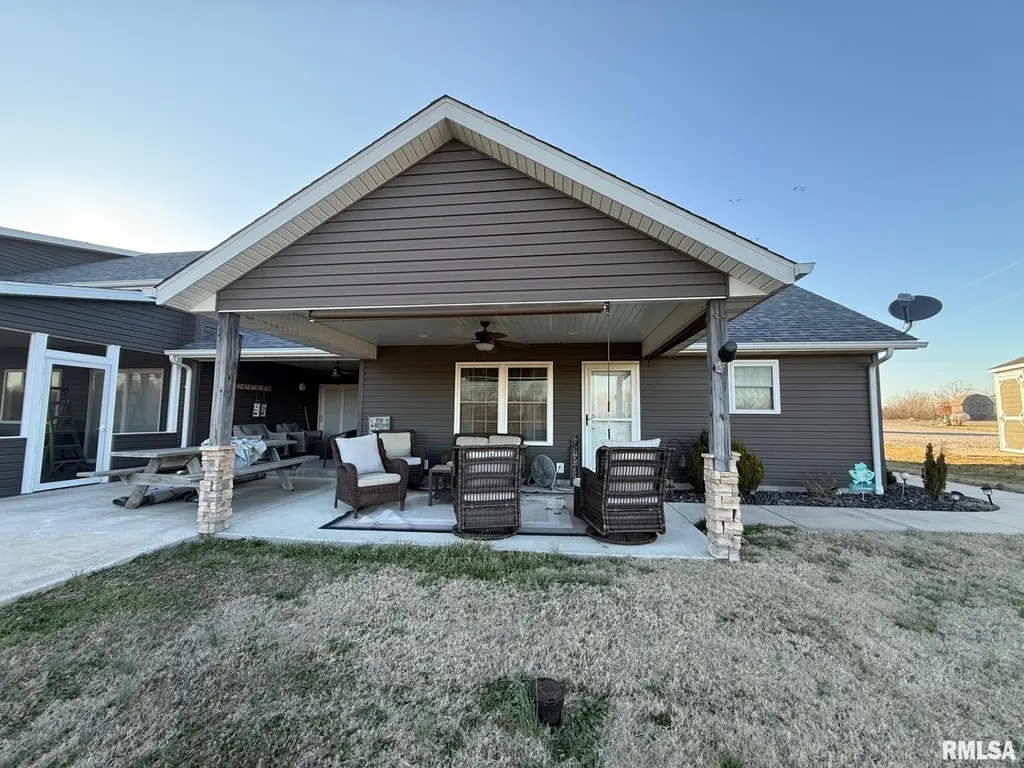
75 Bedrock Rdg Unit B · Elkville, IL
Flood risk 1/10 · Minimal
- FEMA flood zone
- X (unshaded)
- Chance of flooding over 30 yrs
- 0.0%
- Est. flood insurance / yr
- $507 – $1,088
Fire risk 1/10 · Minimal
- Est. fire insurance / yr
- $804 – $1,492
Heat risk 5/10 · Moderate
- Hot days now (above 108°F)
- 7 days/yr
- Hot days in 30 yrs
- 22 days/yr
Wind risk 3/10 · Minor
- Chance of severe wind over 30 yrs
- 5.0%
Air-quality risk 2/10 · Minimal
- Unhealthy air days now
- 0 days/yr
- Unhealthy air days in 30 yrs
- 2 days/yr
Risk factors via First Street. Map © Google.
Why this score? — see what drove the D- grade
The composite is a weighted blend of 9 inputs, each scored 0–100. Each bar is that input's sub-score; the figure is the points it added to the 100-point composite (weight × sub-score).
- ARV discount +15.0/15.0
- Cash flow +5.7/30.0
- Appreciation +5.3/10.0
- Schools +3.2/10.0
- Livability +2.9/5.0
- Rent growth +2.5/5.0
- Condition / age +2.5/5.0
- 1% rule +1.1/10.0
- DSCR +0.1/10.0
$138,000
🖨 Deal sheet 📄 Offer letter ✓ Due diligence
Listing remarks MLS
Lake living on your bucket list? This gorgeous custom 2 bedroom home is absolutely perfect. Enjoy your well equipment kitchen with top on the line appliances and custom cabinets and countertops that flow straight into your cozy living room. 2 good sized bedrooms and shared bath. Step outside to your covered porch and enjoy your lake front vibes. Shared pavilion for the ones that like to entertain. All one level and would be a great vacation home or an Airbnb. Unbelievable price.
Key facts
- Covered porch
- Custom cabinets
- Shared pavilion
Tags
Neighborhood map
What this means for you Summary
Snapshot
- This is a 2-bed/1.0-bath single-family listed at $138k.
Deal economics
- At list price, monthly cash flow is $-284 ($-3k/yr) — negative.
- To cash-flow at today's rent, offer at most $97k (29.8% below list).
- To meet the 1% rule (rent ≥ 1% of price), the offer needs to be $85k (38.6% below list).
- Recommended offer: $85k (38.6% below list) — sets the bar for 1% rule.
Location & tenants
- Location reads 58/100 on livability (#1,123 in IL) — a working-class tenant base; expect higher turnover. Strengths: cost of living A+, housing A+; Watch: employment D, schools F, crime D-.
- Elverado CUSD 196 (rural): math 25% / reading 45% proficiency, ranked #418 of 919 in IL (top 46%) — families likely to look elsewhere, expect single-tenant / working-renter base with shorter leases.
- Market conditions: 12 active listings in the ZIP; 5 units permitted in Jackson County in 2024 (0 in 5+ unit buildings).
Forward outlook
- In year one you build about $2k of equity ($954 loan paydown + $725 appreciation (0.5% local appreciation)).
Negotiation context
- It's been on market 113 days — a 9% lower offer ($126k) is reasonable based on typical stale-listing flexibility.
- 2 sale attempts with the ask held roughly flat each time — persistent listings suggest the price (not the market) is what's stuck; bring a comps-based counter.
Risks & watch-outs
- Climate carrying-cost: extreme-heat days projected 7→22/yr by 2055 (HVAC capex compounding) — expect insurance premiums to compound above CPI over the hold.
Questions for the listing agent
- What do current leases actually rent for vs. the listed asking? Can we see a recent rent roll and the last 12 months of T-12 income?
- It's been on market 113 days. Have you received any prior offers? Is the seller open to a 39% concession, seller financing, or rate buy-down credit?
- Why hasn't it sold? Are there any deal-killer items the seller is aware of (foundation, flood, title, zoning, code violations)?
- Is there a deadline driving the sale (1031 exchange, divorce, estate, relocation)? That informs how much negotiation room exists.
- Schools are F-rated, which usually means shorter tenancies and higher turnover. Who's the typical renter profile here, and what's been the actual vacancy rate?
- Crime grade is D in this area — have there been break-ins, vandalism, or insurance claims at this property in the last 3 years? What carrier currently insures it and at what premium?
- The area grade is low — what's the realistic commute time and amenity access for the typical tenant pool here? Any planned neighborhood developments (good or bad) we should know about?
- This sits on a lake — are riparian / water-frontage rights deeded with the parcel? Any dock permits, shoreline easements, or HOA water-use restrictions?
- What's the documented flood / surge / shoreline-erosion history here (FEMA AND non-FEMA — e.g., storm surge, creek backup, septic-field saturation)?
- Any water-quality or seasonal algae-bloom issues that affect tenant satisfaction or short-term-rental demand?
- What's the average days-on-market for RENTAL listings here right now (not sales)? A rising rental-DOM trend means longer vacancies and softer asking-rent achievability than the comps imply.
- What's the recent tenant-quality profile in this submarket — average credit score on applications, eviction rate, late-payment / NSF rate, and stable-employment percentage? A property-management company in the area should have these aggregated.
- How much new for-sale + rental construction is in the pipeline within 1–3 miles? Heavy new supply typically softens prices + rents 12–24 months out; constrained supply supports both.
Investment metrics
- 1% rule
- 0.61% ✗
- Cap rate
- 3.83%
- Cash-on-cash
- -8.81%
- DSCR
- 0.61
- GRM
- 13.6
CMA / ARV
- ARV (median comp)
- $268,597
- List price
- $138,000
- Delta
- -48.62%
- Verdict
- UNDERPRICED
- Comps
- 3 within 1.0 mi
Show comp detail 1 sale within ~0.75 mi
| Address | Dist | Beds/Ba | Sqft | Sold | Price | $/sf | Match |
|---|---|---|---|---|---|---|---|
| 155 Bedrock | 0.09mi | 1/1.0 (-1) | 960 (+7%) | 11mo | $210,000 | $219 | 71 |
Match score weights: distance 35% · size 25% · config 20% · recency 20%. Top-matched comps best support the ARV.
Projected returns pro-forma
0.53% appreciation · 3.0% rent growth · sell at horizon
- IRR
- -9.9%
- Equity multiple
- 0.52×
- Total profit
- $-18,657
- Equity at exit
- $43,733
- IRR
- -3.9%
- Equity multiple
- 0.55×
- Total profit
- $-17,387
- Equity at exit
- $55,589
Cash invested: $38,640 (down + closing). Projections, not guarantees.
Landlord ↔ Tenant lean methodology
- Overall (STATE)
- 43 Moderately Tenant-Leaning
- State Illinois
- 43 Moderately Tenant-Leaning · D+7
- County
- — inherits STATE
- City
- — inherits STATE
ZIP-level market 62932
- Home prices YoY
- 0.6%
- Active inventory
- 12
- Price-to-rent
- 13.6×
Monthly cashflow live
- Estimated rent
- $848 medium interval (Pro) →
- Mortgage (P&I)
- −$724
- Tax est. 1.5%
- −$172 /mo · $2,070/yr
- Insurance
- −$58
- HOA
- −$0
- Vacancy / Maint / Mgmt
- −$178
- Net cashflow
- $-284
Break-even live
UW: 25.0% down · 7.5% · 30yr · 1.5% tax · 5.0% vac · 8.0% maint · 8.0% mgmt
Financing live
Cash to close
- Down payment
- $34,500
- Closing costs
- $4,140
- Reserves months
- —
- Total cash needed
- —
Loan-product check · same deal, 3 products live
Conventional
25% down · 7.5% · 30yr
- Down + closing
- —
- Monthly P&I
- —
- Monthly cashflow
- —
- DSCR
- —
- Eligible?
- —
Personal DTI + credit; lowest rate.
DSCR
20% down · 8.5% · 30yr
- Down + closing
- —
- Monthly P&I
- —
- Monthly cashflow
- —
- DSCR
- —
- Eligible?
- —
No personal income docs; deal must DSCR.
Hard money
10% down · 12.0% · 12mo
- Down + closing
- —
- Monthly P&I
- —
- Monthly cashflow
- —
- DSCR
- —
- Eligible?
- —
Short-term bridge; refi at stabilization.
Listing history 20 events
-
2026-06-18days on market $138,000 Active 113 DOM
-
2026-06-17days on market $138,000 Active 112 DOM
-
2026-06-16days on market $138,000 Active 111 DOM
-
2026-06-15days on market $138,000 Active 110 DOM
-
2026-06-13days on market $138,000 Active 108 DOM
-
2026-06-12days on market $138,000 Active 107 DOM
-
2026-06-09days on market $138,000 Active 104 DOM
-
2026-06-08days on market $138,000 Active 103 DOM
-
2026-06-07days on market $138,000 Active 102 DOM
-
2026-06-05days on market $138,000 Active 100 DOM
-
2026-06-04days on market $138,000 Active 98 DOM
-
2026-06-02days on market $138,000 Active 97 DOM
-
2026-06-01days on market $138,000 Active 96 DOM
-
2026-05-31days on market $138,000 Active 95 DOM
-
2026-05-31days on market $138,000 Active 94 DOM
-
2026-03-26price $138,000 483-char remark
Show marketing remark (483 chars)
Lake living on your bucket list? This gorgeous custom 2 bedroom home is absolutely perfect. Enjoy your well equipment kitchen with top on the line appliances and custom cabinets and countertops that flow straight into your cozy living room. 2 good sized bedrooms and shared bath. Step outside to your covered porch and enjoy your lake front vibes. Shared pavilion for the ones that like to entertain. All one level and would be a great vacation home or an Airbnb. Unbelievable price.
-
2026-02-23$139,900 Active 483-char remark
Show marketing remark (483 chars)
Lake living on your bucket list? This gorgeous custom 2 bedroom home is absolutely perfect. Enjoy your well equipment kitchen with top on the line appliances and custom cabinets and countertops that flow straight into your cozy living room. 2 good sized bedrooms and shared bath. Step outside to your covered porch and enjoy your lake front vibes. Shared pavilion for the ones that like to entertain. All one level and would be a great vacation home or an Airbnb. Unbelievable price.
-
2025-10-03historical
-
2025-10-02historical
-
2025-04-04Active
ⓘ Source: listings_history table (triggers on properties + properties_extension) + one-shot
backfill from property_details.listing_events for pre-trigger history.
Climate risk First Street
- Flood 1/10 Low FEMA zone X (unshaded) · 0% chance over 30 yrs
- Wildfire 1/10 Low
- Heat 5/10 Major 7 d/yr ≥108°F today · 22 d/yr by 30 yrs out
- Wind 3/10 Moderate 5% chance of damaging wind over 30 yrs
- Air quality 2/10 Low 0 unhealthy d/yr today · 2 by 30 yrs out
Nearby sold comps map
Loading sold comps map…
Walkable amenities ~0.75 mi
Loading nearby amenities…
Taxation est. · year 1
- Rental income
- $10,175
- − Mortgage interest
- −$7,730
- − Property taxes
- −$2,070
- − Insurance
- −$690
- − Repairs & maintenance
- −$814
- − Management
- −$814
- − Depreciation
- −$4,015
- Taxable loss
- −$5,957
- Est. tax savings @ 24.0%
- +$1,430
- After-tax cash flow
- $-1,976/yr
For passive investors: Depreciation is non-cash, so a rental often shows a tax loss while cash-flowing — sheltering income. Rental losses are passive: they offset passive income freely, and up to $25,000/yr can offset ordinary (W-2) income if you actively participate and your MAGI is under $100k (phasing out to $0 by $150k); unused losses carry forward. On sale, claimed depreciation is recaptured at up to 25%, and gains may owe capital-gains tax (a 1031 exchange can defer both). Figures are a year-1 estimate at your 24.0% rate — not tax advice; consult a CPA.
Schools (NCES district)
- District
- Elverado CUSD 196
- NCES district ID
- 1713860
- Math proficiency
- 25% ▲ 3.00%
- Reading proficiency
- 45% ▲ 8.00%
- Median HH income
- $42,241
- Composite
- 32.2/100
- National rank
- #10962
- State rank
- #418 of 919 in IL
Livability — Elkville
- Score
- 58/100
- State rank
- #1123
- US rank
- #21198
Category grades
Schools grade is shown separately in the Schools card above.
Census & demographics
- Population (ZIP)
- 1,178
Population outlook (Jackson County) Hauer SSP2
- Today (2025)
- 59,093 people
- By 2030
- 59,628 · +0.9%
- By 2040
- 59,495 · +0.7%
- By 2050
- 58,811 · -0.5%
- By 2075
- 57,683 · -2.4%
- By 2100
- 55,337 · -6.4%
Race, ethnicity, and origin ACS 2023
- Neighborhood character
- Predominantly White (85%)
- Race & ethnicity
- White 85% Hispanic / Latino 8% Two or more races 6%
- Hispanic origin (detail)
- Mexican 7%
- Common ancestry
- Italian 3% Lithuanian 2% Romanian 2%
- Foreign-born
- 3% · Canada
- Languages at home
- 92% English-only · Spanish 7% German/W. Germanic 1% Other Indo-European 1%
Political lean MEDSL · Jackson
- 2024 margin
- Toss-up / Even · D 51.0% · R 47.5% · Other 1.4%
- 2008→2024 swing
- -18.3pp toward R · 2008: 21.8pp · 2024: 3.5pp
- All cycles
- 2024: D+3.5 2020: D+1.3 2016: D+3.0 2012: D+10.3 2008: D+21.8
Not yet ingested
- Civics
- —
Market trends
- HPI YoY
- ▲ 0.53%
- Current HPI
- 96.1674
- Rent YoY
- —
- Metro
- —
- State GDP YoY
- ▲ 1.59%
- F500 in state
- 60
Industry mix (Fortune 500 HQ in IL)
| Industry | F500 HQs | Revenue |
|---|---|---|
| Insurance | 4 | $201B |
|
||
| Consumer Goods | 4 | $87B |
|
||
| Industrial Machinery | 3 | $64B |
|
||
| Healthcare | 2 | $55B |
|
||
| Retail / Pharmacy | 1 | $148B |
|
||
| Agriculture / Food | 1 | $86B |
|
||
Price history
-1.4% since first listed5 events — show timeline
- 2026-03-26 Price Changed $138,000 RMLSA as Distributed by MLS Grid
- 2026-02-23 Listed $139,900 RMLSA as Distributed by MLS Grid
- 2025-10-03 Listing Removed — RMLSA as Distributed by MLS Grid
- 2025-10-02 Listing Removed — MRED as Distributed by MLS Grid
- 2025-04-04 Listed — RMLSA as Distributed by MLS Grid
Cash-flow waterfall
monthlySold comps — $/sqft
last 12 mo · ≤1 miLoading sold comps…