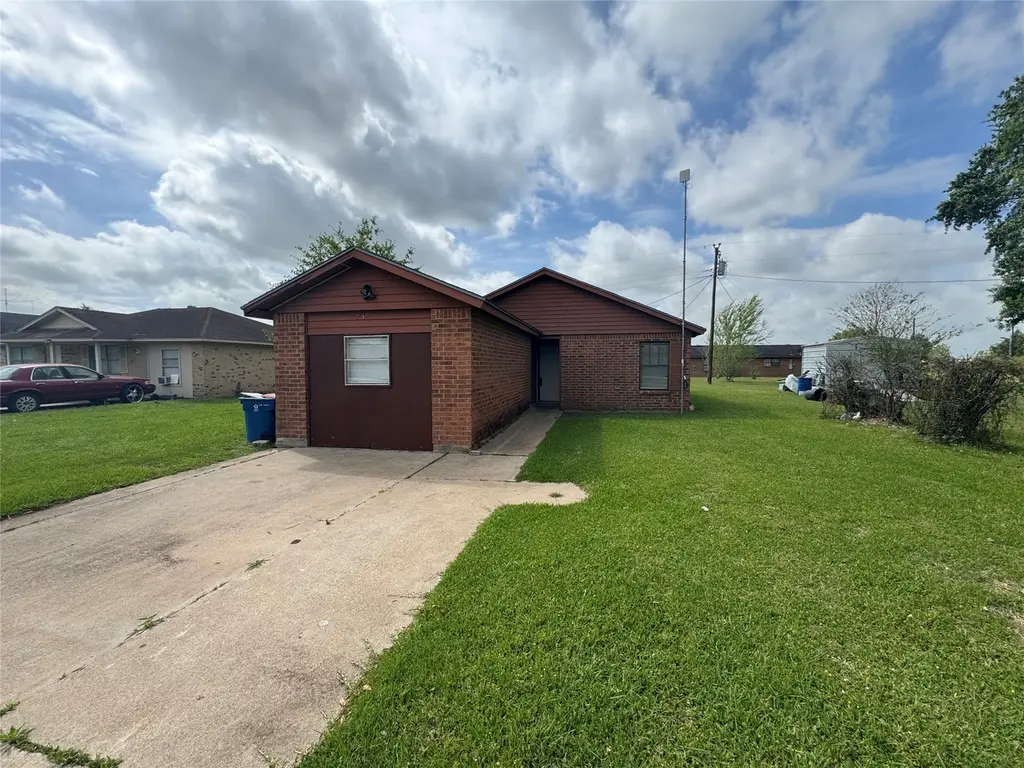
733 Pine Ave · Prairie View, TX
Flood risk 1/10 · Minimal
- FEMA flood zone
- X (unshaded)
- Chance of flooding over 30 yrs
- 0.0%
- Est. flood insurance / yr
- $507 – $1,088
Fire risk 5/10 · Moderate
- Est. fire insurance / yr
- $1,222 – $2,270
Heat risk 9/10 · Severe
- Hot days now (above 111°F)
- 7 days/yr
- Hot days in 30 yrs
- 22 days/yr
Wind risk 8/10 · Major
- Chance of severe wind over 30 yrs
- 99.0%
Air-quality risk 2/10 · Minimal
- Unhealthy air days now
- 1 days/yr
- Unhealthy air days in 30 yrs
- 1 days/yr
Risk factors via First Street. Map © Google.
Why this score? — see what drove the D grade
The composite is a weighted blend of 9 inputs, each scored 0–100. Each bar is that input's sub-score; the figure is the points it added to the 100-point composite (weight × sub-score).
- ARV discount +15.0/15.0
- Appreciation +10.0/10.0
- Cash flow +3.3/30.0
- Schools +2.9/10.0
- Livability +2.7/5.0
- Rent growth +2.5/5.0
- Condition / age +2.5/5.0
- 1% rule +1.2/10.0
- DSCR +0.0/10.0
$125,000
🖨 Deal sheet (PDF) 📄 Offer letter ✓ Due diligence
Listing remarks MLS
A Great Investment Property or First-Time Home Buyer recently updated in Prairie View Texas is looking for a New Owner. This well maintained home has 3 Bedrooms and 1 Bath with a nice Open Living Room and Kitchen coming with a Fridge and Electric Stove range. Home is on a Large Lot (9,000+ sq ft per WCAD) and is within a 10 minute drive to Prairie View A&M and less than 5 minutes to Hwy 290. Great Rental Income Potential! Seller was previously renting for $1,300 a month as is.
Key facts
- Open living room
- Large lot
- 9,147 sq ft lot
Tags
Neighborhood map
What this means for you Summary
Snapshot
- This is a 3-bed/1.0-bath single-family listed at $125k.
Deal economics
- At list price, monthly cash flow is $-389 ($-5k/yr) — negative.
- To cash-flow at today's rent, offer at most $69k (44.6% below list).
- To meet the 1% rule (rent ≥ 1% of price), the offer needs to be $77k (38.5% below list).
- Recommended offer: $69k (44.6% below list) — sets the bar for cash-flow.
- Cap rate 2.6% vs local median 0.4% in Prairie View — top-decile yield for the area; either an underpriced asset or a hidden risk that comps aren't pricing in. Stress-test before assuming the spread holds.
Location & tenants
- Location reads 53/100 on livability (#1,428 in TX) — a working-class tenant base; expect higher turnover. Strengths: cost of living A+, crime A-; Watch: housing C-, schools D-, amenities F.
- Waller ISD (rural): math 30% / reading 35% proficiency, ranked #532 of 826 in TX (top 64%) — families likely to look elsewhere, expect single-tenant / working-renter base with shorter leases.
- Market conditions: 425 active listings in the ZIP; 5 comparable units currently listed for rent nearby; rentals leasing fast (median 3d on market — plan ~1-2 weeks tenant-placement turnaround); 483 units permitted in Waller County in 2024 (89 in 5+ unit buildings).
Forward outlook
- In year one you build about $13k of equity ($864 loan paydown + $12k appreciation (10.0% local appreciation)).
- Waller County population projected at +62% by 2050 — long-run rental-demand tailwind backs the buy-and-hold thesis.
- By year 3, paydown + projected appreciation supports a ~$34k cash-out refi (75% LTV) — recoverable capital for the next deal without selling this one.
Negotiation context
- It's been on market 68 days — a 6% lower offer ($118k) is reasonable based on typical stale-listing flexibility.
- 8 sale attempts since 21y ago; this cycle's ask has dropped $55k (31%) from the opening price — seller is motivated, your offer sets the floor, not the list.
Risks & watch-outs
- Watch-outs: property tax is 2.8% of price.
- Climate carrying-cost: severe wind risk, 99% chance of damaging wind over 30y; moderate wildfire risk; extreme-heat days projected 7→22/yr by 2055 (HVAC capex compounding) — expect insurance premiums to compound above CPI over the hold.
Questions for the listing agent
- What do current leases actually rent for vs. the listed asking? Can we see a recent rent roll and the last 12 months of T-12 income?
- It's been on market 68 days. Have you received any prior offers? Is the seller open to a 45% concession, seller financing, or rate buy-down credit?
- Property tax is high relative to price — has the assessment been appealed recently, and will the sale trigger a re-assessment?
- Why hasn't it sold? Are there any deal-killer items the seller is aware of (foundation, flood, title, zoning, code violations)?
- Is there a deadline driving the sale (1031 exchange, divorce, estate, relocation)? That informs how much negotiation room exists.
- Schools are D-rated, which usually means shorter tenancies and higher turnover. Who's the typical renter profile here, and what's been the actual vacancy rate?
- The area grade is low — what's the realistic commute time and amenity access for the typical tenant pool here? Any planned neighborhood developments (good or bad) we should know about?
- What's the average days-on-market for RENTAL listings here right now (not sales)? A rising rental-DOM trend means longer vacancies and softer asking-rent achievability than the comps imply.
- What's the recent tenant-quality profile in this submarket — average credit score on applications, eviction rate, late-payment / NSF rate, and stable-employment percentage? A property-management company in the area should have these aggregated.
- How much new for-sale + rental construction is in the pipeline within 1–3 miles? Heavy new supply typically softens prices + rents 12–24 months out; constrained supply supports both.
Investment metrics
- 1% rule
- 0.62% ✗
- Cap rate
- 2.56%
- Cash-on-cash
- -13.33%
- DSCR
- 0.41
- GRM
- 13.5
CMA / ARV
- ARV (median comp)
- $170,903
- List price
- $125,000
- Delta
- -26.86%
- Verdict
- UNDERPRICED
- Comps
- 16 within 1.0 mi
Show comp detail 3 sales within ~0.75 mi
| Address | Dist | Beds/Ba | Sqft | Sold | Price | $/sf | Match |
|---|---|---|---|---|---|---|---|
| 170 Pine Mdws | 0.04mi | 3/1.0 | 1,158 (-9%) | 5mo | $170,000 | $147 | 79 |
| 742 Pine Ave | 0.03mi | 3/1.0 | 1,145 (-10%) | 11mo | $175,000 | $153 | 73 |
| 122 Pine Meadows Cir | 0.09mi | 2/1.0 (-1) | 1,458 (+14%) | 21mo | $159,990 | $110 | 49 |
Match score weights: distance 35% · size 25% · config 20% · recency 20%. Top-matched comps best support the ARV.
Projected returns pro-forma
10.0% appreciation · 3.0% rent growth · sell at horizon
- IRR
- 15.0%
- Equity multiple
- 2.24×
- Total profit
- $43,417
- Equity at exit
- $112,610
- IRR
- 14.7%
- Equity multiple
- 5.21×
- Total profit
- $147,506
- Equity at exit
- $242,848
Cash invested: $35,000 (down + closing). Projections, not guarantees.
Landlord ↔ Tenant lean methodology
- Overall (STATE)
- 87 Strongly Landlord-Friendly
- State Texas
- 87 Strongly Landlord-Friendly · R+5
- County
- — inherits STATE
- City
- — inherits STATE
ZIP-level market 77445
- Home prices YoY
- 12.3%
- Active inventory
- 425
- Price-to-rent
- 13.5×
Monthly cashflow live
- Estimated rent
- $769 medium interval (Pro) →
- Mortgage (P&I)
- −$656
- Tax from tax record
- −$289 /mo · $3,462/yr
- Insurance
- −$52
- HOA
- −$0
- Vacancy / Maint / Mgmt
- −$161
- Net cashflow
- $-389
Break-even live
Sensitivity live
| Price | -10% $-318 | -5% $-353 | +0% $-389 | +5% $-424 | +10% $-459 |
|---|---|---|---|---|---|
| Rent | -10% $-449 | -5% $-419 | +0% $-389 | +5% $-358 | +10% $-328 |
| Rate | -1.0pp $-326 | -0.5pp $-357 | base $-389 | +0.5pp $-421 | +1.0pp $-454 |
UW: 25.0% down · 7.5% · 30yr · 1.5% tax · 5.0% vac · 8.0% maint · 8.0% mgmt
Financing live
Cash to close
- Down payment
- $31,250
- Closing costs
- $3,750
- Reserves months
- —
- Total cash needed
- —
Loan-product check · same deal, 3 products live
Conventional
25% down · 7.5% · 30yr
- Down + closing
- —
- Monthly P&I
- —
- Monthly cashflow
- —
- DSCR
- —
- Eligible?
- —
Personal DTI + credit; lowest rate.
DSCR
20% down · 8.5% · 30yr
- Down + closing
- —
- Monthly P&I
- —
- Monthly cashflow
- —
- DSCR
- —
- Eligible?
- —
No personal income docs; deal must DSCR.
Hard money
10% down · 12.0% · 12mo
- Down + closing
- —
- Monthly P&I
- —
- Monthly cashflow
- —
- DSCR
- —
- Eligible?
- —
Short-term bridge; refi at stabilization.
Rent comps 5 comps
| Address | Beds | Baths | Sqft | Rent | $/sqft | DOM | Units | Dist |
|---|---|---|---|---|---|---|---|---|
| 23269 Richards Rd Unit 8A Prairie View, TX | 4.0 | 4.0 | 1700 | $720 | $0.42 | 3d | 1 | 0.60mi |
| 23338 High Point St Unit 53B Prairie View, TX | 4.0 | 4.0 | 1700 | $695 | $0.41 | 25d | 1 | 0.62mi |
| 23449 High Point St Prairie View, TX | 4.0 | 4.0 | 1700 | $849 | $0.50 | 0d | 1 | 0.68mi |
| 23467 High Point St Unit 51A Prairie View, TX | 4.0 | 4.0 | 1700 | $825 | $0.49 | 45d | 1 | 0.69mi |
| 625 Elm St Hempstead, TX | 1.0–2.0 | 1.0–2.0 | 787 | $1,855 | $2.36 | 0d | 1 | 1.33mi |
Listing history 32 events
-
2026-06-17days on market $125,000 Active 68 DOM
-
2026-06-16days on market $125,000 Active 67 DOM
-
2026-06-15days on market $125,000 Active 66 DOM
-
2026-06-13days on market $125,000 Active 64 DOM
-
2026-06-09days on market $125,000 Active 60 DOM
-
2026-06-08days on market $125,000 Active 59 DOM
-
2026-06-07days on market $125,000 Active 58 DOM
-
2026-06-04days on market $125,000 Active 55 DOM
-
2026-06-03days on market $125,000 Active 54 DOM
-
2026-06-02days on market $125,000 Active 53 DOM
-
2026-06-01days on market $125,000 Active 52 DOM
-
2026-05-31days on market $125,000 Active 51 DOM
-
2026-05-12price $125,000 487-char remark
Show marketing remark (487 chars)
A Great Investment Property or First-Time Home Buyer recently updated in Prairie View Texas is looking for a New Owner. This well maintained home has 3 Bedrooms and 1 Bath with a nice Open Living Room and Kitchen coming with a Fridge and Electric Stove range. Home is on a Large Lot (9,000+ sq ft per WCAD) and is within a 10 minute drive to Prairie View A&M and less than 5 minutes to Hwy 290. Great Rental Income Potential! Seller was previously renting for $1,300 a month as is.
-
2026-04-10$180,000 Active 487-char remark
Show marketing remark (487 chars)
A Great Investment Property or First-Time Home Buyer recently updated in Prairie View Texas is looking for a New Owner. This well maintained home has 3 Bedrooms and 1 Bath with a nice Open Living Room and Kitchen coming with a Fridge and Electric Stove range. Home is on a Large Lot (9,000+ sq ft per WCAD) and is within a 10 minute drive to Prairie View A&M and less than 5 minutes to Hwy 290. Great Rental Income Potential! Seller was previously renting for $1,300 a month as is.
-
2024-10-29historical $1,500
-
2024-10-29historical
-
2024-08-07price $150,000
-
2024-07-31$1,500
-
2024-07-03price $160,000
-
2024-05-16price $165,000
-
2024-05-04price $170,000
-
2024-04-10$175,000 Active
-
2009-07-23historical
-
2009-04-16$65,000
-
2009-03-31historical
-
2009-02-04$65,000
-
2008-12-01historical
-
2008-08-26$68,000
-
2006-03-10historical
-
2005-10-10$75,000
-
2005-08-17historical
-
2005-02-17$79,900
ⓘ Source: listings_history table (triggers on properties + properties_extension) + one-shot
backfill from property_details.listing_events for pre-trigger history.
Tax reassessment forecast TX · Resets to sale price
- Current annual tax
- $3,462 · $289/mo
- Projected year-2 tax
- $3,462 · $289/mo
- Expected delta
- $0/yr ($0/mo · 0.0%)
ⓘ Screening estimate from a state-policy table — verify with the county assessor before closing.
Climate risk First Street
- Flood 1/10 Low FEMA zone X (unshaded) · 0% chance over 30 yrs
- Wildfire 5/10 Major
- Heat 9/10 Extreme 7 d/yr ≥111°F today · 22 d/yr by 30 yrs out
- Wind 8/10 Severe 99% chance of damaging wind over 30 yrs
- Air quality 2/10 Low 1 unhealthy d/yr today · 1 by 30 yrs out
Nearby sold comps map
Loading sold comps map…
Walkable amenities ~0.75 mi
Loading nearby amenities…
Taxation est. · year 1
- Rental income
- $9,227
- − Mortgage interest
- −$7,002
- − Property taxes
- −$3,462
- − Insurance
- −$625
- − Repairs & maintenance
- −$738
- − Management
- −$738
- − Depreciation
- −$3,636
- Taxable loss
- −$6,975
- Est. tax savings @ 24.0%
- +$1,674
- After-tax cash flow
- $-2,990/yr
For passive investors: Depreciation is non-cash, so a rental often shows a tax loss while cash-flowing — sheltering income. Rental losses are passive: they offset passive income freely, and up to $25,000/yr can offset ordinary (W-2) income if you actively participate and your MAGI is under $100k (phasing out to $0 by $150k); unused losses carry forward. On sale, claimed depreciation is recaptured at up to 25%, and gains may owe capital-gains tax (a 1031 exchange can defer both). Figures are a year-1 estimate at your 24.0% rate — not tax advice; consult a CPA.
Schools (NCES district)
- District
- Waller ISD
- NCES district ID
- 4844430
- Math proficiency
- 30% ▼ -23.00%
- Reading proficiency
- 35% ▼ -11.00%
- Median HH income
- $58,911
- Composite
- 29.12/100
- National rank
- #6593
- State rank
- #532 of 826 in TX
Livability — Prairie View
- Score
- 53/100
- State rank
- #1428
- US rank
- #24407
Category grades
Schools grade is shown separately in the Schools card above.
Census & demographics
- Census place
- Prairie View, TX
- City population
- 6,060
- Population (ZIP)
- 14,943
Population outlook (Waller County) Hauer SSP2
- Today (2025)
- 60,772 people
- By 2030
- 67,616 · +11.3%
- By 2040
- 82,283 · +35.4%
- By 2050
- 98,276 · +61.7%
- By 2075
- 142,860 · +135.1%
- By 2100
- 175,596 · +188.9%
Race, ethnicity, and origin ACS 2023
- Neighborhood character
- Diverse neighborhood (Simpson 0.69)
- Race & ethnicity
- Hispanic / Latino 34% White 32% Black 31% Two or more races 10% Native American 2%
- Hispanic origin (detail)
- Mexican 30% Cuban 1%
- Common ancestry
- Romanian 2% Lithuanian 2% Slovak 1%
- Foreign-born
- 13% · Canada
- Languages at home
- 74% English-only · Spanish 25%
Political lean MEDSL · Waller
- 2024 margin
- Strong R (+25.0) · D 37.0% · R 62.0% · Other 1.0%
- 2008→2024 swing
- -17.9pp toward R · 2008: -7.2pp · 2024: -25.0pp
- All cycles
- 2024: R+25.0 2020: R+26.7 2016: R+28.6 2012: R+17.6 2008: R+7.2
Not yet ingested
- Civics
- —
Market trends
- HPI YoY
- ▲ 39.43%
- Current HPI
- 359.93
- Rent YoY
- —
- Metro
- —
- State GDP YoY
- ▲ 3.95%
- F500 in state
- 110
Industry mix (Fortune 500 HQ in TX)
| Industry | F500 HQs | Revenue |
|---|---|---|
| Energy | 16 | $1,198B |
|
||
| Technology | 5 | $198B |
|
||
| Engineering / Construction | 4 | $72B |
|
||
| Energy Services | 3 | $60B |
|
||
| Utilities | 3 | $41B |
|
||
| Healthcare | 2 | $330B |
|
||
Price history
+56.4% since first listed20 events — show timeline
- 2026-05-12 Price Changed $125,000 HARMLS
- 2026-04-10 Listed $180,000 HARMLS
- 2024-10-29 Rental Removed $1,500 HARMLS
- 2024-10-29 Listing Removed — HARMLS
- 2024-08-07 Price Changed $150,000 HARMLS
- 2024-07-31 Listed for Rent $1,500 HARMLS
- 2024-07-03 Price Changed $160,000 HARMLS
- 2024-05-16 Price Changed $165,000 HARMLS
- 2024-05-04 Price Changed $170,000 HARMLS
- 2024-04-10 Listed $175,000 HARMLS
- 2009-07-23 Listing Removed — HARMLS
- 2009-04-16 Listed $65,000 HARMLS
- 2009-03-31 Listing Removed — HARMLS
- 2009-02-04 Listed $65,000 HARMLS
- 2008-12-01 Listing Removed — HARMLS
- 2008-08-26 Listed $68,000 HARMLS
- 2006-03-10 Listing Removed — HARMLS
- 2005-10-10 Listed $75,000 HARMLS
- 2005-08-17 Listing Removed — HARMLS
- 2005-02-17 Listed $79,900 HARMLS
Property tax history
+3.5%/yrLatest (2025): $3,462 · -0.2% YoY. Source: county tax records.
Cash-flow waterfall
monthlySold comps — $/sqft
last 12 mo · ≤1 miLoading sold comps…