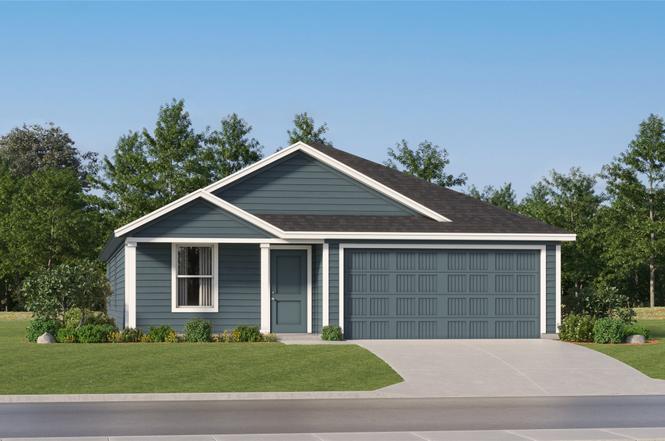
223 Navidad River Dr · San Marcos, TX
Flood risk 1/10 · Minimal
- FEMA flood zone
- X (unshaded)
- Chance of flooding over 30 yrs
- 0.0%
- Est. flood insurance / yr
- $507 – $1,088
Fire risk 5/10 · Moderate
- Est. fire insurance / yr
- $1,222 – $2,270
Heat risk 8/10 · Major
- Hot days now (above 108°F)
- 6 days/yr
- Hot days in 30 yrs
- 18 days/yr
Wind risk 8/10 · Major
- Chance of severe wind over 30 yrs
- 80.0%
Air-quality risk 1/10 · Minimal
- Unhealthy air days now
- 0 days/yr
- Unhealthy air days in 30 yrs
- 0 days/yr
Risk factors via First Street. Map © Google.
Why this score? — see what drove the D- grade
The composite is a weighted blend of 9 inputs, each scored 0–100. Each bar is that input's sub-score; the figure is the points it added to the 100-point composite (weight × sub-score).
- Cash flow +12.9/30.0
- ARV discount +6.2/15.0
- 1% rule +4.0/10.0
- Livability +4.0/5.0
- DSCR +3.9/10.0
- Rent growth +3.0/5.0
- Condition / age +2.5/5.0
- Schools +2.0/10.0
- Appreciation +0.0/10.0
$224,990
🖨 Deal sheet 📄 Offer letter ✓ Due diligence
Listing remarks
The Oxford - This single-level home features a modern layout perfect for a variety of lifestyles. Three secondary bedrooms are located off the entry, leading to an open-concept floorplan combining the kitchen with the living and dining areas. The luxurious owner’s suite is tucked into a private back corner, offering access to a spa-inspired bathroom and roomy walk-in closet. Photos are for illustrative purposes only. Estimated Completion April 2026. The completion date, prices and features may vary and are subject to change. Please verify with Lennar directly.
Key facts
- 5,227 sq ft lot
- 2 garage spots
- Built 2026
Neighborhood map
What this means for you Summary
Snapshot
- This is a 4-bed/2.0-bath single-family listed at $225k.
Deal economics
- At list price, monthly cash flow is $-17 ($-198/yr) — negative.
- To cash-flow at today's rent, offer at most $223k (1.1% below list).
- To meet the 1% rule (rent ≥ 1% of price), the offer needs to be $203k (9.8% below list).
- Recommended offer: $203k (9.8% below list) — sets the bar for 1% rule.
- Cap rate 6.2% vs local median 3.1% in San Marcos — top-decile yield for the area; either an underpriced asset or a hidden risk that comps aren't pricing in. Stress-test before assuming the spread holds.
Location & tenants
- Location reads 81/100 on livability (#30 in TX, #1,601 nationally) — a professional / high-income tenant draw. Strengths: amenities A+, cost of living A+, health & safety A+; Watch: crime D+, schools F, employment F.
- San Marcos CISD (rural): math 18% / reading 31% proficiency, ranked #731 of 826 in TX (top 88%) — low school quality limits family demand, transient renter base, plan for 1-2y turnover; 63% free/reduced lunch — lower-income household profile, screen leases tightly.
- Market conditions: Rents rising (+2.0%/yr); 1122 active listings in the ZIP; 3 comparable units currently listed for rent nearby; rentals at typical pace (median 24d on market — plan ~3-4 weeks tenant-placement turnaround); 5,270 units permitted in Hays County in 2024 (1,464 in 5+ unit buildings).
- This rent runs 44% of the median local income ($55k/yr) — at the standard rent-burdened threshold; future hikes will face affordability resistance.
Forward outlook
- Local home prices are declining (-3.0%/yr); year-one equity from $2k of loan paydown is wiped out by about $7k of value loss. Plan a longer hold.
- Hays County population projected at +93% by 2050 — long-run rental-demand tailwind backs the buy-and-hold thesis.
Negotiation context
- It's been on market 32 days — a 3% lower offer ($218k) is reasonable based on typical stale-listing flexibility.
Risks & watch-outs
- Climate carrying-cost: severe wind risk, 80% chance of damaging wind over 30y; moderate wildfire risk; extreme-heat days projected 6→18/yr by 2055 (HVAC capex compounding) — expect insurance premiums to compound above CPI over the hold.
Questions for the listing agent
- What do current leases actually rent for vs. the listed asking? Can we see a recent rent roll and the last 12 months of T-12 income?
- It's been on market 32 days. Have you received any prior offers? Is the seller open to a 10% concession, seller financing, or rate buy-down credit?
- What does the HOA fee cover, when was the last increase, and are there any pending special assessments or reserve-fund shortfalls?
- Is there a deadline driving the sale (1031 exchange, divorce, estate, relocation)? That informs how much negotiation room exists.
- Schools are F-rated, which usually means shorter tenancies and higher turnover. Who's the typical renter profile here, and what's been the actual vacancy rate?
- Crime grade is D in this area — have there been break-ins, vandalism, or insurance claims at this property in the last 3 years? What carrier currently insures it and at what premium?
- The area grade is low — what's the realistic commute time and amenity access for the typical tenant pool here? Any planned neighborhood developments (good or bad) we should know about?
- What's the average days-on-market for RENTAL listings here right now (not sales)? A rising rental-DOM trend means longer vacancies and softer asking-rent achievability than the comps imply.
- What's the recent tenant-quality profile in this submarket — average credit score on applications, eviction rate, late-payment / NSF rate, and stable-employment percentage? A property-management company in the area should have these aggregated.
- How much new for-sale + rental construction is in the pipeline within 1–3 miles? Heavy new supply typically softens prices + rents 12–24 months out; constrained supply supports both.
Investment metrics
- 1% rule
- 0.90% ✗
- Cap rate
- 6.20%
- Cash-on-cash
- -0.31%
- DSCR
- 0.99
- GRM
- 9.2
CMA / ARV
- ARV (on-the-fly)
- $218,496
- Comps found
- 12
Show comp detail 12 sales within ~0.75 mi
| Address | Dist | Beds/Ba | Sqft | Sold | Price | $/sf | Match |
|---|---|---|---|---|---|---|---|
| 223 Navidad River Dr | 0.00mi | 4/2.0 | 1,707 (0%) | 1mo | $224,990 | $132 | 99 |
| 214 Trinity River Holw | 0.10mi | 4/2.0 | 1,707 (0%) | 1mo | $223,990 | $131 | 95 |
| 212 Navidad River Dr | 0.04mi | 4/2.5 | 1,802 (+6%) | 1mo | $198,999 | $110 | 86 |
| 232 Navidad River Dr | 0.04mi | 4/2.5 | 1,802 (+6%) | 2mo | $215,990 | $120 | 85 |
| 219 Navidad River Dr | 0.01mi | 4/2.0 | 1,845 (+8%) | 1mo | $226,990 | $123 | 85 |
| 208 Trinity River Holw | 0.10mi | 4/2.0 | 1,850 (+8%) | 1mo | $235,990 | $128 | 81 |
| 235 Navidad River Dr | 0.02mi | 4/2.5 | 1,891 (+11%) | 1mo | $232,990 | $123 | 79 |
| 116 Stumpy St | 0.17mi | 4/2.0 | 1,845 (+8%) | 1mo | $264,990 | $144 | 78 |
| 204 Navidad River Dr | 0.05mi | 4/2.0 | 1,500 (-12%) | 1mo | $211,999 | $141 | 77 |
| 308 Navidad River Dr | 0.07mi | 4/2.0 | 1,500 (-12%) | 2mo | $199,990 | $133 | 75 |
| 224 Trinity River Holw | 0.10mi | 4/2.5 | 1,891 (+11%) | 1mo | $229,990 | $122 | 75 |
| 136 Trinity River Holw | 0.12mi | 4/2.5 | 1,891 (+11%) | 1mo | $239,999 | $127 | 74 |
Match score weights: distance 35% · size 25% · config 20% · recency 20%. Top-matched comps best support the ARV.
Projected returns pro-forma
-3.0% appreciation · 1.98% rent growth · sell at horizon
- IRR
- -18.0%
- Equity multiple
- 0.37×
- Total profit
- $-39,501
- Equity at exit
- $33,547
- IRR
- -12.3%
- Equity multiple
- 0.31×
- Total profit
- $-43,754
- Equity at exit
- $19,453
Cash invested: $62,997 (down + closing). Projections, not guarantees.
Landlord ↔ Tenant lean methodology
- Overall (STATE)
- 87 Strongly Landlord-Friendly
- State Texas
- 87 Strongly Landlord-Friendly · R+5
- County
- — inherits STATE
- City
- — inherits STATE
ZIP-level market 78666
- Rents YoY
- 2.0%
- Active inventory
- 1122
- Price-to-rent
- 9.2×
Monthly cashflow live
- Estimated rent
- $2,030 medium interval (Pro) →
- Mortgage (P&I)
- −$1,180
- Tax est. 1.5%
- −$281 /mo · $3,375/yr
- Insurance
- −$94
- HOA
- −$65
- Vacancy / Maint / Mgmt
- −$426
- Net cashflow
- $-17
Break-even live
UW: 25.0% down · 7.5% · 30yr · 1.5% tax · 5.0% vac · 8.0% maint · 8.0% mgmt
Financing live
Cash to close
- Down payment
- $56,248
- Closing costs
- $6,750
- Reserves months
- —
- Total cash needed
- —
Loan-product check · same deal, 3 products live
Conventional
25% down · 7.5% · 30yr
- Down + closing
- —
- Monthly P&I
- —
- Monthly cashflow
- —
- DSCR
- —
- Eligible?
- —
Personal DTI + credit; lowest rate.
DSCR
20% down · 8.5% · 30yr
- Down + closing
- —
- Monthly P&I
- —
- Monthly cashflow
- —
- DSCR
- —
- Eligible?
- —
No personal income docs; deal must DSCR.
Hard money
10% down · 12.0% · 12mo
- Down + closing
- —
- Monthly P&I
- —
- Monthly cashflow
- —
- DSCR
- —
- Eligible?
- —
Short-term bridge; refi at stabilization.
Rent comps 3 comps
| Address | Beds | Baths | Sqft | Rent | $/sqft | DOM | Units | Dist |
|---|---|---|---|---|---|---|---|---|
| 213 Navidad River Dr San Marcos, TX | 4.0 | 2.0 | 2162 | $2,195 | $1.02 | 1d | 1 | 0.01mi |
| 308 Navidad River Dr San Marcos, TX | 4.0 | 2.0 | 1500 | $1,800 | $1.20 | 23d | 1 | 0.07mi |
| 426 Spring River Dr Martindale, TX | 3.0 | 2.0 | 1266 | $2,250 | $1.78 | 23d | 1 | 1.08mi |
HOA detail
- Monthly dues
- $65 · $780/yr
Listing history 5 events
-
2026-03-05status Pending
-
2026-02-20price $224,990
-
2026-02-09price $226,990
-
2026-02-06price $228,990
-
2026-02-01$235,990 Active
ⓘ Source: listings_history table (triggers on properties + properties_extension) + one-shot
backfill from property_details.listing_events for pre-trigger history.
Climate risk First Street
- Flood 1/10 Low FEMA zone X (unshaded) · 0% chance over 30 yrs
- Wildfire 5/10 Major
- Heat 8/10 Severe 6 d/yr ≥108°F today · 18 d/yr by 30 yrs out
- Wind 8/10 Severe 80% chance of damaging wind over 30 yrs
- Air quality 1/10 Low 0 unhealthy d/yr today · 0 by 30 yrs out
Nearby sold comps map
Loading sold comps map…
Walkable amenities ~0.75 mi
Loading nearby amenities…
Taxation est. · year 1
- Rental income
- $24,355
- − Mortgage interest
- −$12,603
- − Property taxes
- −$3,375
- − Insurance
- −$1,125
- − Repairs & maintenance
- −$1,948
- − Management
- −$1,948
- − HOA
- −$780
- − Depreciation
- −$6,545
- Taxable loss
- −$3,970
- Est. tax savings @ 24.0%
- +$953
- After-tax cash flow
- $755/yr
For passive investors: Depreciation is non-cash, so a rental often shows a tax loss while cash-flowing — sheltering income. Rental losses are passive: they offset passive income freely, and up to $25,000/yr can offset ordinary (W-2) income if you actively participate and your MAGI is under $100k (phasing out to $0 by $150k); unused losses carry forward. On sale, claimed depreciation is recaptured at up to 25%, and gains may owe capital-gains tax (a 1031 exchange can defer both). Figures are a year-1 estimate at your 24.0% rate — not tax advice; consult a CPA.
Schools (NCES district)
- District
- San Marcos CISD
- NCES district ID
- 4838970
- Math proficiency
- 18% ▼ -16.00%
- Reading proficiency
- 31% ▼ -8.00%
- Median HH income
- $34,538
- Composite
- 20.11/100
- National rank
- #8644
- State rank
- #731 of 826 in TX
Livability — San Marcos
- Score
- 81/100
- State rank
- #30
- US rank
- #1601
Category grades
Schools grade is shown separately in the Schools card above.
Census & demographics
- Census place
- San Marcos, TX
- County
- Hays County · 280,138 people
- City population
- 88,583
- Metro
- Austin-Round Rock-Georgetown, TX
- Population (ZIP)
- 88,583
- Household income
- $54,737
- Rent vs Own
- Severe rent burden
- 6504.0
Population outlook (Hays County) Hauer SSP2
- Today (2025)
- 286,948 people
- By 2030
- 336,923 · +17.4%
- By 2040
- 441,894 · +54.0%
- By 2050
- 553,462 · +92.9%
- By 2075
- 838,261 · +192.1%
- By 2100
- 1,063,658 · +270.7%
Race, ethnicity, and origin ACS 2023
- Neighborhood character
- Diverse neighborhood (Simpson 0.60)
- Race & ethnicity
- White 45% Hispanic / Latino 44% Two or more races 20% Black 5% Asian 2%
- Hispanic origin (detail)
- Mexican 37%
- Common ancestry
- Slovak 2% Lithuanian 2% Italian 1%
- Foreign-born
- 8% · Canada
- Languages at home
- 73% English-only · Spanish 24% Other Indo-European 1%
Political lean MEDSL · Hays
- 2024 margin
- Lean D (+5.7) · D 52.1% · R 46.5% · Other 1.4%
- 2008→2024 swing
- +7.7pp toward D · 2008: -2.0pp · 2024: 5.7pp
- All cycles
- 2024: D+5.7 2020: D+10.8 2016: R+0.9 2012: R+10.4 2008: R+2.0
Not yet ingested
- Civics
- —
Market trends
- HPI YoY
- ▼ -108.27%
- Current HPI
- 187.6679
- Rent YoY
- ▲ 1.98%
- Metro
- Austin-Round Rock-Georgetown, TX
- State GDP YoY
- ▲ 3.95%
- F500 in state
- 110
Industry mix (Fortune 500 HQ in TX)
| Industry | F500 HQs | Revenue |
|---|---|---|
| Energy | 16 | $1,198B |
|
||
| Technology | 5 | $198B |
|
||
| Engineering / Construction | 4 | $72B |
|
||
| Energy Services | 3 | $60B |
|
||
| Utilities | 3 | $41B |
|
||
| Healthcare | 2 | $330B |
|
||
Price history
-4.7% since first listed5 events — show timeline
- 2026-03-05 Pending — Unlock MLS
- 2026-02-20 Price Changed $224,990 Unlock MLS
- 2026-02-09 Price Changed $226,990 Unlock MLS
- 2026-02-06 Price Changed $228,990 Unlock MLS
- 2026-02-01 Listed $235,990 Unlock MLS
Cash-flow waterfall
monthlySold comps — $/sqft
last 12 mo · ≤1 miLoading sold comps…