 Fourplex
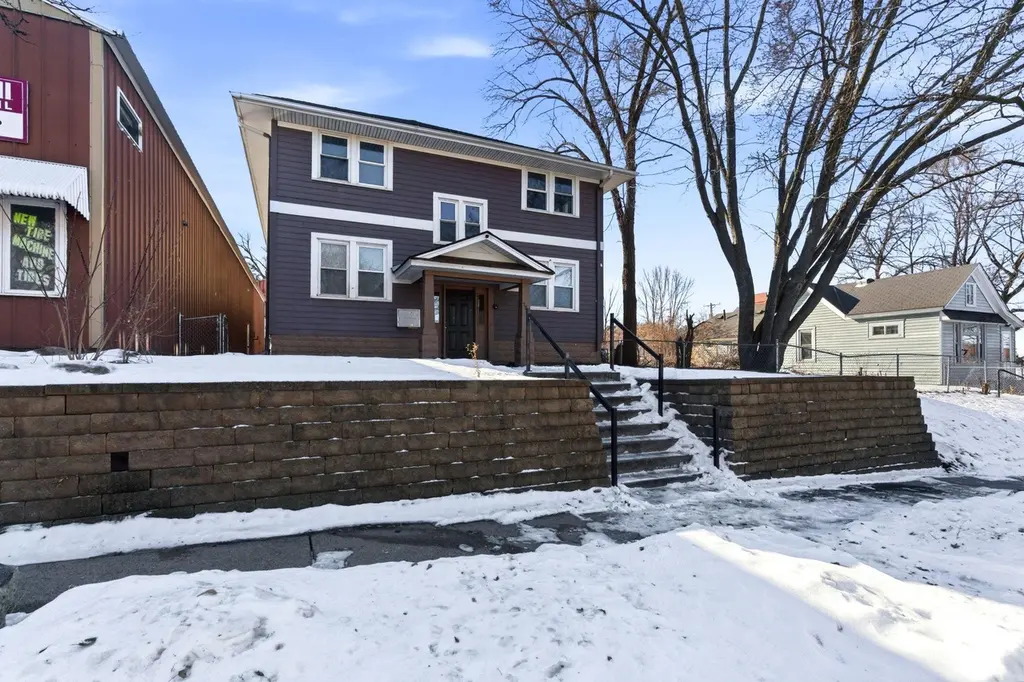
758 Reaney Ave · St. Paul, MN
Flood risk 1/10 · Minimal
- FEMA flood zone
- X (unshaded)
- Chance of flooding over 30 yrs
- 0.0%
- Est. flood insurance / yr
- $473 – $860
Fire risk 1/10 · Minimal
- Est. fire insurance / yr
- $888 – $1,650
Heat risk 2/10 · Minimal
- Hot days now (above 99°F)
- 7 days/yr
- Hot days in 30 yrs
- 14 days/yr
Wind risk 2/10 · Minimal
- Chance of severe wind over 30 yrs
- —
Air-quality risk 2/10 · Minimal
- Unhealthy air days now
- 1 days/yr
- Unhealthy air days in 30 yrs
- 1 days/yr
Risk factors via First Street. Map © Google.
Why this score? — see what drove the B- grade
The composite is a weighted blend of 9 inputs, each scored 0–100. Each bar is that input's sub-score; the figure is the points it added to the 100-point composite (weight × sub-score).
- Cash flow +30.0/30.0
- 1% rule +10.0/10.0
- DSCR +10.0/10.0
- ARV discount +7.5/15.0
- Rent growth +4.1/5.0
- Livability +2.5/5.0
- Condition / age +2.5/5.0
- Schools +2.4/10.0
- Appreciation +0.0/10.0
$650,000
🖨 Deal sheet (PDF) 📄 Offer letter ✓ Due diligence
Multi-family units
County records classify this as Multi-Family (5+ Unit). Listing-text estimate: 4 units. estimate disagrees with records
5+ unit building — per-unit beds/baths from public records are typically unavailable; the breakdown below (if shown) is an estimate from the listing text.
Listing remarks MLS
Rare opportunity to own a fully vacant 4plex in the heart of Saint Paul, allowing investors to put in their own tenants from day one. All four units have been completely remodeled, with shared common areas featuring brand new paint and carpet throughout. Each unit offers 3 bedrooms, a highly desirable and hard to find layout in multifamily properties, making this an excellent opportunity for strong rental demand and long term investment potential. Don’t miss this chance to add a turnkey asset with leasing flexibility to your portfolio.
Key facts
- 5,227 sq ft lot
- 3 garage spots
- Built 1926
Neighborhood map
What this means for you Summary
Snapshot
- This is a 4 × 3-bed/1.0-bath units multifamily listed at $650k.
Deal economics
- At list price, monthly cash flow is $4k ($50k/yr) — positive. Per door: $1k/mo.
- The deal already cash-flows at list — no discount required.
- Meets the 1% rule at list price ($11k rent vs $650k).
- Recommended offer: $592k (9.0% below list) — sets the bar for market timing.
Location & tenants
- Location reads: area grade B — affects rentability + tenant quality, not the cash-flow math above.
- St. Paul Public School District (urban): math 21% / reading 33% proficiency, ranked #270 of 301 in MN (top 90%) — low school quality limits family demand, transient renter base, plan for 1-2y turnover; 64% free/reduced lunch — lower-income household profile, screen leases tightly.
- Zoned schools: Farnsworth Aerospace Lower (math 5% / reading 15%, grade F, #813 of 857 statewide, top 97%, 425 students, 83% FRL) — zoned schools average 83% FRL vs 64% district-wide (19 pts higher); higher-poverty schools than district average — tighter screening recommended.
- Zoned-school proficiency averages 10% at this address vs 27% district-wide (-17 pts) — the specific schools serving this property underperform the St. Paul Public School District average; the district grade overstates school quality for this exact location.
- Market conditions: Rents rising fast (+6.3%/yr); 254 active listings in the ZIP; 1,202 units permitted in Ramsey County in 2024 (880 in 5+ unit buildings).
- At $11,139/mo this rent would consume 190% of the median local household income ($70k/yr) (locally 2046% of renters already pay >50% of income on rent) — very limited rent-growth headroom before tenants either downsize or default.
Forward outlook
- Local home prices are declining (-3.0%/yr); year-one equity from $4k of loan paydown is wiped out by about $20k of value loss. Plan a longer hold.
- Ramsey County population projected at +27% by 2050 — long-run rental-demand tailwind backs the buy-and-hold thesis.
- At projected returns (-3.0% appreciation + 6.3% rent growth), your $182k cash investment doubles in ~4 years — after that, you're playing with house money.
Negotiation context
- It's been on market 93 days — a 9% lower offer ($592k) is reasonable based on typical stale-listing flexibility.
- 11 sale attempts since 22y ago with the ask held roughly flat each time — persistent listings suggest the price (not the market) is what's stuck; bring a comps-based counter.
- Current owner paid $410k; list at $650k implies a 59% gain — meaningful room to come down on a strong offer.
Risks & watch-outs
- Watch-outs: built in 1926 — expect roof / HVAC / electrical / plumbing capex.
Questions for the listing agent
- It's been on market 93 days. Have you received any prior offers? Is the seller open to a 9% concession, seller financing, or rate buy-down credit?
- Can we see the unit-by-unit rent roll, current vacancy, and any below-market leases? What's the average tenancy length?
- What capital expenditures (roof, boiler, parking lot, exteriors) have been made in the last 5 years, and what's planned in the next 2?
- Built in 1926 — when were the roof, HVAC, electrical panel, plumbing, and water heater last replaced?
- Why hasn't it sold? Are there any deal-killer items the seller is aware of (foundation, flood, title, zoning, code violations)?
- Is there a deadline driving the sale (1031 exchange, divorce, estate, relocation)? That informs how much negotiation room exists.
- What's the average days-on-market for RENTAL listings here right now (not sales)? A rising rental-DOM trend means longer vacancies and softer asking-rent achievability than the comps imply.
- What's the recent tenant-quality profile in this submarket — average credit score on applications, eviction rate, late-payment / NSF rate, and stable-employment percentage? A property-management company in the area should have these aggregated.
- How much new apartment / multifamily construction is in the pipeline within 1–3 miles? Heavy new supply (>2% of stock underway) typically softens rents 12–24 months out; light construction supports rent growth.
Investment metrics
- 1% rule
- 1.71% ✓
- Cap rate
- 13.93%
- Cash-on-cash
- 27.27%
- DSCR
- 2.21
- GRM
- 4.9
CMA / ARV
No comps found within radius.
Projected returns pro-forma
-3.0% appreciation · 6.26% rent growth · sell at horizon
- IRR
- 25.0%
- Equity multiple
- 2.08×
- Total profit
- $196,066
- Equity at exit
- $96,917
- IRR
- 34.8%
- Equity multiple
- 4.72×
- Total profit
- $676,562
- Equity at exit
- $56,200
Cash invested: $182,000 (down + closing). Projections, not guarantees.
Landlord ↔ Tenant lean methodology
- Overall (STATE)
- 46 Balanced
- State Minnesota
- 46 Balanced · D+2
- County
- — inherits STATE
- City
- — inherits STATE
ZIP-level market 55106
- Rents YoY
- 6.3%
- Active inventory
- 254
- Price-to-rent
- 19.5×
Monthly cashflow live
- Estimated rent
- $11,139 high interval (Pro) →
- Mortgage (P&I)
- −$3,409
- Tax from tax record
- −$985 /mo · $11,818/yr
- Insurance
- −$271
- HOA
- −$0
- Vacancy / Maint / Mgmt
- −$2,339
- Net cashflow
- $4,135
Break-even live
Sensitivity live
| Price | -10% $4,503 | -5% $4,319 | +0% $4,135 | +5% $3,951 | +10% $3,768 |
|---|---|---|---|---|---|
| Rent | -10% $3,255 | -5% $3,695 | +0% $4,135 | +5% $4,575 | +10% $5,015 |
| Rate | -1.0pp $4,463 | -0.5pp $4,301 | base $4,135 | +0.5pp $3,967 | +1.0pp $3,796 |
4-unit breakdown (identical units grouped — click to expand)
| Units | Beds | Baths | Est. rent |
|---|---|---|---|
| 4× units | 3 | 1 | $11,140 |
| #1 | 3 | 1 | $2,785 |
| #2 | 3 | 1 | $2,785 |
| #3 | 3 | 1 | $2,785 |
| #4 | 3 | 1 | $2,785 |
| Total (4 units) | $11,139 | ||
UW: 25.0% down · 7.5% · 30yr · 1.5% tax · 5.0% vac · 8.0% maint · 8.0% mgmt
Financing live
Cash to close
- Down payment
- $162,500
- Closing costs
- $19,500
- Reserves months
- —
- Total cash needed
- —
Loan-product check · same deal, 3 products live
Conventional
25% down · 7.5% · 30yr
- Down + closing
- —
- Monthly P&I
- —
- Monthly cashflow
- —
- DSCR
- —
- Eligible?
- —
Personal DTI + credit; lowest rate.
DSCR
20% down · 8.5% · 30yr
- Down + closing
- —
- Monthly P&I
- —
- Monthly cashflow
- —
- DSCR
- —
- Eligible?
- —
No personal income docs; deal must DSCR.
Hard money
10% down · 12.0% · 12mo
- Down + closing
- —
- Monthly P&I
- —
- Monthly cashflow
- —
- DSCR
- —
- Eligible?
- —
Short-term bridge; refi at stabilization.
Listing history 46 events
-
2026-06-21days on market $650,000 Active 93 DOM
-
2026-06-18days on market $650,000 Active 90 DOM
-
2026-06-17days on market $650,000 Active 89 DOM
-
2026-06-16days on market $650,000 Active 88 DOM
-
2026-06-15days on market $650,000 Active 87 DOM
-
2026-06-13days on market $650,000 Active 85 DOM
-
2026-06-09days on market $650,000 Active 81 DOM
-
2026-06-08days on market $650,000 Active 80 DOM
-
2026-06-07days on market $650,000 Active 79 DOM
-
2026-06-04days on market $650,000 Active 76 DOM
-
2026-06-03days on market $650,000 Active 75 DOM
-
2026-06-02days on market $650,000 Active 74 DOM
-
2026-06-01days on market $650,000 Active 73 DOM
-
2026-05-31days on market $650,000 Active 72 DOM
-
2026-03-21$650,000 Active 549-char remark
Show marketing remark (549 chars)
Rare opportunity to own a fully vacant 4plex in the heart of Saint Paul, allowing investors to put in their own tenants from day one. All four units have been completely remodeled, with shared common areas featuring brand new paint and carpet throughout. Each unit offers 3 bedrooms, a highly desirable and hard to find layout in multifamily properties, making this an excellent opportunity for strong rental demand and long term investment potential. Don’t miss this chance to add a turnkey asset with leasing flexibility to your portfolio.
-
2026-03-19historical $650,000 549-char remark
Show marketing remark (549 chars)
Rare opportunity to own a fully vacant 4plex in the heart of Saint Paul, allowing investors to put in their own tenants from day one. All four units have been completely remodeled, with shared common areas featuring brand new paint and carpet throughout. Each unit offers 3 bedrooms, a highly desirable and hard to find layout in multifamily properties, making this an excellent opportunity for strong rental demand and long term investment potential. Don’t miss this chance to add a turnkey asset with leasing flexibility to your portfolio.
-
2017-08-02soldstatus $410,000
-
2017-07-05soldstatus $410,000 Sold 211-char remark
Show marketing remark (211 chars)
GREAT 4 UNIT WITH 3 BEDROOMS IN EACH UNIT, HARD TO FIND. CLAW FOOT TUBS & GRANITE. EACH UNIT HAS OWN STORAGE SPACE & COIN-OP LAUNDRY IN BASEMENT. ALL 4 UNITS ARE THE SAME. GREAT INVESTMENT OPPORTUNITY.
-
2017-05-20status Pending 211-char remark
Show marketing remark (211 chars)
GREAT 4 UNIT WITH 3 BEDROOMS IN EACH UNIT, HARD TO FIND. CLAW FOOT TUBS & GRANITE. EACH UNIT HAS OWN STORAGE SPACE & COIN-OP LAUNDRY IN BASEMENT. ALL 4 UNITS ARE THE SAME. GREAT INVESTMENT OPPORTUNITY.
-
2017-05-04historical Contingent - Inspection 211-char remark
Show marketing remark (211 chars)
GREAT 4 UNIT WITH 3 BEDROOMS IN EACH UNIT, HARD TO FIND. CLAW FOOT TUBS & GRANITE. EACH UNIT HAS OWN STORAGE SPACE & COIN-OP LAUNDRY IN BASEMENT. ALL 4 UNITS ARE THE SAME. GREAT INVESTMENT OPPORTUNITY.
-
2017-04-26price $399,900 211-char remark
Show marketing remark (211 chars)
GREAT 4 UNIT WITH 3 BEDROOMS IN EACH UNIT, HARD TO FIND. CLAW FOOT TUBS & GRANITE. EACH UNIT HAS OWN STORAGE SPACE & COIN-OP LAUNDRY IN BASEMENT. ALL 4 UNITS ARE THE SAME. GREAT INVESTMENT OPPORTUNITY.
-
2017-04-25$399,000 Active 211-char remark
Show marketing remark (211 chars)
GREAT 4 UNIT WITH 3 BEDROOMS IN EACH UNIT, HARD TO FIND. CLAW FOOT TUBS & GRANITE. EACH UNIT HAS OWN STORAGE SPACE & COIN-OP LAUNDRY IN BASEMENT. ALL 4 UNITS ARE THE SAME. GREAT INVESTMENT OPPORTUNITY.
-
2014-10-10soldstatus $290,000 Sold
-
2014-10-10soldstatus $290,000
-
2014-10-10soldstatus $290,000
-
2014-10-08status Pending
-
2014-05-07status Active
-
2014-04-09historical
-
2014-03-08$299,900 Active
-
2014-03-07$299,900
-
2014-03-07$299,900
-
2013-06-04soldstatus $170,550
-
2013-06-03historical
-
2013-02-19$159,900
-
2011-10-22historical
-
2011-04-04$120,000
-
2007-04-02soldstatus $343,500
-
2007-02-28historical
-
2007-01-16$364,900
-
2006-02-10historical
-
2005-08-11$389,900
-
2004-12-27soldstatus $375,000
-
2004-12-17soldstatus $375,000
-
2004-11-18historical
-
2004-11-15$389,900
-
1998-12-04soldstatus $101,000
ⓘ Source: listings_history table (triggers on properties + properties_extension) + one-shot
backfill from property_details.listing_events for pre-trigger history.
Tax reassessment forecast MN · Partial reset (capped growth)
- Current annual tax
- $11,818 · $985/mo
- Projected year-2 tax
- $11,818 · $985/mo
- Expected delta
- $0/yr ($0/mo · 0.0%)
ⓘ Screening estimate from a state-policy table — verify with the county assessor before closing.
Climate risk First Street
- Flood 1/10 Low FEMA zone X (unshaded) · 0% chance over 30 yrs
- Wildfire 1/10 Low
- Heat 2/10 Low 7 d/yr ≥99°F today · 14 d/yr by 30 yrs out
- Wind 2/10 Low
- Air quality 2/10 Low 1 unhealthy d/yr today · 1 by 30 yrs out
Nearby sold comps map
Loading sold comps map…
Walkable amenities ~0.75 mi
Loading nearby amenities…
Taxation est. · year 1
- Rental income
- $133,668
- − Mortgage interest
- −$36,410
- − Property taxes
- −$11,818
- − Insurance
- −$3,250
- − Repairs & maintenance
- −$10,693
- − Management
- −$10,693
- − Depreciation
- −$18,909
- Taxable income
- $41,894
- Est. tax owed @ 24.0%
- −$10,055
- After-tax cash flow
- $39,571/yr
For passive investors: Depreciation is non-cash, so a rental often shows a tax loss while cash-flowing — sheltering income. Rental losses are passive: they offset passive income freely, and up to $25,000/yr can offset ordinary (W-2) income if you actively participate and your MAGI is under $100k (phasing out to $0 by $150k); unused losses carry forward. On sale, claimed depreciation is recaptured at up to 25%, and gains may owe capital-gains tax (a 1031 exchange can defer both). Figures are a year-1 estimate at your 24.0% rate — not tax advice; consult a CPA.
Schools (NCES district)
- District
- St. Paul Public School District
- NCES district ID
- 2733840
- Math proficiency
- 21% ▼ -11.00%
- Reading proficiency
- 33% ▼ -7.00%
- Median HH income
- $48,316
- Composite
- 23.51/100
- National rank
- #7868
- State rank
- #270 of 301 in MN
Livability — St. Paul
No livability data for this city. (Only ~50 U.S. cities are tracked.)
Census & demographics
- Census place
- St. Paul, MN
- County
- Ramsey County · 542,837 people
- City population
- 280,599
- Metro
- Minneapolis-St. Paul-Bloomington, MN-WI
- Population (ZIP)
- 56,708
- Household income
- $70,187
- Rent vs Own
- Severe rent burden
- 2046.0
Population outlook (Ramsey County) Hauer SSP2
- Today (2025)
- 603,431 people
- By 2030
- 636,459 · +5.5%
- By 2040
- 700,596 · +16.1%
- By 2050
- 765,819 · +26.9%
- By 2075
- 929,297 · +54.0%
- By 2100
- 1,053,924 · +74.7%
Race, ethnicity, and origin ACS 2023
- Neighborhood character
- Highly diverse neighborhood (Simpson 0.75)
- Race & ethnicity
- Asian 34% White 32% Black 15% Hispanic / Latino 11% Two or more races 10%
- Hispanic origin (detail)
- Mexican 8%
- Common ancestry
- Portuguese 4% Lithuanian 2% Romanian 2%
- Foreign-born
- 25% · Canada, Philippines, Vietnam
- Languages at home
- 59% English-only · Other Asian/Pacific 27% Spanish 9% French/Haitian/Cajun 1%
Political lean MEDSL · Ramsey
- 2024 margin
- Solid D (+43.3) · D 70.5% · R 27.2% · Other 2.3%
- 2008→2024 swing
- +9.4pp toward D · 2008: 33.9pp · 2024: 43.3pp
- All cycles
- 2024: D+43.3 2020: D+45.4 2016: D+39.4 2012: D+35.3 2008: D+33.9
Not yet ingested
- Civics
- —
Market trends
- HPI YoY
- ▼ -239.48%
- Current HPI
- 288.7205
- Rent YoY
- ▲ 6.26%
- Metro
- Minneapolis-St. Paul-Bloomington, MN-WI
- State GDP YoY
- ▲ 2.41%
- F500 in state
- 34
Industry mix (Fortune 500 HQ in MN)
| Industry | F500 HQs | Revenue |
|---|---|---|
| Healthcare | 2 | $407B |
|
||
| Retail | 2 | $150B |
|
||
| Consumer Goods | 2 | $32B |
|
||
| Industrial Machinery | 2 | $6B |
|
||
| Agriculture | 1 | $40B |
|
||
| Healthcare / Medical Devices | 1 | $32B |
|
||
Price history
+543.6% since first listed32 events — show timeline
- 2026-03-21 Listed $650,000 NORTHSTARMLS as Distributed by MLS Grid
- 2026-03-19 Coming Soon $650,000 NORTHSTARMLS as Distributed by MLS Grid
- 2017-08-02 Sold (Public Records) $410,000 Public Records
- 2017-07-05 Sold (MLS) $410,000 NORTHSTARMLS as Distributed by MLS Grid
- 2017-05-20 Pending — NORTHSTARMLS as Distributed by MLS Grid
- 2017-05-04 Contingent — NORTHSTARMLS as Distributed by MLS Grid
- 2017-04-26 Price Changed $399,900 NORTHSTARMLS as Distributed by MLS Grid
- 2017-04-25 Listed $399,000 NORTHSTARMLS as Distributed by MLS Grid
- 2014-10-10 Sold (MLS) $290,000 RASM
- 2014-10-10 Sold (MLS) $290,000 LSAR
- 2014-10-10 Sold (MLS) $290,000 NORTHSTARMLS as Distributed by MLS Grid
- 2014-10-08 Pending — NORTHSTARMLS as Distributed by MLS Grid
- 2014-05-07 Relisted — NORTHSTARMLS as Distributed by MLS Grid
- 2014-04-09 Listing Removed — NORTHSTARMLS as Distributed by MLS Grid
- 2014-03-08 Listed $299,900 NORTHSTARMLS as Distributed by MLS Grid
- 2014-03-07 Listed $299,900 RASM
- 2014-03-07 Listed $299,900 LSAR
- 2013-06-04 Sold (MLS) $170,550 NORTHSTARMLS as Distributed by MLS Grid
- 2013-06-03 Listing Removed — NORTHSTARMLS as Distributed by MLS Grid
- 2013-02-19 Listed $159,900 NORTHSTARMLS as Distributed by MLS Grid
- 2011-10-22 Listing Removed — NORTHSTARMLS as Distributed by MLS Grid
- 2011-04-04 Listed $120,000 NORTHSTARMLS as Distributed by MLS Grid
- 2007-04-02 Sold (MLS) $343,500 NORTHSTARMLS as Distributed by MLS Grid
- 2007-02-28 Listing Removed — NORTHSTARMLS as Distributed by MLS Grid
- 2007-01-16 Listed $364,900 NORTHSTARMLS as Distributed by MLS Grid
- 2006-02-10 Listing Removed — NORTHSTARMLS as Distributed by MLS Grid
- 2005-08-11 Listed $389,900 NORTHSTARMLS as Distributed by MLS Grid
- 2004-12-27 Sold (Public Records) $375,000 Public Records
- 2004-12-17 Sold (MLS) $375,000 NORTHSTARMLS as Distributed by MLS Grid
- 2004-11-18 Listing Removed — NORTHSTARMLS as Distributed by MLS Grid
- 2004-11-15 Listed $389,900 NORTHSTARMLS as Distributed by MLS Grid
- 1998-12-04 Sold (Public Records) $101,000 Public Records
Property tax history
+3.4%/yrLatest (2025): $11,818 · +4.8% YoY. Source: county tax records.
Cash-flow waterfall
monthlySold comps — $/sqft
last 12 mo · ≤1 miLoading sold comps…