 5-Plex
Package Property 3 · Lubbock, TX
Flood risk 1/10 · Minimal
- FEMA flood zone
- X (unshaded)
- Chance of flooding over 30 yrs
- 0.0%
- Est. flood insurance / yr
- $507 – $1,088
Fire risk 1/10 · Minimal
- Est. fire insurance / yr
- $1,222 – $2,270
Heat risk 5/10 · Moderate
- Hot days now (above 100°F)
- 7 days/yr
- Hot days in 30 yrs
- 20 days/yr
Wind risk 2/10 · Minimal
- Chance of severe wind over 30 yrs
- —
Air-quality risk 2/10 · Minimal
- Unhealthy air days now
- 1 days/yr
- Unhealthy air days in 30 yrs
- 1 days/yr
Risk factors via First Street. Map © Google.
Why this score? — see what drove the C grade
The composite is a weighted blend of 9 inputs, each scored 0–100. Each bar is that input's sub-score; the figure is the points it added to the 100-point composite (weight × sub-score).
- Cash flow +24.3/30.0
- DSCR +7.8/10.0
- ARV discount +7.5/15.0
- 1% rule +6.3/10.0
- Livability +4.0/5.0
- Condition / age +3.8/5.0
- Schools +3.1/10.0
- Rent growth +2.5/5.0
- Appreciation +0.0/10.0
$446,000
🖨 Deal sheet (PDF) 📄 Offer letter ✓ Due diligence
Multi-family units
County records classify this as Multi-Family (2-4 Unit). Listing-text estimate: 5 units. estimate disagrees with records
Listing remarks MLS
3 out of 5 of the units are rented, Pro-Forma cap rate is based on 100% occupancy.
Key facts
- 0.82 acre lot
- 2 parking spots
- Built 2012
Neighborhood map
What this means for you Summary
Snapshot
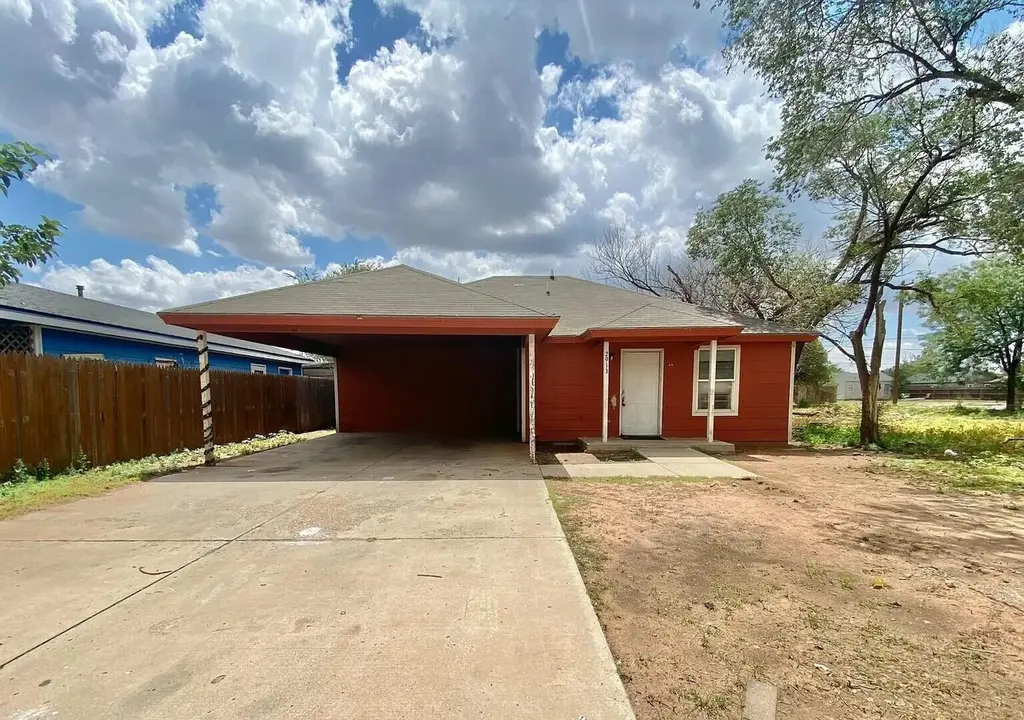
- This is a 5 × 2-bed/1-bath units multifamily listed at $446k. Condition is rated good.
Deal economics
- At list price, monthly cash flow is $896 ($11k/yr) — positive. Per door: $179/mo.
- The deal already cash-flows at list — no discount required.
- Meets the 1% rule at list price ($5k rent vs $446k).
- Recommended offer: $392k (12.0% below list) — sets the bar for market timing.
Location & tenants
- Location reads 80/100 on livability (#37 in TX, #1,749 nationally) — a professional / high-income tenant draw. Strengths: commute A+, cost of living A+, housing A+; Watch: employment C-, schools D+, crime F.
- Lubbock ISD (urban): math 36% / reading 39% proficiency, ranked #481 of 826 in TX (top 58%) — families likely to look elsewhere, expect single-tenant / working-renter base with shorter leases; 60% free/reduced lunch — lower-income household profile, screen leases tightly.
- Market conditions: 110 active listings in the ZIP; lower-income renter base — watch delinquency; 2,219 units permitted in Lubbock County in 2024 (252 in 5+ unit buildings).
- At $5,036/mo this rent would consume 166% of the median local household income ($36k/yr) (locally 1287% of renters already pay >50% of income on rent) — very limited rent-growth headroom before tenants either downsize or default.
Forward outlook
- Local home prices are declining (-3.0%/yr); year-one equity from $3k of loan paydown is wiped out by about $13k of value loss. Plan a longer hold.
- Lubbock County population projected at +39% by 2050 — long-run rental-demand tailwind backs the buy-and-hold thesis.
Negotiation context
- It's been on market 468 days — a 12% lower offer ($392k) is reasonable based on typical stale-listing flexibility.
- 2 sale attempts with the ask held roughly flat each time — persistent listings suggest the price (not the market) is what's stuck; bring a comps-based counter.
Risks & watch-outs
- Climate carrying-cost: extreme-heat days projected 7→20/yr by 2055 (HVAC capex compounding) — expect insurance premiums to compound above CPI over the hold.
Questions for the listing agent
- It's been on market 468 days. Have you received any prior offers? Is the seller open to a 12% concession, seller financing, or rate buy-down credit?
- Can we see the unit-by-unit rent roll, current vacancy, and any below-market leases? What's the average tenancy length?
- What capital expenditures (roof, boiler, parking lot, exteriors) have been made in the last 5 years, and what's planned in the next 2?
- Why hasn't it sold? Are there any deal-killer items the seller is aware of (foundation, flood, title, zoning, code violations)?
- Is there a deadline driving the sale (1031 exchange, divorce, estate, relocation)? That informs how much negotiation room exists.
- Schools are D-rated, which usually means shorter tenancies and higher turnover. Who's the typical renter profile here, and what's been the actual vacancy rate?
- Crime grade is F in this area — have there been break-ins, vandalism, or insurance claims at this property in the last 3 years? What carrier currently insures it and at what premium?
- What's the average days-on-market for RENTAL listings here right now (not sales)? A rising rental-DOM trend means longer vacancies and softer asking-rent achievability than the comps imply.
- What's the recent tenant-quality profile in this submarket — average credit score on applications, eviction rate, late-payment / NSF rate, and stable-employment percentage? A property-management company in the area should have these aggregated.
- How much new apartment / multifamily construction is in the pipeline within 1–3 miles? Heavy new supply (>2% of stock underway) typically softens rents 12–24 months out; light construction supports rent growth.
Investment metrics
- 1% rule
- 1.13% ✓
- Cap rate
- 8.70%
- Cash-on-cash
- 8.61%
- DSCR
- 1.38
- GRM
- 7.4
CMA / ARV
No comps found within radius.
Projected returns pro-forma
-3.0% appreciation · 3.0% rent growth · sell at horizon
- IRR
- -3.2%
- Equity multiple
- 0.88×
- Total profit
- $-15,114
- Equity at exit
- $66,500
- IRR
- 6.5%
- Equity multiple
- 1.49×
- Total profit
- $60,650
- Equity at exit
- $38,562
Cash invested: $124,880 (down + closing). Projections, not guarantees.
Landlord ↔ Tenant lean methodology
- Overall (STATE)
- 87 Strongly Landlord-Friendly
- State Texas
- 87 Strongly Landlord-Friendly · R+5
- County
- — inherits STATE
- City
- — inherits STATE
ZIP-level market 79415
- Home prices YoY
- -20.1%
- Active inventory
- 110
- Price-to-rent
- 36.9×
Monthly cashflow live
- Estimated rent
- $5,036 high interval (Pro) →
- Mortgage (P&I)
- −$2,339
- Tax est. 1.5%
- −$558 /mo · $6,690/yr
- Insurance
- −$186
- HOA
- −$0
- Vacancy / Maint / Mgmt
- −$1,058
- Net cashflow
- $896
Break-even live
Sensitivity live
| Price | -10% $1,204 | -5% $1,050 | +0% $896 | +5% $742 | +10% $588 |
|---|---|---|---|---|---|
| Rent | -10% $498 | -5% $697 | +0% $896 | +5% $1,095 | +10% $1,294 |
| Rate | -1.0pp $1,121 | -0.5pp $1,010 | base $896 | +0.5pp $781 | +1.0pp $663 |
5-unit breakdown (identical units grouped — click to expand)
| Units | Beds | Baths | Est. rent |
|---|---|---|---|
| 5× units | 2 | 1 | $5,035 |
| #1 | 2 | 1 | $1,007 |
| #2 | 2 | 1 | $1,007 |
| #3 | 2 | 1 | $1,007 |
| #4 | 2 | 1 | $1,007 |
| #5 | 2 | 1 | $1,007 |
| Total (5 units) | $5,036 | ||
UW: 25.0% down · 7.5% · 30yr · 1.5% tax · 5.0% vac · 8.0% maint · 8.0% mgmt
Financing live
Cash to close
- Down payment
- $111,500
- Closing costs
- $13,380
- Reserves months
- —
- Total cash needed
- —
Loan-product check · same deal, 3 products live
Conventional
25% down · 7.5% · 30yr
- Down + closing
- —
- Monthly P&I
- —
- Monthly cashflow
- —
- DSCR
- —
- Eligible?
- —
Personal DTI + credit; lowest rate.
DSCR
20% down · 8.5% · 30yr
- Down + closing
- —
- Monthly P&I
- —
- Monthly cashflow
- —
- DSCR
- —
- Eligible?
- —
No personal income docs; deal must DSCR.
Hard money
10% down · 12.0% · 12mo
- Down + closing
- —
- Monthly P&I
- —
- Monthly cashflow
- —
- DSCR
- —
- Eligible?
- —
Short-term bridge; refi at stabilization.
Listing history 20 events
-
2026-06-18days on market $446,000 Active 468 DOM
-
2026-06-17days on market $446,000 Active 467 DOM
-
2026-06-16days on market $446,000 Active 466 DOM
-
2026-06-15days on market $446,000 Active 465 DOM
-
2026-06-14days on market $446,000 Active 463 DOM
-
2026-06-13days on market $446,000 Active 462 DOM
-
2026-06-10days on market $446,000 Active 460 DOM
-
2026-06-09days on market $446,000 Active 459 DOM
-
2026-06-08days on market $446,000 Active 458 DOM
-
2026-06-07days on market $446,000 Active 457 DOM
-
2026-06-05days on market $446,000 Active 454 DOM
-
2026-06-03days on market $446,000 Active 453 DOM
-
2026-06-02days on market $446,000 Active 452 DOM
-
2026-06-01days on market $446,000 Active 451 DOM
-
2026-05-31days on market $446,000 Active 450 DOM
-
2026-05-30days on market $446,000 Active 449 DOM
-
2026-01-19price $446,000 82-char remark
Show marketing remark (82 chars)
3 out of 5 of the units are rented, Pro-Forma cap rate is based on 100% occupancy.
-
2025-09-12status Active 82-char remark
Show marketing remark (82 chars)
3 out of 5 of the units are rented, Pro-Forma cap rate is based on 100% occupancy.
-
2025-09-01historical 82-char remark
Show marketing remark (82 chars)
3 out of 5 of the units are rented, Pro-Forma cap rate is based on 100% occupancy.
-
2025-02-24$442,000 Active 82-char remark
Show marketing remark (82 chars)
3 out of 5 of the units are rented, Pro-Forma cap rate is based on 100% occupancy.
ⓘ Source: listings_history table (triggers on properties + properties_extension) + one-shot
backfill from property_details.listing_events for pre-trigger history.
Climate risk First Street
- Flood 1/10 Low FEMA zone X (unshaded) · 0% chance over 30 yrs
- Wildfire 1/10 Low
- Heat 5/10 Major 7 d/yr ≥100°F today · 20 d/yr by 30 yrs out
- Wind 2/10 Low
- Air quality 2/10 Low 1 unhealthy d/yr today · 1 by 30 yrs out
Nearby sold comps map
Loading sold comps map…
Walkable amenities ~0.75 mi
Loading nearby amenities…
Taxation est. · year 1
- Rental income
- $60,432
- − Mortgage interest
- −$24,983
- − Property taxes
- −$6,690
- − Insurance
- −$2,230
- − Repairs & maintenance
- −$4,835
- − Management
- −$4,835
- − Depreciation
- −$12,975
- Taxable income
- $3,885
- Est. tax owed @ 24.0%
- −$932
- After-tax cash flow
- $9,822/yr
For passive investors: Depreciation is non-cash, so a rental often shows a tax loss while cash-flowing — sheltering income. Rental losses are passive: they offset passive income freely, and up to $25,000/yr can offset ordinary (W-2) income if you actively participate and your MAGI is under $100k (phasing out to $0 by $150k); unused losses carry forward. On sale, claimed depreciation is recaptured at up to 25%, and gains may owe capital-gains tax (a 1031 exchange can defer both). Figures are a year-1 estimate at your 24.0% rate — not tax advice; consult a CPA.
Condition & rehab AI · 12 photos
This multi-family property is in good condition with cosmetic updates needed. New appliances and a fresh bathtub would significantly boost its resale and rental value.
Repairs flagged
- Major Appliances — Old and worn
- Major Bathtubs — Signs of wear
Value-add opportunities
- Resale New appliances — Modern appliances attract buyers
- Resale Bathtub replacement — Fresh bathtubs improve appeal
- Both Landscaping upgrade — Enhances curb appeal and rental value
Renovation cost estimate screening
| Repair item | Severity | Est. cost |
|---|---|---|
| Appliances · Old and worn | Major | $15,000–50,000 |
| Bathtubs · Signs of wear | Major | $15,000–50,000 |
| Total estimated repair cost · 2 items | $30,000–100,000 |
Value-add ROI direction
- Resale New appliances — Modern appliances attract buyers ↑
- Resale Bathtub replacement — Fresh bathtubs improve appeal ↑
- Both Landscaping upgrade — Enhances curb appeal and rental value ↑
ⓘ Cost ranges are severity-bucket heuristics (US national rule-of-thumb). Get contractor quotes + a written scope before underwriting a rehab budget.
Schools (NCES district)
- District
- Lubbock ISD
- NCES district ID
- 4828500
- Math proficiency
- 36% ▼ -8.00%
- Reading proficiency
- 39% ▼ -1.00%
- Median HH income
- $39,820
- Composite
- 31.44/100
- National rank
- #5984
- State rank
- #481 of 826 in TX
Livability — Lubbock
- Score
- 80/100
- State rank
- #37
- US rank
- #1749
Category grades
Schools grade is shown separately in the Schools card above.
Census & demographics
- Census place
- Lubbock, TX
- County
- Lubbock County · 293,542 people
- City population
- 283,030
- Metro
- Lubbock, TX
- Population (ZIP)
- 15,794
- Household income
- $36,468
- Rent vs Own
- Severe rent burden
- 1287.0
Population outlook (Lubbock County) Hauer SSP2
- Today (2025)
- 345,960 people
- By 2030
- 371,449 · +7.4%
- By 2040
- 424,539 · +22.7%
- By 2050
- 481,150 · +39.1%
- By 2075
- 633,467 · +83.1%
- By 2100
- 746,853 · +115.9%
Race, ethnicity, and origin ACS 2023
- Neighborhood character
- Diverse neighborhood (Simpson 0.58)
- Race & ethnicity
- Hispanic / Latino 59% White 26% Two or more races 19% Black 7% Asian 5%
- Hispanic origin (detail)
- Mexican 49%
- Common ancestry
- Italian 1% Serbian 1% Estonian 1%
- Foreign-born
- 15% · Canada, China
- Languages at home
- 57% English-only · Spanish 36% Other Indo-European 4% Arabic 1%
Political lean MEDSL · Lubbock
- 2024 margin
- Solid R (+39.5) · D 29.7% · R 69.2% · Other 1.0%
- 2008→2024 swing
- -2.8pp toward R · 2008: -36.7pp · 2024: -39.5pp
- All cycles
- 2024: R+39.5 2020: R+32.2 2016: R+38.4 2012: R+40.9 2008: R+36.7
Not yet ingested
- Civics
- —
Market trends
- HPI YoY
- ▼ -41.79%
- Current HPI
- 165.7933
- Rent YoY
- —
- Metro
- Lubbock, TX
- State GDP YoY
- ▲ 3.95%
- F500 in state
- 110
Industry mix (Fortune 500 HQ in TX)
| Industry | F500 HQs | Revenue |
|---|---|---|
| Energy | 16 | $1,198B |
|
||
| Technology | 5 | $198B |
|
||
| Engineering / Construction | 4 | $72B |
|
||
| Energy Services | 3 | $60B |
|
||
| Utilities | 3 | $41B |
|
||
| Healthcare | 2 | $330B |
|
||
Price history
+0.9% since first listed4 events — show timeline
- 2026-01-19 Price Changed $446,000 LARMLS
- 2025-09-12 Relisted — LARMLS
- 2025-09-01 Delisted — LARMLS
- 2025-02-24 Listed $442,000 LARMLS
Cash-flow waterfall
monthlySold comps — $/sqft
last 12 mo · ≤1 miLoading sold comps…