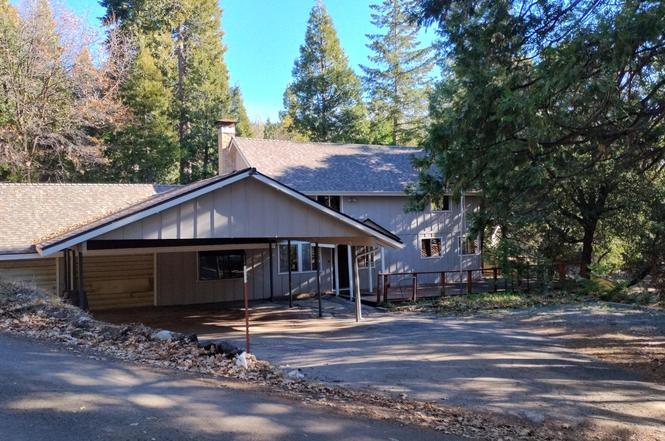
594 Loop Dr · Camp Nelson, CA
Flood risk 4/10 · Minor
- FEMA flood zone
- X (unshaded)
- Chance of flooding over 30 yrs
- 0.2%
- Est. flood insurance / yr
- $507 – $1,088
Fire risk 5/10 · Moderate
- Est. fire insurance / yr
- $659 – $1,223
Heat risk 2/10 · Minimal
- Hot days now (above 82°F)
- 11 days/yr
- Hot days in 30 yrs
- 30 days/yr
Wind risk 1/10 · Minimal
- Chance of severe wind over 30 yrs
- —
Air-quality risk 10/10 · Severe
- Unhealthy air days now
- 51 days/yr
- Unhealthy air days in 30 yrs
- 54 days/yr
Risk factors via First Street. Map © Google.
Why this score? — see what drove the D- grade
The composite is a weighted blend of 9 inputs, each scored 0–100. Each bar is that input's sub-score; the figure is the points it added to the 100-point composite (weight × sub-score).
- Appreciation +10.0/10.0
- Cash flow +8.6/30.0
- ARV discount +5.5/15.0
- Schools +4.4/10.0
- Rent growth +2.5/5.0
- Condition / age +2.5/5.0
- DSCR +2.4/10.0
- 1% rule +1.6/10.0
- Livability +1.2/5.0
$314,000
🖨 Deal sheet 📄 Offer letter ✓ Due diligence
Listing remarks
Looking for a mountain home that feels like a cabin but has some updates? This lovely cabin, located on the desirable Loop Dr in Camp Nelson, was built in 1940 but has been updated to keep its character and charm while adding the comforts you appreciate in the mountains. You enter into the large living room with an adjacent dining room/office/bedroom area separated from the living area by glass French doors. On the other side is a wet bar followed by a huge kitchen with recent stainless steel appliances (including double ovens), lots of storage, and an adjacent laundry room and a half bath. Upstairs are three bedrooms and a full bath. Step outside to a recent deck on two sides and plenty of
Key facts
- Lots of storage
- Updated cabin
- Wet bar
Tags
Property features AI
Exterior
- Parking: 2-car garage; Carport; Garage faces front; Guest parking
- Security: Carbon monoxide detector(s); Smoke detector(s)
- Utilities: Private water source; Septic tank; Electricity connected; Water connected; Sewer connected
- Home design: Single-family residence; Two stories; No shared/common walls
- Construction: Wood siding; Composition roof; Built as a residential single-family home
- Exterior features: Covered side porch; Deck; Paved road access; Has a view
Interior
- Kitchen: Double oven; Electric oven; Electric range; Range hood; Dishwasher; Microwave; Refrigerator
- Bedrooms: One main-level bedroom
- Flooring: Laminate; Slate; Wood
- Bathrooms: One full bathroom; One half bathroom; One main-level bathroom
- Heating & cooling: Central heating; Wood heating; Fireplace heating; Ceiling fan cooling
- Interior features: Ceiling fans; Pantry; Wet bar; Living room fireplace
- Laundry & utility: Washer hookup; Washer and dryer included (washer, dryer); Laundry room; Electric dryer hookup; Gas dryer hookup
Neighborhood map
What this means for you Summary
Snapshot
- This is a 4-bed/2.0-bath single-family listed at $314k.
Deal economics
- At list price, monthly cash flow is $-268 ($-3k/yr) — negative.
- To cash-flow at today's rent, offer at most $267k (15.1% below list).
- To meet the 1% rule (rent ≥ 1% of price), the offer needs to be $207k (34.2% below list).
- Recommended offer: $207k (34.2% below list) — sets the bar for 1% rule.
Location & tenants
- Location reads 25/100 on livability (#1,489 in CA) — a limited-amenity area; tenant pool skews transient or value-seeking. Strengths: crime A, health & safety A; Watch: amenities F, commute F, employment F.
- Springville Union Elementary (rural): math 44% / reading 52% proficiency, ranked #476 of 1,400 in CA (top 34%) — families likely to look elsewhere, expect single-tenant / working-renter base with shorter leases.
- Market conditions: 123 active listings in the ZIP; 1,447 units permitted in Tulare County in 2024 (307 in 5+ unit buildings).
Forward outlook
- In year one you build about $34k of equity ($2k loan paydown + $31k appreciation (10.0% local appreciation)).
- Tulare County population projected at +10% by 2050 — modest demand growth; plan on rents tracking national, not racing it.
- By year 2, paydown + projected appreciation supports a ~$54k cash-out refi (75% LTV) — recoverable capital for the next deal without selling this one.
Negotiation context
- It's been on market 183 days — a 12% lower offer ($276k) is reasonable based on typical stale-listing flexibility.
- Current owner paid $90k; list at $314k implies a 249% gain — meaningful room to come down on a strong offer.
Risks & watch-outs
- Watch-outs: built in 1940 — expect roof / HVAC / electrical / plumbing capex.
- Climate carrying-cost: moderate wildfire risk — expect insurance premiums to compound above CPI over the hold.
Questions for the listing agent
- What do current leases actually rent for vs. the listed asking? Can we see a recent rent roll and the last 12 months of T-12 income?
- It's been on market 183 days. Have you received any prior offers? Is the seller open to a 34% concession, seller financing, or rate buy-down credit?
- Built in 1940 — when were the roof, HVAC, electrical panel, plumbing, and water heater last replaced?
- Why hasn't it sold? Are there any deal-killer items the seller is aware of (foundation, flood, title, zoning, code violations)?
- Is there a deadline driving the sale (1031 exchange, divorce, estate, relocation)? That informs how much negotiation room exists.
- The area grade is low — what's the realistic commute time and amenity access for the typical tenant pool here? Any planned neighborhood developments (good or bad) we should know about?
- What's the average days-on-market for RENTAL listings here right now (not sales)? A rising rental-DOM trend means longer vacancies and softer asking-rent achievability than the comps imply.
- What's the recent tenant-quality profile in this submarket — average credit score on applications, eviction rate, late-payment / NSF rate, and stable-employment percentage? A property-management company in the area should have these aggregated.
- How much new for-sale + rental construction is in the pipeline within 1–3 miles? Heavy new supply typically softens prices + rents 12–24 months out; constrained supply supports both.
Investment metrics
- 1% rule
- 0.66% ✗
- Cap rate
- 5.27%
- Cash-on-cash
- -3.66%
- DSCR
- 0.84
- GRM
- 12.7
CMA / ARV
- ARV (on-the-fly)
- $300,672
- Comps found
- 6
Show comp detail 6 sales within ~0.75 mi
| Address | Dist | Beds/Ba | Sqft | Sold | Price | $/sf | Match |
|---|---|---|---|---|---|---|---|
| 1309 Wy Ct | 0.63mi | 3/2.0 (-1) | 1,748 (+1%) | 6mo | $305,000 | $174 | 59 |
| 1549 Coy Flat Dr | 0.68mi | 3/2.0 (-1) | 1,800 (+4%) | 7mo | $300,000 | $167 | 50 |
| 1284 Bourbon Dr | 0.70mi | 3/2.0 (-1) | 1,800 (+4%) | 9mo | $290,000 | $161 | 48 |
| 491 Clover Dr | 0.47mi | 3/2.0 (-1) | 1,577 (-9%) | 16mo | $200,000 | $127 | 45 |
| 1305 Wy Ct | 0.63mi | 3/2.0 (-1) | 1,768 (+2%) | 20mo | $315,000 | $178 | 45 |
| 1056 Highway 190 | 0.61mi | 3/2.5 (-1) | 1,800 (+4%) | 17mo | $325,000 | $181 | 43 |
Match score weights: distance 35% · size 25% · config 20% · recency 20%. Top-matched comps best support the ARV.
Projected returns pro-forma
10.0% appreciation · 3.0% rent growth · sell at horizon
- IRR
- 21.7%
- Equity multiple
- 2.75×
- Total profit
- $153,801
- Equity at exit
- $282,876
- IRR
- 19.5%
- Equity multiple
- 6.30×
- Total profit
- $466,080
- Equity at exit
- $610,033
Cash invested: $87,920 (down + closing). Projections, not guarantees.
Landlord ↔ Tenant lean methodology
- Overall (STATE)
- 18 Strongly Tenant-Friendly
- State California
- 18 Strongly Tenant-Friendly · D+13
- County
- — inherits STATE
- City
- — inherits STATE
ZIP-level market 93265
- Home prices YoY
- 9.1%
- Active inventory
- 123
- Price-to-rent
- 12.7×
Monthly cashflow live
- Estimated rent
- $2,066 medium interval (Pro) →
- Mortgage (P&I)
- −$1,647
- Tax from tax record
- −$123 /mo · $1,474/yr
- Insurance
- −$131
- HOA
- −$0
- Vacancy / Maint / Mgmt
- −$434
- Net cashflow
- $-268
Break-even live
UW: 25.0% down · 7.5% · 30yr · 1.5% tax · 5.0% vac · 8.0% maint · 8.0% mgmt
Financing live
Cash to close
- Down payment
- $78,500
- Closing costs
- $9,420
- Reserves months
- —
- Total cash needed
- —
Loan-product check · same deal, 3 products live
Conventional
25% down · 7.5% · 30yr
- Down + closing
- —
- Monthly P&I
- —
- Monthly cashflow
- —
- DSCR
- —
- Eligible?
- —
Personal DTI + credit; lowest rate.
DSCR
20% down · 8.5% · 30yr
- Down + closing
- —
- Monthly P&I
- —
- Monthly cashflow
- —
- DSCR
- —
- Eligible?
- —
No personal income docs; deal must DSCR.
Hard money
10% down · 12.0% · 12mo
- Down + closing
- —
- Monthly P&I
- —
- Monthly cashflow
- —
- DSCR
- —
- Eligible?
- —
Short-term bridge; refi at stabilization.
Listing history 18 events
-
2026-06-18days on market $314,000 Active 183 DOM
-
2026-06-17days on market $314,000 Active 182 DOM
-
2026-06-16days on market $314,000 Active 181 DOM
-
2026-06-15days on market $314,000 Active 180 DOM
-
2026-06-14days on market $314,000 Active 178 DOM
-
2026-06-13days on market $314,000 Active 177 DOM
-
2026-06-10pricedays on market $314,000 Active 175 DOM
-
2026-06-09days on market $329,000 Active 174 DOM
-
2026-06-08days on market $329,000 Active 173 DOM
-
2026-06-07days on market $329,000 Active 172 DOM
-
2026-06-05days on market $329,000 Active 169 DOM
-
2026-06-03days on market $329,000 Active 168 DOM
-
2026-06-02days on market $329,000 Active 167 DOM
-
2026-06-01days on market $329,000 Active 166 DOM
-
2026-05-31days on market $329,000 Active 165 DOM
-
2026-05-30days on market $329,000 Active 164 DOM
-
2025-12-17$329,000 Active
-
1999-11-24soldstatus $90,000
ⓘ Source: listings_history table (triggers on properties + properties_extension) + one-shot
backfill from property_details.listing_events for pre-trigger history.
Tax reassessment forecast CA · Resets to sale price
- Current annual tax
- $1,474 · $123/mo
- Projected year-2 tax
- $2,386 · $199/mo
- Expected delta
- +$912/yr (+$76/mo · 61.9%)
ⓘ Screening estimate from a state-policy table — verify with the county assessor before closing.
Climate risk First Street
- Flood 4/10 Moderate FEMA zone X (unshaded) · 20% chance over 30 yrs
- Wildfire 5/10 Major
- Heat 2/10 Low 11 d/yr ≥82°F today · 30 d/yr by 30 yrs out
- Wind 1/10 Low
- Air quality 10/10 Extreme 51 unhealthy d/yr today · 54 by 30 yrs out
Nearby sold comps map
Loading sold comps map…
Walkable amenities ~0.75 mi
Loading nearby amenities…
Taxation est. · year 1
- Rental income
- $24,793
- − Mortgage interest
- −$17,589
- − Property taxes
- −$1,474
- − Insurance
- −$1,570
- − Repairs & maintenance
- −$1,983
- − Management
- −$1,983
- − Depreciation
- −$9,135
- Taxable loss
- −$8,942
- Est. tax savings @ 24.0%
- +$2,146
- After-tax cash flow
- $-1,072/yr
For passive investors: Depreciation is non-cash, so a rental often shows a tax loss while cash-flowing — sheltering income. Rental losses are passive: they offset passive income freely, and up to $25,000/yr can offset ordinary (W-2) income if you actively participate and your MAGI is under $100k (phasing out to $0 by $150k); unused losses carry forward. On sale, claimed depreciation is recaptured at up to 25%, and gains may owe capital-gains tax (a 1031 exchange can defer both). Figures are a year-1 estimate at your 24.0% rate — not tax advice; consult a CPA.
Schools (NCES district)
- District
- Springville Union Elementary
- NCES district ID
- 0637770
- Math proficiency
- 44% ▲ 4.00%
- Reading proficiency
- 52% ▲ 1.00%
- Median HH income
- $53,881
- Composite
- 43.58/100
- National rank
- #6431
- State rank
- #476 of 1400 in CA
Livability — Camp Nelson
- Score
- 25/100
- State rank
- #1489
- US rank
- #27998
Category grades
Schools grade is shown separately in the Schools card above.
Census & demographics
- Census place
- Camp Nelson, CA
- Population (ZIP)
- 3,532
Population outlook (Tulare County) Hauer SSP2
- Today (2025)
- 484,681 people
- By 2030
- 496,241 · +2.4%
- By 2040
- 518,507 · +7.0%
- By 2050
- 534,920 · +10.4%
- By 2075
- 548,417 · +13.2%
- By 2100
- 513,085 · +5.9%
Race, ethnicity, and origin ACS 2023
- Neighborhood character
- Majority White (64%)
- Race & ethnicity
- White 64% Hispanic / Latino 22% Two or more races 19% Asian 6% Pacific Islander 1%
- Hispanic origin (detail)
- Mexican 21%
- Common ancestry
- Slovak 2% Iranian 2% Scottish 1%
- Foreign-born
- 4% · Canada, Guatemala, South Korea
- Languages at home
- 92% English-only · Spanish 4% Tagalog/Filipino 3% Other Asian/Pacific 1%
Political lean MEDSL · Tulare
- 2024 margin
- Strong R (+20.7) · D 38.5% · R 59.2% · Other 2.3%
- 2008→2024 swing
- -5.4pp toward R · 2008: -15.3pp · 2024: -20.7pp
- All cycles
- 2024: R+20.7 2020: R+7.8 2016: R+12.1 2012: R+17.8 2008: R+15.3
Not yet ingested
- Civics
- —
Market trends
- HPI YoY
- ▲ 30.24%
- Current HPI
- 361.9818
- Rent YoY
- —
- Metro
- —
- State GDP YoY
- ▲ 3.21%
- F500 in state
- 116
Industry mix (Fortune 500 HQ in CA)
| Industry | F500 HQs | Revenue |
|---|---|---|
| Technology | 27 | $1,492B |
|
||
| Financial Services | 3 | $174B |
|
||
| Retail | 3 | $44B |
|
||
| Insurance | 3 | $26B |
|
||
| Media / Entertainment | 2 | $115B |
|
||
| Pharmaceuticals / Biotech | 2 | $62B |
|
||
Price history
+265.6% since first listed2 events — show timeline
- 2025-12-17 Listed $329,000 TCMLS
- 1999-11-24 Sold (Public Records) $90,000 Public Records
Property tax history
+2.1%/yrLatest (2025): $1,474 · +3.5% YoY. Source: county tax records.
Cash-flow waterfall
monthlySold comps — $/sqft
last 12 mo · ≤1 miLoading sold comps…