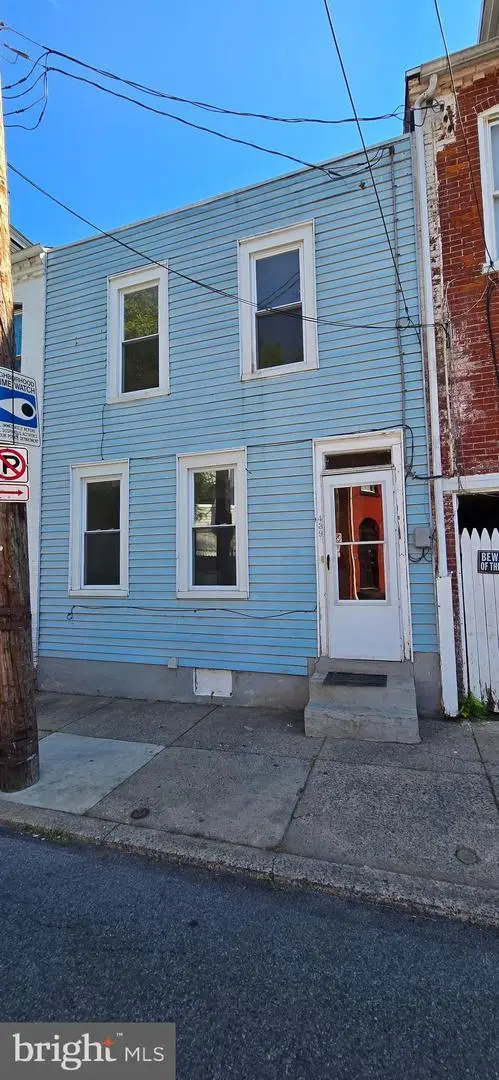
439 E Strawberry St · Lancaster, PA
Flood risk 1/10 · Minimal
- FEMA flood zone
- X (unshaded)
- Chance of flooding over 30 yrs
- 0.0%
- Est. flood insurance / yr
- $473 – $860
Fire risk 1/10 · Minimal
- Est. fire insurance / yr
- $511 – $949
Heat risk 6/10 · Moderate
- Hot days now (above 101°F)
- 7 days/yr
- Hot days in 30 yrs
- 15 days/yr
Wind risk 4/10 · Minor
- Chance of severe wind over 30 yrs
- 15.0%
Air-quality risk 4/10 · Minor
- Unhealthy air days now
- 4 days/yr
- Unhealthy air days in 30 yrs
- 7 days/yr
Risk factors via First Street. Map © Google.
Why this score? — see what drove the C- grade
The composite is a weighted blend of 9 inputs, each scored 0–100. Each bar is that input's sub-score; the figure is the points it added to the 100-point composite (weight × sub-score).
- Cash flow +21.0/30.0
- ARV discount +11.0/15.0
- DSCR +6.7/10.0
- 1% rule +4.7/10.0
- Livability +4.2/5.0
- Rent growth +2.8/5.0
- Condition / age +2.5/5.0
- Schools +1.6/10.0
- Appreciation +0.0/10.0
$130,000
🖨 Deal sheet 📄 Offer letter ✓ Due diligence
Listing remarks MLS
COZY 2 STORY HOME. SAME OWNERS FOR THE LAST 19 YEARS! GREAT FOR INVESTORS, EXCELLENT CASH FLOW!! RARE FIND BECAUSE IT PAYS FOR ITSELF WITHIN 5 YEARS. NEW ASSESSMENT ONLY $21,900 = LOWER TAXES!! MODERN KITCHEN & BATH, VINYL SIDING. TURNKEY-READY TO RENT FOR $600/MONTH MINIMUM W/ TENANTS PAYING SEWER/WATER AND TRASH. HOME IS BEING SOLD ''AS-IS'', NO SELLER PAID REPAIRS AT THIS PRICE, OWNERS ARE PA LICENSED RE BROKERS.
Key facts
- Built 1900
- Listed 17 days
Property features AI
Finance
- Other: Above-grade finished area reported as 616 (assessor)
Exterior
- Parking: On-street parking
- Utilities: Public water; Public sewer; Electric service
- Home design: Interior townhouse/rowhouse; Fee simple ownership
- Construction: Frame construction with vinyl siding; Stone foundation; Shingle, composite, and rubber roof
- Exterior features: Board fencing; Not in a federal flood zone
Interior
- Kitchen: Eat-in kitchen
- Bedrooms: One bedroom on the first upper level
- Bathrooms: One full bathroom on the main level; One full bathroom total
- Heating & cooling: Electric baseboard heating; Electric cooling; Electric hot water
- Interior features: Eat-in kitchen; Partial basement; Two or more access exits
Neighborhood map
What this means for you Summary
Snapshot
- This is a 1-bed/1.0-bath townhouse listed at $130k.
Deal economics
- At list price, monthly cash flow is $183 ($2k/yr) — positive.
- The deal already cash-flows at list — no discount required.
- To meet the 1% rule (rent ≥ 1% of price), the offer needs to be $126k (3.1% below list).
- Recommended offer: $126k (3.1% below list) — sets the bar for 1% rule.
- Cap rate 8.0% vs local median 4.2% in Lancaster — top-decile yield for the area; either an underpriced asset or a hidden risk that comps aren't pricing in. Stress-test before assuming the spread holds.
Location & tenants
- Location reads 85/100 on livability (#71 in PA, #498 nationally) — a professional / high-income tenant draw. Strengths: amenities A+, commute A+, cost of living A+; Watch: crime C-, employment C-.
- Lancaster SD (urban): math 12% / reading 25% proficiency, ranked #500 of 539 in PA (top 93%) — low school quality limits family demand, transient renter base, plan for 1-2y turnover; 72% free/reduced lunch — lower-income household profile, screen leases tightly.
- Market conditions: Rents rising (+1.2%/yr); 161 active listings in the ZIP; 34 comparable units currently listed for rent nearby; rentals at typical pace (median 24d on market — plan ~3-4 weeks tenant-placement turnaround); solid renter incomes; 1,093 units permitted in Lancaster County in 2024 (201 in 5+ unit buildings).
Forward outlook
- Local home prices are declining (-3.0%/yr); year-one equity from $899 of loan paydown is wiped out by about $4k of value loss. Plan a longer hold.
- Lancaster County population projected at +5% by 2050 — modest demand growth; plan on rents tracking national, not racing it.
Negotiation context
- It's been on market 17 days — a 2% lower offer ($128k) is reasonable based on typical stale-listing flexibility.
- 2 sale attempts since 9y ago; this cycle's ask is 335% above the opening price — seller raised mid-cycle; expect resistance to lowballs.
- Current owner paid $28k; list at $130k implies a 373% gain — meaningful room to come down on a strong offer.
Risks & watch-outs
- Watch-outs: built in 1900 — expect roof / HVAC / electrical / plumbing capex.
- Climate carrying-cost: extreme-heat days projected 7→15/yr by 2055 (HVAC capex compounding) — expect insurance premiums to compound above CPI over the hold.
Questions for the listing agent
- Built in 1900 — when were the roof, HVAC, electrical panel, plumbing, and water heater last replaced?
- Is there a deadline driving the sale (1031 exchange, divorce, estate, relocation)? That informs how much negotiation room exists.
- What's the average days-on-market for RENTAL listings here right now (not sales)? A rising rental-DOM trend means longer vacancies and softer asking-rent achievability than the comps imply.
- What's the recent tenant-quality profile in this submarket — average credit score on applications, eviction rate, late-payment / NSF rate, and stable-employment percentage? A property-management company in the area should have these aggregated.
- How much new for-sale + rental construction is in the pipeline within 1–3 miles? Heavy new supply typically softens prices + rents 12–24 months out; constrained supply supports both.
Investment metrics
- 1% rule
- 0.97% ✗
- Cap rate
- 7.99%
- Cash-on-cash
- 6.04%
- DSCR
- 1.27
- GRM
- 8.6
CMA / ARV
- ARV (on-the-fly)
- $141,064
- Comps found
- 4
Show comp detail 4 sales within ~0.75 mi
| Address | Dist | Beds/Ba | Sqft | Sold | Price | $/sf | Match |
|---|---|---|---|---|---|---|---|
| 424 E Strawberry St | 0.03mi | 2/1.0 (+1) | 624 (+1%) | 6mo | $143,000 | $229 | 86 |
| 307 Beaver St | 0.14mi | 1/1.0 | 672 (+9%) | 15mo | $112,000 | $167 | 66 |
| 327 Beaver St | 0.12mi | 2/1.5 (+1) | 702 (+14%) | 3mo | $159,900 | $228 | 62 |
| 70 Howard Ave | 0.46mi | 2/1.0 (+1) | 611 (-1%) | 19mo | $140,000 | $229 | 56 |
Match score weights: distance 35% · size 25% · config 20% · recency 20%. Top-matched comps best support the ARV.
Projected returns pro-forma
-3.0% appreciation · 1.2% rent growth · sell at horizon
- IRR
- -8.9%
- Equity multiple
- 0.68×
- Total profit
- $-11,663
- Equity at exit
- $19,383
- IRR
- -1.8%
- Equity multiple
- 0.89×
- Total profit
- $-4,125
- Equity at exit
- $11,240
Cash invested: $36,400 (down + closing). Projections, not guarantees.
Landlord ↔ Tenant lean methodology
- Overall (STATE)
- 62 Landlord-Friendly
- State Pennsylvania
- 62 Landlord-Friendly · EVEN
- County
- — inherits STATE
- City
- — inherits STATE
ZIP-level market 17602
- Rents YoY
- 1.2%
- Active inventory
- 161
- Price-to-rent
- 8.6×
Monthly cashflow live
- Estimated rent
- $1,259 high interval (Pro) →
- Mortgage (P&I)
- −$682
- Tax from tax record
- −$75 /mo · $905/yr
- Insurance
- −$54
- HOA
- −$0
- Vacancy / Maint / Mgmt
- −$264
- Net cashflow
- $183
Break-even live
UW: 25.0% down · 7.5% · 30yr · 1.5% tax · 5.0% vac · 8.0% maint · 8.0% mgmt
Financing live
Cash to close
- Down payment
- $32,500
- Closing costs
- $3,900
- Reserves months
- —
- Total cash needed
- —
Loan-product check · same deal, 3 products live
Conventional
25% down · 7.5% · 30yr
- Down + closing
- —
- Monthly P&I
- —
- Monthly cashflow
- —
- DSCR
- —
- Eligible?
- —
Personal DTI + credit; lowest rate.
DSCR
20% down · 8.5% · 30yr
- Down + closing
- —
- Monthly P&I
- —
- Monthly cashflow
- —
- DSCR
- —
- Eligible?
- —
No personal income docs; deal must DSCR.
Hard money
10% down · 12.0% · 12mo
- Down + closing
- —
- Monthly P&I
- —
- Monthly cashflow
- —
- DSCR
- —
- Eligible?
- —
Short-term bridge; refi at stabilization.
Rent comps 34 comps
| Address | Beds | Baths | Sqft | Rent | $/sqft | DOM | Units | Dist |
|---|---|---|---|---|---|---|---|---|
| 25 Conestoga St Unit 3 Lancaster, PA | 2.0 | 1.0 | 505 | $1,095 | $2.17 | 43d | 1 | 0.18mi |
| 34 Conestoga St Unit 1 Lancaster, PA | 2.0 | 1.0 | 671 | $995 | $1.48 | 21d | 1 | 0.18mi |
| 431 Fremont St Unit 4 Lancaster, PA | 1.0 | 1.0 | 641 | $1,095 | $1.71 | 43d | 1 | 0.38mi |
| 22 S Duke St Unit 2B Lancaster, PA | — | 1.0 | 400 | $1,150 | $2.88 | 43d | 1 | 0.38mi |
| 72 Howard Ave Lancaster, PA | 2.0 | 1.0 | 572 | $1,495 | $2.61 | 21d | 1 | 0.43mi |
| 61 Howard Ave Apt 1 Lancaster, PA | 2.0 | 1.0 | 650 | $1,045 | $1.61 | 43d | 1 | 0.45mi |
| 475 Saint Joseph St Lancaster, PA | 1.0 | 1.0 | 750 | $1,000 | $1.33 | 14d | 1 | 0.48mi |
| 205 E King St Unit 1 Lancaster, PA | 1.0 | 1.0 | 480 | $1,335 | $2.78 | 43d | 1 | 0.49mi |
| 35 N Mulberry St Unit 1st floor Lancaster, PA | 1.0 | 1.0 | 700 | $1,085 | $1.55 | 43d | 1 | 0.60mi |
| 118 N Prince St Lancaster, PA | 1.0–3.0 | 1.0–3.0 | 1274 | $1,695 | $1.33 | 14d | 48 | 0.62mi |
| 442 E King St Lancaster, PA | 1.0 | 1.0 | 600 | $925 | $1.54 | 23d | 1 | 0.62mi |
| 202 N Queen St Lancaster, PA | 2.0 | 1.0–2.0 | 697 | $2,134 | $3.06 | 14d | 12 | 0.68mi |
| 437 W Grant St Unit 302 Lancaster, PA | 1.0 | 1.0 | 650 | $1,775 | $2.73 | 23d | 1 | 0.73mi |
| 437 W Grant St Lancaster, PA | 1.0 | 1.0 | 713 | $1,795 | $2.52 | 23d | 1 | 0.73mi |
| 831 Fremont St Unit FR31004 Lancaster, PA | — | 1.0 | 384 | $975 | $2.54 | 43d | 1 | 0.73mi |
| 227 N Prince St Lancaster, PA | 1.0 | 1.0 | 483 | $1,575 | $3.26 | 14d | 4 | 0.74mi |
| 38 E Walnut St Lancaster, PA | 1.0 | 1.0 | 587 | $1,495 | $2.55 | 23d | 1 | 0.74mi |
| 11 E Walnut St Unit 3 Lancaster, PA | 1.0 | 1.0 | 475 | $1,325 | $2.79 | 43d | 1 | 0.77mi |
| 249 N Mulberry St Unit 4 Lancaster, PA | 1.0 | 1.0 | 510 | $1,150 | $2.25 | 23d | 1 | 0.81mi |
| 502 4th St Apt C Lancaster, PA | 1.0 | 1.0 | 400 | $1,200 | $3.00 | 43d | 1 | 0.82mi |
| 114 E Lemon St Lancaster, PA | 1.0 | 1.0 | 627 | $1,347 | $2.15 | 14d | 2 | 0.85mi |
| 347 N Queen St Lancaster, PA | 1.0 | 1.0 | 687 | $2,025 | $2.95 | 14d | 10 | 0.86mi |
| 323 N Mulberry St Unit 4 Lancaster, PA | 1.0 | 1.0 | 600 | $1,500 | $2.50 | 14d | 1 | 0.87mi |
| 344 N Mulberry St Unit 2 Lancaster, PA | 1.0 | 1.0 | 722 | $1,065 | $1.48 | 23d | 1 | 0.92mi |
| 1127 Wabank St Lancaster, PA | 1.0–2.0 | 1.0 | 760 | $1,395 | $1.84 | 23d | 1 | 0.95mi |
| 450 N Queen St Lancaster, PA | — | 1.0 | 365 | $1,100 | $3.01 | 14d | 1 | 0.97mi |
| 446 N Duke St Unit 2F Lancaster, PA | 1.0 | 1.0 | 520 | $1,085 | $2.09 | 23d | 1 | 0.97mi |
| 446 N Duke St Unit 1R Lancaster, PA | 1.0 | 1.0 | 580 | $1,095 | $1.89 | 43d | 1 | 0.97mi |
| 40 W James St Unit 2 Lancaster, PA | 1.0 | 1.0 | 500 | $1,200 | $2.40 | 14d | 1 | 0.98mi |
| 506 N Queen St Unit 2 Lancaster, PA | 1.0 | 1.0 | 556 | $1,500 | $2.70 | 14d | 1 | 1.00mi |
| 480 Euclid Ave Lancaster, PA | 1.0–2.0 | 1.0–1.5 | 830 | $1,425 | $1.72 | 43d | 1 | 1.03mi |
| 445 W Lemon St Unit 4 Lancaster, PA | 1.0 | 1.5 | 540 | $1,445 | $2.68 | 23d | 1 | 1.04mi |
| 709 N Duke St Lancaster, PA | 1.0 | 1.0 | 588 | $1,550 | $2.64 | 21d | 1 | 1.21mi |
| 816 N Prince St Lancaster, PA | 1.0–2.0 | 1.0–2.0 | 794 | $1,545 | $1.95 | 14d | 7 | 1.30mi |
Listing history 13 events
-
2026-06-18days on market $130,000 Coming Soon 17 DOM
-
2026-06-17days on market $130,000 Coming Soon 16 DOM
-
2026-06-16days on market $130,000 Coming Soon 15 DOM
-
2026-06-15days on market $130,000 Coming Soon 14 DOM
-
2026-06-14days on market $130,000 Coming Soon 12 DOM
-
2026-06-13days on market $130,000 Coming Soon 11 DOM
-
2026-06-10days on market $130,000 Coming Soon 9 DOM
-
2026-06-09days on market $130,000 Coming Soon 8 DOM
-
2026-06-08days on market $130,000 Coming Soon 7 DOM
-
2026-06-07days on market $130,000 Coming Soon 6 DOM
-
2026-06-03days on market $130,000 Coming Soon 2 DOM
-
2026-06-02remarks 24-char remark
-
2026-06-02$130,000 Coming Soon 1 DOM
ⓘ Source: listings_history table (triggers on properties + properties_extension) + one-shot
backfill from property_details.listing_events for pre-trigger history.
Tax reassessment forecast PA · Partial reset (capped growth)
- Current annual tax
- $905 · $75/mo
- Projected year-2 tax
- $1,479 · $123/mo
- Expected delta
- +$575/yr (+$48/mo · 63.5%)
ⓘ Screening estimate from a state-policy table — verify with the county assessor before closing.
Climate risk First Street
- Flood 1/10 Low FEMA zone X (unshaded) · 0% chance over 30 yrs
- Wildfire 1/10 Low
- Heat 6/10 Major 7 d/yr ≥101°F today · 15 d/yr by 30 yrs out
- Wind 4/10 Moderate 15% chance of damaging wind over 30 yrs
- Air quality 4/10 Moderate 4 unhealthy d/yr today · 7 by 30 yrs out
Nearby sold comps map
Loading sold comps map…
Walkable amenities ~0.75 mi
Loading nearby amenities…
Taxation est. · year 1
- Rental income
- $15,109
- − Mortgage interest
- −$7,282
- − Property taxes
- −$905
- − Insurance
- −$650
- − Repairs & maintenance
- −$1,209
- − Management
- −$1,209
- − Depreciation
- −$3,782
- Taxable income
- $73
- Est. tax owed @ 24.0%
- −$17
- After-tax cash flow
- $2,183/yr
For passive investors: Depreciation is non-cash, so a rental often shows a tax loss while cash-flowing — sheltering income. Rental losses are passive: they offset passive income freely, and up to $25,000/yr can offset ordinary (W-2) income if you actively participate and your MAGI is under $100k (phasing out to $0 by $150k); unused losses carry forward. On sale, claimed depreciation is recaptured at up to 25%, and gains may owe capital-gains tax (a 1031 exchange can defer both). Figures are a year-1 estimate at your 24.0% rate — not tax advice; consult a CPA.
Schools (NCES district)
- District
- Lancaster SD
- NCES district ID
- 4213140
- Math proficiency
- 12% ▼ -10.00%
- Reading proficiency
- 25% ▼ -13.00%
- Median HH income
- $38,500
- Composite
- 15.52/100
- National rank
- #9301
- State rank
- #500 of 539 in PA
Livability — Lancaster
- Score
- 85/100
- State rank
- #71
- US rank
- #498
Category grades
Schools grade is shown separately in the Schools card above.
Census & demographics
- Census place
- Lancaster, PA
- County
- Lancaster County · 390,309 people
- City population
- 176,170
- Metro
- Lancaster, PA
- Population (ZIP)
- 52,217
- Household income
- $75,862
- Rent vs Own
- Severe rent burden
- 1556.0
Population outlook (Lancaster County) Hauer SSP2
- Today (2025)
- 561,011 people
- By 2030
- 570,969 · +1.8%
- By 2040
- 585,929 · +4.4%
- By 2050
- 591,056 · +5.4%
- By 2075
- 594,747 · +6.0%
- By 2100
- 558,850 · -0.4%
Race, ethnicity, and origin ACS 2023
- Neighborhood character
- Diverse neighborhood (Simpson 0.61)
- Race & ethnicity
- White 52% Hispanic / Latino 32% Two or more races 12% Black 11% Asian 2%
- Hispanic origin (detail)
- Mexican 2% Puerto Rican 21% Cuban 1% Dominican 4%
- Common ancestry
- Romanian 2% Italian 1% Lithuanian 1%
- Foreign-born
- 13% · Canada, Vietnam, South Korea
- Languages at home
- 70% English-only · Spanish 22% German/W. Germanic 2% French/Haitian/Cajun 1%
Political lean MEDSL · Lancaster
- 2024 margin
- R (+15.9) · D 41.5% · R 57.5%
- 2008→2024 swing
- -4.1pp toward R · 2008: -11.8pp · 2024: -15.9pp
- All cycles
- 2024: R+15.9 2020: R+15.8 2016: R+19.7 2012: R+19.2 2008: R+11.8
Not yet ingested
- Civics
- —
Market trends
- HPI YoY
- ▼ -248.05%
- Current HPI
- 288.9141
- Rent YoY
- ▲ 1.20%
- Metro
- Lancaster, PA
- State GDP YoY
- ▲ 1.68%
- F500 in state
- 34
Industry mix (Fortune 500 HQ in PA)
| Industry | F500 HQs | Revenue |
|---|---|---|
| Healthcare | 2 | $309B |
|
||
| Insurance | 2 | $27B |
|
||
| Telecommunications / Media | 1 | $124B |
|
||
| Industrial Distribution | 1 | $22B |
|
||
| Financial Services | 1 | $20B |
|
||
| Chemicals / Materials | 1 | $18B |
|
||
Price history
+334.8% since first listed6 events — show timeline
- 2026-06-01 Coming Soon $130,000 BRIGHT MLS
- 2017-10-06 Sold (MLS) $27,500 BRIGHT MLS
- 2017-09-27 Listing Removed — BRIGHT MLS
- 2017-09-24 Listing Removed — BRIGHT MLS
- 2017-09-24 Listed $29,900 BRIGHT MLS
- 2017-08-31 Listed $29,900 BRIGHT MLS
Property tax history
-1.8%/yrLatest (2026): $905 · +3.3% YoY. Source: county tax records.
Cash-flow waterfall
monthlySold comps — $/sqft
last 12 mo · ≤1 miLoading sold comps…