18830 Highway 99e #42 · West Linn, OR
Flood risk 6/10 · Moderate
- FEMA flood zone
- X (unshaded)
- Chance of flooding over 30 yrs
- 0.27%
- Est. flood insurance / yr
- $473 – $860
Fire risk 4/10 · Minor
- Est. fire insurance / yr
- $498 – $926
Heat risk 3/10 · Minor
- Hot days now (above 93°F)
- 7 days/yr
- Hot days in 30 yrs
- 15 days/yr
Wind risk 1/10 · Minimal
- Chance of severe wind over 30 yrs
- —
Air-quality risk 9/10 · Severe
- Unhealthy air days now
- 13 days/yr
- Unhealthy air days in 30 yrs
- 16 days/yr
Risk factors via First Street. Map © Google.
Why this score? — see what drove the D grade
The composite is a weighted blend of 9 inputs, each scored 0–100. Each bar is that input's sub-score; the figure is the points it added to the 100-point composite (weight × sub-score).
- Cash flow +15.0/30.0
- ARV discount +7.5/15.0
- 1% rule +5.0/10.0
- DSCR +5.0/10.0
- Livability +4.2/5.0
- Rent growth +2.8/5.0
- Schools +2.7/10.0
- Condition / age +2.5/5.0
- Appreciation +0.0/10.0
$19,000
🖨 Deal sheet (PDF) 📄 Offer letter ✓ Due diligence
Listing remarks
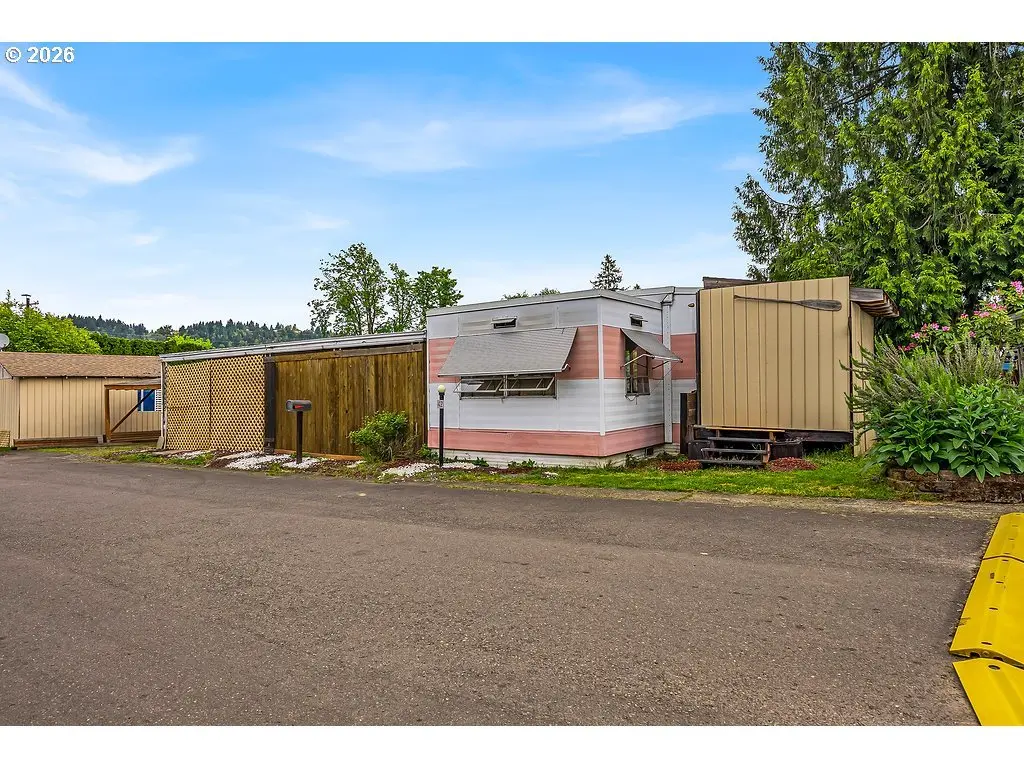
Incredible opportunity to own this 2 bed, 1 bath, 1961 mobile home in a well maintained park right next to the water that could use some love. Filled with timeless midcentury character, the home features a functional single level layout with a welcoming, easy flow. A finished add on expands the living space, creating a comfortable dining area and versatile bonus room to fit your needs. Outside, enjoy a built out back porch and an exterior carport. With its unbeatable price point and close proximity to the water, this property is perfect for buyers looking to invest in potential, personalize a home, and enjoy a lifestyle that’s hard to match at this value. Space rent is $895/month.
Key facts
- Built out back porch
- Well maintained park
- Exterior carport
Tags
Property features AI
Finance
- Other: Property is resale; Land lease not indicated
- HOA & community: Located in Forest Park Mobile Village (lot rent $895 monthly); Not a senior community
Exterior
- Parking: Carport
- Utilities: Electric fuel; Public water; Public sewer
- Home design: Manufactured home in a park (residential); One story; No notable view; Main living area approximately 600
- Construction: Built in 1961; Slate roof; Skirting foundation
- Exterior features: Yard; Metal siding
Interior
- Kitchen: Kitchen on main level
- Bedrooms: Primary bedroom on main level with closet; Second bedroom on main level with closet
- Bathrooms: One full bathroom (main level)
- Heating & cooling: Forced air heating; Heat pump cooling
- Interior features: Single-level accessibility; Aluminum window frames; Crawl space with skirting
- Laundry & utility: Electric hot water
Neighborhood map
What this means for you Summary
Snapshot
- This is a 2-bed/1.0-bath other listed at $19k.
Deal economics
- At list price, monthly cash flow is $1k ($14k/yr) — positive.
- The deal already cash-flows at list — no discount required.
- Meets the 1% rule at list price ($2k rent vs $19k).
- Recommended offer: $18k (3.0% below list) — sets the bar for market timing.
Location & tenants
- Location reads 85/100 on livability (#20 in OR, #462 nationally) — a professional / high-income tenant draw. Strengths: crime A+, commute A+, employment A+; Watch: amenities C-, cost of living F.
- Oregon City SD 62 (suburban): math 18% / reading 40% proficiency, ranked #40 of 58 in OR (top 69%) — low school quality limits family demand, transient renter base, plan for 1-2y turnover.
- Zoned schools: Holcomb Elementary School (math 17% / reading 32%, grade F, #320 of 412 statewide, top 82%, 528 students, 43% FRL); Tumwata Middle School (math 11% / reading 37%, grade F, #115 of 128 statewide, top 90%, 654 students, 34% FRL); Oregon City Senior High School (math 17% / reading 52%, grade F, #94 of 143 statewide, top 70%, 1,931 students, 25% FRL) — zoned schools at 34% FRL track the district average.
- Market conditions: Rents rising (+1.1%/yr); 416 active listings in the ZIP; solid renter incomes; 946 units permitted in Clackamas County in 2024 (188 in 5+ unit buildings).
Forward outlook
- Local home prices are declining (-3.0%/yr); year-one equity from $131 of loan paydown is wiped out by about $570 of value loss. Plan a longer hold.
- Clackamas County population projected at +25% by 2050 — long-run rental-demand tailwind backs the buy-and-hold thesis.
- At projected returns (-3.0% appreciation + 1.1% rent growth), your $5k cash investment doubles in ~1 year — after that, you're playing with house money.
Negotiation context
- It's been on market 45 days — a 3% lower offer ($18k) is reasonable based on typical stale-listing flexibility.
- 2 sale attempts; this cycle's ask has dropped $6k (24%) from the opening price — seller is motivated, your offer sets the floor, not the list.
Risks & watch-outs
- Climate carrying-cost: major flood risk — expect insurance premiums to compound above CPI over the hold.
Questions for the listing agent
- It's been on market 45 days. Have you received any prior offers? Is the seller open to a 3% concession, seller financing, or rate buy-down credit?
- Built in 1961 — when were the roof, HVAC, electrical panel, plumbing, and water heater last replaced?
- Is there a deadline driving the sale (1031 exchange, divorce, estate, relocation)? That informs how much negotiation room exists.
- Schools are A-rated — typically a magnet for longer-tenancy family renters. What's the average tenant stay here, and is there a school-zone premium baked into asking?
- The area grade is low — what's the realistic commute time and amenity access for the typical tenant pool here? Any planned neighborhood developments (good or bad) we should know about?
- What's the average days-on-market for RENTAL listings here right now (not sales)? A rising rental-DOM trend means longer vacancies and softer asking-rent achievability than the comps imply.
- What's the recent tenant-quality profile in this submarket — average credit score on applications, eviction rate, late-payment / NSF rate, and stable-employment percentage? A property-management company in the area should have these aggregated.
- How much new for-sale + rental construction is in the pipeline within 1–3 miles? Heavy new supply typically softens prices + rents 12–24 months out; constrained supply supports both.
Investment metrics
- 1% rule
- 8.73% ✓
- Cap rate
- 81.98%
- Cash-on-cash
- 270.30%
- DSCR
- 13.03
- GRM
- 1.0
CMA / ARV
No comps found within radius.
Projected returns pro-forma
-3.0% appreciation · 1.12% rent growth · sell at horizon
- IRR
- —
- Equity multiple
- 14.19×
- Total profit
- $70,176
- Equity at exit
- $2,833
- IRR
- —
- Equity multiple
- 28.68×
- Total profit
- $147,271
- Equity at exit
- $1,643
Cash invested: $5,320 (down + closing). Projections, not guarantees.
Landlord ↔ Tenant lean methodology
- Overall (STATE)
- 28 Tenant-Leaning
- State Oregon
- 28 Tenant-Leaning · D+6
- County
- — inherits STATE
- City
- — inherits STATE
ZIP-level market 97045
- Rents YoY
- 1.1%
- Active inventory
- 416
- Price-to-rent
- 1.0×
Monthly cashflow live
- Estimated rent
- $1,658 medium interval (Pro) →
- Mortgage (P&I)
- −$100
- Tax from tax record
- −$4 /mo · $47/yr
- Insurance
- −$8
- HOA
- −$0
- Vacancy / Maint / Mgmt
- −$348
- Net cashflow
- $1,198
Break-even live
Sensitivity live
| Price | -10% $1,209 | -5% $1,204 | +0% $1,198 | +5% $1,193 | +10% $1,188 |
|---|---|---|---|---|---|
| Rent | -10% $1,067 | -5% $1,133 | +0% $1,198 | +5% $1,264 | +10% $1,329 |
| Rate | -1.0pp $1,208 | -0.5pp $1,203 | base $1,198 | +0.5pp $1,193 | +1.0pp $1,188 |
UW: 25.0% down · 7.5% · 30yr · 1.5% tax · 5.0% vac · 8.0% maint · 8.0% mgmt
Financing live
Cash to close
- Down payment
- $4,750
- Closing costs
- $570
- Reserves months
- —
- Total cash needed
- —
Loan-product check · same deal, 3 products live
Conventional
25% down · 7.5% · 30yr
- Down + closing
- —
- Monthly P&I
- —
- Monthly cashflow
- —
- DSCR
- —
- Eligible?
- —
Personal DTI + credit; lowest rate.
DSCR
20% down · 8.5% · 30yr
- Down + closing
- —
- Monthly P&I
- —
- Monthly cashflow
- —
- DSCR
- —
- Eligible?
- —
No personal income docs; deal must DSCR.
Hard money
10% down · 12.0% · 12mo
- Down + closing
- —
- Monthly P&I
- —
- Monthly cashflow
- —
- DSCR
- —
- Eligible?
- —
Short-term bridge; refi at stabilization.
Listing history 11 events
-
2026-06-21days on market $19,000 Active 45 DOM
-
2026-06-18days on market $19,000 Active 42 DOM
-
2026-06-17days on market $19,000 Active 41 DOM
-
2026-06-16days on market $19,000 Active 40 DOM
-
2026-06-15days on market $19,000 Active 39 DOM
-
2026-06-13days on market $19,000 Active 37 DOM
-
2026-06-09days on market $19,000 Active 33 DOM
-
2026-06-08days on market $19,000 Active 32 DOM
-
2026-06-07statusdays on market $19,000 Active 31 DOM
-
2026-05-19price $19,000 695-char remark
-
2026-04-29$25,000 Active 695-char remark
ⓘ Source: listings_history table (triggers on properties + properties_extension) + one-shot
backfill from property_details.listing_events for pre-trigger history.
Tax reassessment forecast OR · Resets to sale price
- Current annual tax
- $47 · $4/mo
- Projected year-2 tax
- $184 · $15/mo
- Expected delta
- +$137/yr (+$11/mo · 288.9%)
ⓘ Screening estimate from a state-policy table — verify with the county assessor before closing.
Climate risk First Street
- Flood 6/10 Major FEMA zone X (unshaded) · 27% chance over 30 yrs
- Wildfire 4/10 Moderate
- Heat 3/10 Moderate 7 d/yr ≥93°F today · 15 d/yr by 30 yrs out
- Wind 1/10 Low
- Air quality 9/10 Extreme 13 unhealthy d/yr today · 16 by 30 yrs out
Nearby sold comps map
Loading sold comps map…
Walkable amenities ~0.75 mi
Loading nearby amenities…
Taxation est. · year 1
- Rental income
- $19,896
- − Mortgage interest
- −$1,064
- − Property taxes
- −$47
- − Insurance
- −$95
- − Repairs & maintenance
- −$1,592
- − Management
- −$1,592
- − Depreciation
- −$553
- Taxable income
- $14,953
- Est. tax owed @ 24.0%
- −$3,589
- After-tax cash flow
- $10,791/yr
For passive investors: Depreciation is non-cash, so a rental often shows a tax loss while cash-flowing — sheltering income. Rental losses are passive: they offset passive income freely, and up to $25,000/yr can offset ordinary (W-2) income if you actively participate and your MAGI is under $100k (phasing out to $0 by $150k); unused losses carry forward. On sale, claimed depreciation is recaptured at up to 25%, and gains may owe capital-gains tax (a 1031 exchange can defer both). Figures are a year-1 estimate at your 24.0% rate — not tax advice; consult a CPA.
Schools (NCES district)
- District
- Oregon City SD 62
- NCES district ID
- 4109330
- Math proficiency
- 18% ▼ -21.00%
- Reading proficiency
- 40% ▼ -18.00%
- Median HH income
- $64,272
- Composite
- 26.65/100
- National rank
- #7169
- State rank
- #40 of 58 in OR
Livability — West Linn
- Score
- 85/100
- State rank
- #20
- US rank
- #462
Category grades
Schools grade is shown separately in the Schools card above.
Census & demographics
- County
- Clackamas County · 361,406 people
- City population
- 30,161
- Metro
- Portland-Vancouver-Hillsboro, OR-WA
- Population (ZIP)
- 57,526
- Household income
- $103,573
- Rent vs Own
- Severe rent burden
- 1045.0
Population outlook (Clackamas County) Hauer SSP2
- Today (2025)
- 458,456 people
- By 2030
- 485,185 · +5.8%
- By 2040
- 532,932 · +16.2%
- By 2050
- 574,445 · +25.3%
- By 2075
- 665,497 · +45.2%
- By 2100
- 697,488 · +52.1%
Race, ethnicity, and origin ACS 2023
- Neighborhood character
- Predominantly White (85%)
- Race & ethnicity
- White 85% Two or more races 8% Hispanic / Latino 6% Asian 1% Black 1%
- Hispanic origin (detail)
- Mexican 5%
- Common ancestry
- Portuguese 4% Italian 3% Slovak 3%
- Foreign-born
- 5% · Canada
- Languages at home
- 91% English-only · Spanish 4% Russian/Polish/Slavic 2% Other Indo-European 1%
Political lean MEDSL · Clackamas
- 2024 margin
- Lean D (+9.7) · D 53.4% · R 43.6% · Other 3.0%
- 2008→2024 swing
- -0.6pp no change · 2008: 10.4pp · 2024: 9.7pp
- All cycles
- 2024: D+9.7 2020: D+11.1 2016: D+6.1 2012: D+3.5 2008: D+10.4
Not yet ingested
- Civics
- —
Market trends
- HPI YoY
- ▼ -624.55%
- Current HPI
- 301.9661
- Rent YoY
- ▲ 1.12%
- Metro
- Portland-Vancouver-Hillsboro, OR-WA
- State GDP YoY
- ▲ 2.05%
- F500 in state
- 2
Industry mix (Fortune 500 HQ in OR)
| Industry | F500 HQs | Revenue |
|---|---|---|
| Consumer Goods | 1 | $51B |
|
||
Price history
-24.0% since first listed4 events — show timeline
- 2026-06-06 Relisted — RMLS
- 2026-05-30 Pending — RMLS
- 2026-05-19 Price Changed $19,000 RMLS
- 2026-04-29 Listed $25,000 RMLS
Property tax history
+10.1%/yrLatest (2018): $47 · +16.1% YoY. Source: county tax records.
Cash-flow waterfall
monthlySold comps — $/sqft
last 12 mo · ≤1 miLoading sold comps…