 Multi-family
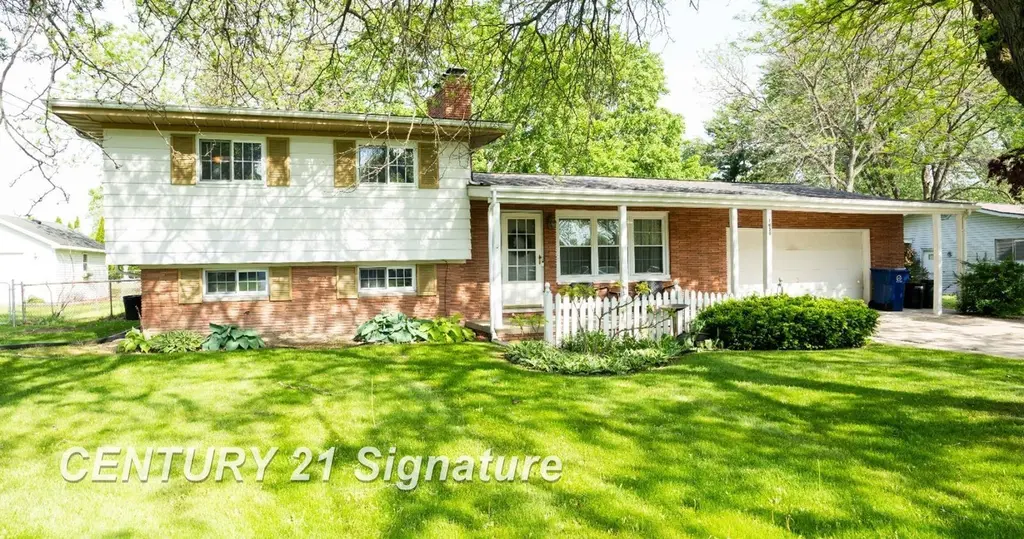
1650 Fromm Dr · Shields, MI
Flood risk 1/10 · Minimal
- FEMA flood zone
- X (unshaded)
- Chance of flooding over 30 yrs
- 0.0%
- Est. flood insurance / yr
- $473 – $860
Fire risk 1/10 · Minimal
- Est. fire insurance / yr
- $784 – $1,456
Heat risk 2/10 · Minimal
- Hot days now (above 99°F)
- 7 days/yr
- Hot days in 30 yrs
- 14 days/yr
Wind risk 1/10 · Minimal
- Chance of severe wind over 30 yrs
- —
Air-quality risk 2/10 · Minimal
- Unhealthy air days now
- 1 days/yr
- Unhealthy air days in 30 yrs
- 2 days/yr
Risk factors via First Street. Map © Google.
Why this score? — see what drove the C grade
The composite is a weighted blend of 9 inputs, each scored 0–100. Each bar is that input's sub-score; the figure is the points it added to the 100-point composite (weight × sub-score).
- Cash flow +24.2/30.0
- DSCR +7.8/10.0
- ARV discount +7.5/15.0
- 1% rule +5.6/10.0
- Livability +4.0/5.0
- Schools +3.1/10.0
- Rent growth +2.5/5.0
- Condition / age +2.5/5.0
- Appreciation +0.0/10.0
$225,000
🖨 Deal sheet 📄 Offer letter ✓ Due diligence
Multi-family units
County records classify this as Multi-Family (2-4 Unit). Listing-text estimate: 1 unit. estimate disagrees with records
Listing remarks MLS
Located in a desirable Saginaw Township neighborhood, this well-maintained quad-level home offers the perfect blend of comfort, space, and convenience. Featuring 3 bedrooms and 2½ bathrooms, the home includes a spacious living room, a cozy family room, a dedicated office space, and an eat-in kitchen designed for both everyday living and entertaining. Step outside to enjoy summer evenings on the patio overlooking the fenced backyard, complete with a storage shed for added convenience. The current owners have completed several valuable updates, including fresh paint, refinished hardwood floors, professional basement waterproofing with a lifetime transferable warranty, and a new vent relining with a transferable guarantee providing added peace of mind for the next owner. New electrical panel, service wire, grounding, breakers, and GFCI. All appliances, including the washer and dryer, will remain with the home, making this property truly move-in ready.
Key facts
- Cozy family room
- Storage shed
- Eat-in kitchen
Tags
Property features AI
Finance
- Other: Listed by Century 21 Signature Realty
- HOA & community: Homeowners association present
Exterior
- Parking: Attached 2-car garage
- Utilities: Public water; Public sewer
- Home design: Single-family residential property
- Construction: Aluminum siding and brick exterior
- Exterior features: Lot dimensions approximately 141 x 104; Lot size about 0.34 acres; Subdivision: BURKHAVEN; Cross streets: Brockway Dr / Datona Rd
Interior
- Bedrooms: Total of 7 rooms (bedroom count not specified)
- Bathrooms: Two full bathrooms; One half bathroom
- Heating & cooling: Forced air heating (natural gas); No central air listed
- Interior features: Fireplace in family room and living room; Basement
Neighborhood map
What this means for you Summary
Snapshot
- This is a 3-bed/2.5-bath multifamily listed at $225k.
Deal economics
- At list price, monthly cash flow is $451 ($5k/yr) — positive.
- The deal already cash-flows at list — no discount required.
- Meets the 1% rule at list price ($2k rent vs $225k).
- Recommended offer: $222k (1.5% below list) — sets the bar for market timing.
- Cap rate 8.7% vs local median 4.5% in Shields — top-decile yield for the area; either an underpriced asset or a hidden risk that comps aren't pricing in. Stress-test before assuming the spread holds.
Location & tenants
- Location reads 81/100 on livability (#59 in MI, #1,310 nationally) — a professional / high-income tenant draw. Strengths: cost of living A+, housing A+, health & safety A+; Watch: amenities F, commute F.
- Saginaw Township Community Schools (suburban): math 27% / reading 45% proficiency, ranked #265 of 540 in MI (top 49%) — families likely to look elsewhere, expect single-tenant / working-renter base with shorter leases.
- Market conditions: 85 active listings in the ZIP; 1 comparable units currently listed for rent nearby; 154 units permitted in Saginaw County in 2024 (0 in 5+ unit buildings).
Forward outlook
- Local home prices are declining (-3.0%/yr); year-one equity from $2k of loan paydown is wiped out by about $7k of value loss. Plan a longer hold.
- Saginaw County population projected at -25% by 2050 — secular population decline; favor cash flow + early exit over multi-decade hold.
Negotiation context
- It's been on market 15 days — a 2% lower offer ($222k) is reasonable based on typical stale-listing flexibility.
- 10 sale attempts since 22y ago with the ask held roughly flat each time — persistent listings suggest the price (not the market) is what's stuck; bring a comps-based counter.
- Current owner paid $187k; 20% above their basis — modest negotiation headroom, anchor on the comps not their cost.
Questions for the listing agent
- Built in 1964 — when were the roof, HVAC, electrical panel, plumbing, and water heater last replaced?
- Is there a deadline driving the sale (1031 exchange, divorce, estate, relocation)? That informs how much negotiation room exists.
- Schools are B-rated — typically a magnet for longer-tenancy family renters. What's the average tenant stay here, and is there a school-zone premium baked into asking?
- What's the average days-on-market for RENTAL listings here right now (not sales)? A rising rental-DOM trend means longer vacancies and softer asking-rent achievability than the comps imply.
- What's the recent tenant-quality profile in this submarket — average credit score on applications, eviction rate, late-payment / NSF rate, and stable-employment percentage? A property-management company in the area should have these aggregated.
- How much new apartment / multifamily construction is in the pipeline within 1–3 miles? Heavy new supply (>2% of stock underway) typically softens rents 12–24 months out; light construction supports rent growth.
Investment metrics
- 1% rule
- 1.06% ✓
- Cap rate
- 8.70%
- Cash-on-cash
- 8.58%
- DSCR
- 1.38
- GRM
- 7.8
CMA / ARV
No comps found within radius.
Projected returns pro-forma
-3.0% appreciation · 3.0% rent growth · sell at horizon
- IRR
- -3.3%
- Equity multiple
- 0.88×
- Total profit
- $-7,794
- Equity at exit
- $33,548
- IRR
- 6.4%
- Equity multiple
- 1.48×
- Total profit
- $30,022
- Equity at exit
- $19,454
Cash invested: $63,000 (down + closing). Projections, not guarantees.
Landlord ↔ Tenant lean methodology
- Overall (STATE)
- 62 Landlord-Friendly
- State Michigan
- 62 Landlord-Friendly · EVEN
- County
- — inherits STATE
- City
- — inherits STATE
ZIP-level market 48638
- Home prices YoY
- -32.6%
- Active inventory
- 85
- Price-to-rent
- 15.7×
Monthly cashflow live
- Estimated rent
- $2,389 medium interval (Pro) →
- Mortgage (P&I)
- −$1,180
- Tax from tax record
- −$163 /mo · $1,956/yr
- Insurance
- −$94
- HOA
- −$0
- Vacancy / Maint / Mgmt
- −$502
- Net cashflow
- $451
Break-even live
2-unit breakdown (identical units grouped — click to expand)
| Units | Beds | Baths | Est. rent |
|---|---|---|---|
| 2× units | 3 | 1.5 | $2,388 |
| #1 | 3 | 1.5 | $1,194 |
| #2 | 3 | 1.5 | $1,194 |
| Total (2 units) | $2,389 | ||
UW: 25.0% down · 7.5% · 30yr · 1.5% tax · 5.0% vac · 8.0% maint · 8.0% mgmt
Financing live
Cash to close
- Down payment
- $56,250
- Closing costs
- $6,750
- Reserves months
- —
- Total cash needed
- —
Loan-product check · same deal, 3 products live
Conventional
25% down · 7.5% · 30yr
- Down + closing
- —
- Monthly P&I
- —
- Monthly cashflow
- —
- DSCR
- —
- Eligible?
- —
Personal DTI + credit; lowest rate.
DSCR
20% down · 8.5% · 30yr
- Down + closing
- —
- Monthly P&I
- —
- Monthly cashflow
- —
- DSCR
- —
- Eligible?
- —
No personal income docs; deal must DSCR.
Hard money
10% down · 12.0% · 12mo
- Down + closing
- —
- Monthly P&I
- —
- Monthly cashflow
- —
- DSCR
- —
- Eligible?
- —
Short-term bridge; refi at stabilization.
Rent comps 1 comps
| Address | Beds | Baths | Sqft | Rent | $/sqft | DOM | Units | Dist |
|---|---|---|---|---|---|---|---|---|
| 4156 Ann St Saginaw, MI | 4.0 | 1.5 | 1387 | $1,225 | $0.88 | 43d | 1 | 1.42mi |
Listing history 11 events
-
2026-06-19days on market $225,000 Active 15 DOM
-
2026-06-18days on market $225,000 Active 14 DOM
-
2026-06-17days on market $225,000 Active 13 DOM
-
2026-06-16days on market $225,000 Active 12 DOM
-
2026-06-15days on market $225,000 Active 11 DOM
-
2026-06-14days on market $225,000 Active 9 DOM
-
2026-06-12days on market $225,000 Active 8 DOM
-
2026-06-09days on market $225,000 Active 5 DOM
-
2026-06-08days on market $225,000 Active 4 DOM
-
2026-06-07remarks 692-char remark
-
2026-06-07$225,000 Active 3 DOM
ⓘ Source: listings_history table (triggers on properties + properties_extension) + one-shot
backfill from property_details.listing_events for pre-trigger history.
Tax reassessment forecast MI · Partial reset (capped growth)
- Current annual tax
- $1,956 · $163/mo
- Projected year-2 tax
- $2,710 · $226/mo
- Expected delta
- +$755/yr (+$63/mo · 38.6%)
ⓘ Screening estimate from a state-policy table — verify with the county assessor before closing.
Climate risk First Street
- Flood 1/10 Low FEMA zone X (unshaded) · 0% chance over 30 yrs
- Wildfire 1/10 Low
- Heat 2/10 Low 7 d/yr ≥99°F today · 14 d/yr by 30 yrs out
- Wind 1/10 Low
- Air quality 2/10 Low 1 unhealthy d/yr today · 2 by 30 yrs out
Nearby sold comps map
Loading sold comps map…
Walkable amenities ~0.75 mi
Loading nearby amenities…
Taxation est. · year 1
- Rental income
- $28,668
- − Mortgage interest
- −$12,603
- − Property taxes
- −$1,956
- − Insurance
- −$1,125
- − Repairs & maintenance
- −$2,293
- − Management
- −$2,293
- − Depreciation
- −$6,545
- Taxable income
- $1,851
- Est. tax owed @ 24.0%
- −$444
- After-tax cash flow
- $4,963/yr
For passive investors: Depreciation is non-cash, so a rental often shows a tax loss while cash-flowing — sheltering income. Rental losses are passive: they offset passive income freely, and up to $25,000/yr can offset ordinary (W-2) income if you actively participate and your MAGI is under $100k (phasing out to $0 by $150k); unused losses carry forward. On sale, claimed depreciation is recaptured at up to 25%, and gains may owe capital-gains tax (a 1031 exchange can defer both). Figures are a year-1 estimate at your 24.0% rate — not tax advice; consult a CPA.
Schools (NCES district)
- District
- Saginaw Township Community Schools
- NCES district ID
- 2630450
- Math proficiency
- 27% ▼ -9.00%
- Reading proficiency
- 45% ▼ -4.00%
- Median HH income
- $48,971
- Composite
- 31.01/100
- National rank
- #6094
- State rank
- #265 of 540 in MI
Livability — Shields
- Score
- 81/100
- State rank
- #59
- US rank
- #1310
Category grades
Schools grade is shown separately in the Schools card above.
Census & demographics
- Population (ZIP)
- 12,668
Population outlook (Saginaw County) Hauer SSP2
- Today (2025)
- 180,568 people
- By 2030
- 172,302 · -4.6%
- By 2040
- 153,919 · -14.8%
- By 2050
- 135,519 · -24.9%
- By 2075
- 97,199 · -46.2%
- By 2100
- 65,037 · -64.0%
Race, ethnicity, and origin ACS 2023
- Neighborhood character
- Predominantly White (73%)
- Race & ethnicity
- White 73% Black 14% Hispanic / Latino 10% Two or more races 6% Asian 1%
- Hispanic origin (detail)
- Mexican 10%
- Common ancestry
- Romanian 9% Lithuanian 4% Slovak 2%
- Foreign-born
- 2% · Canada, China
- Languages at home
- 96% English-only · Spanish 2%
Political lean MEDSL · Saginaw
- 2024 margin
- Toss-up / Even · D 47.7% · R 51.0% · Other 1.4%
- 2008→2024 swing
- -20.6pp toward R · 2008: 17.3pp · 2024: -3.3pp
- All cycles
- 2024: R+3.3 2020: D+0.3 2016: R+1.1 2012: D+11.9 2008: D+17.3
Not yet ingested
- Civics
- —
Market trends
- HPI YoY
- ▼ -79.44%
- Current HPI
- 164.3443
- Rent YoY
- —
- Metro
- —
- State GDP YoY
- ▲ 1.37%
- F500 in state
- 28
Industry mix (Fortune 500 HQ in MI)
| Industry | F500 HQs | Revenue |
|---|---|---|
| Automotive Parts | 3 | $48B |
|
||
| Automotive | 2 | $372B |
|
||
| Chemicals | 1 | $45B |
|
||
| Automotive Retail | 1 | $29B |
|
||
| Healthcare / Medical Devices | 1 | $23B |
|
||
| Automotive Technology | 1 | $20B |
|
||
Price history
+55.3% since first listed25 events — show timeline
- 2026-06-04 Listed $225,000 REALCOMP
- 2026-06-04 Listed $225,000 MiRealSource-MiMLS
- 2023-05-25 Sold (Public Records) $187,000 Public Records
- 2023-05-22 Sold (MLS) $187,000 MiRealSource-MiMLS
- 2023-05-22 Sold (MLS) $187,000 REALCOMP
- 2023-04-27 Pending — REALCOMP
- 2023-04-27 Pending — MiRealSource-MiMLS
- 2023-04-21 Listed $184,900 MiRealSource-MiMLS
- 2023-04-21 Listed $184,900 REALCOMP
- 2015-05-28 Sold (Public Records) $111,000 Public Records
- 2015-05-08 Sold (MLS) $111,000 MiRealSource-MiMLS
- 2015-05-08 Sold (MLS) $111,000 REALCOMP
- 2015-03-10 Listing Removed — MiRealSource-MiMLS
- 2015-03-01 Listed $114,900 MiRealSource-MiMLS
- 2015-03-01 Listed $114,900 REALCOMP
- 2010-04-13 Sold (MLS) $82,500 MiRealSource-MiMLS
- 2010-04-13 Sold (MLS) $82,500 MiRealSource-MiMLS
- 2010-04-13 Sold (MLS) $82,500 REALCOMP
- 2010-02-26 Listing Removed — MiRealSource-MiMLS
- 2010-02-05 Listed $85,500 MiRealSource-MiMLS
- 2010-02-05 Listed $85,500 MiRealSource-MiMLS
- 2010-02-05 Listed $85,500 REALCOMP
- 2004-12-10 Sold (Public Records) $144,900 Public Records
- 2004-12-07 Listing Removed — MiRealSource-MiMLS
- 2004-05-07 Listed $144,900 MiRealSource-MiMLS
Property tax history
+0.9%/yrLatest (2025): $1,956 · -45.9% YoY. Source: county tax records.
Cash-flow waterfall
monthlySold comps — $/sqft
last 12 mo · ≤1 miLoading sold comps…