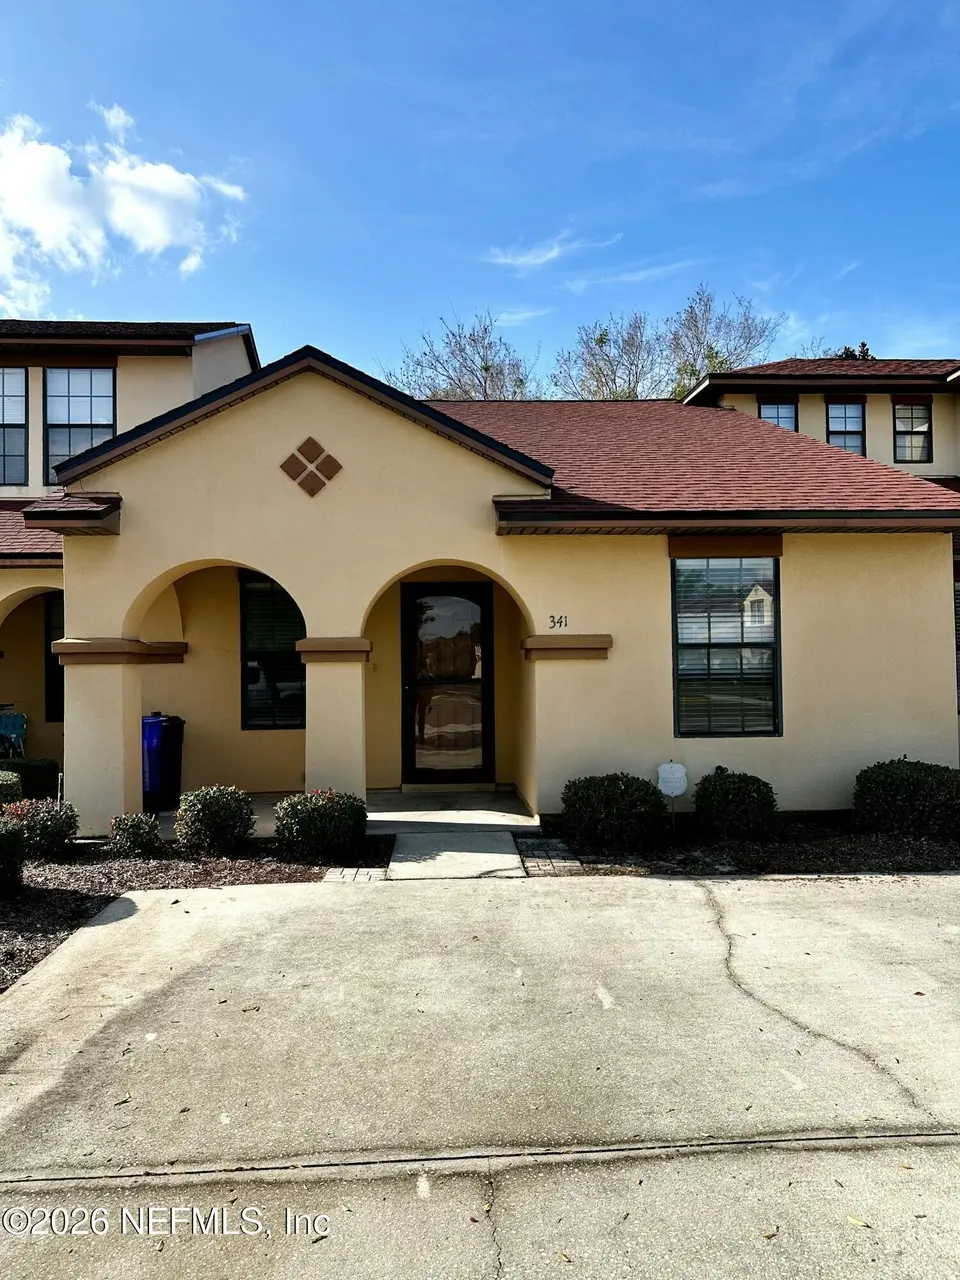
341 Redwood Ln · Fruit Cove, FL
Flood risk 1/10 · Minimal
- FEMA flood zone
- X (unshaded)
- Chance of flooding over 30 yrs
- 0.0%
- Est. flood insurance / yr
- $507 – $1,088
Fire risk 5/10 · Moderate
- Est. fire insurance / yr
- $947 – $1,759
Heat risk 9/10 · Severe
- Hot days now (above 107°F)
- 7 days/yr
- Hot days in 30 yrs
- 22 days/yr
Wind risk 9/10 · Severe
- Chance of severe wind over 30 yrs
- 99.0%
Air-quality risk 4/10 · Minor
- Unhealthy air days now
- 5 days/yr
- Unhealthy air days in 30 yrs
- 5 days/yr
Risk factors via First Street. Map © Google.
Why this score? — see what drove the D- grade
The composite is a weighted blend of 9 inputs, each scored 0–100. Each bar is that input's sub-score; the figure is the points it added to the 100-point composite (weight × sub-score).
- ARV discount +11.1/15.0
- Cash flow +7.2/30.0
- Schools +6.4/10.0
- 1% rule +3.9/10.0
- Livability +3.5/5.0
- Rent growth +2.5/5.0
- Condition / age +2.5/5.0
- DSCR +1.4/10.0
- Appreciation +0.0/10.0
$220,000
🖨 Deal sheet 📄 Offer letter ✓ Due diligence
Listing remarks MLS
Don't wait on this well maintained townhome in a desirable area! The home is move-in ready, so no expenses after closing are necessary, unless you want to personalize the space to your preference. This is a gated community that is also associated with the greater Julington Plantation amenities. This home provides a covered front porch, as well as an open patio on the rear. The long driveway can host several vehicles for your personal or social needs. Wether you are looking for a personal space, or trying to build a rental portfolio, this is a home you should want to consider.
Key facts
- Gated community
- Covered front porch
- Open patio
Tags
Neighborhood map
What this means for you Summary
Snapshot
- This is a 2-bed/2.0-bath single-family listed at $220k.
Deal economics
- At list price, monthly cash flow is $-299 ($-4k/yr) — negative.
- To cash-flow at today's rent, offer at most $167k (24.0% below list).
- To meet the 1% rule (rent ≥ 1% of price), the offer needs to be $196k (10.7% below list).
- Recommended offer: $167k (24.0% below list) — sets the bar for cash-flow.
- Cap rate 4.7% vs local median 2.9% in Fruit Cove — top-decile yield for the area; either an underpriced asset or a hidden risk that comps aren't pricing in. Stress-test before assuming the spread holds.
Location & tenants
- Location reads 69/100 on livability (#469 in FL) — a middle-class / working-renter tenant base. Strengths: schools A+, crime A+, employment A+; Watch: amenities F, commute F, cost of living F.
- St. Johns (rural): math 75% / reading 73% proficiency, ranked #2 of 73 in FL (top 3%) — strong family-tenant draw, lease renewals of 3-5y typical; only 20% free/reduced lunch — higher-income household profile.
- Market conditions: Rents flat; 762 active listings in the ZIP; 6 comparable units currently listed for rent nearby; rentals at typical pace (median 21d on market — plan ~3-4 weeks tenant-placement turnaround); high-income renter base; 5,575 units permitted in St. Johns County in 2024 (584 in 5+ unit buildings).
- This rent is only 16% of the median local income ($151k/yr) — well below the 30% rent-burden line; pricing power to push rent on renewal without tenant pushback.
Forward outlook
- Local home prices are declining (-3.0%/yr); year-one equity from $2k of loan paydown is wiped out by about $7k of value loss. Plan a longer hold.
- St. Johns County population projected at +60% by 2050 — long-run rental-demand tailwind backs the buy-and-hold thesis.
Negotiation context
- It's been on market 153 days — a 12% lower offer ($194k) is reasonable based on typical stale-listing flexibility.
- 3 sale attempts since 2y ago; this cycle's ask has dropped $20k (8%) from the opening price — seller is motivated, your offer sets the floor, not the list.
- Current owner paid $142k; list at $220k implies a 55% gain — meaningful room to come down on a strong offer.
Risks & watch-outs
- Climate carrying-cost: severe wind risk, 99% chance of damaging wind over 30y; moderate wildfire risk; extreme-heat days projected 7→22/yr by 2055 (HVAC capex compounding) — expect insurance premiums to compound above CPI over the hold.
Questions for the listing agent
- What do current leases actually rent for vs. the listed asking? Can we see a recent rent roll and the last 12 months of T-12 income?
- It's been on market 153 days. Have you received any prior offers? Is the seller open to a 24% concession, seller financing, or rate buy-down credit?
- What does the HOA fee cover, when was the last increase, and are there any pending special assessments or reserve-fund shortfalls?
- Why hasn't it sold? Are there any deal-killer items the seller is aware of (foundation, flood, title, zoning, code violations)?
- Is there a deadline driving the sale (1031 exchange, divorce, estate, relocation)? That informs how much negotiation room exists.
- Schools are A-rated — typically a magnet for longer-tenancy family renters. What's the average tenant stay here, and is there a school-zone premium baked into asking?
- The area grade is low — what's the realistic commute time and amenity access for the typical tenant pool here? Any planned neighborhood developments (good or bad) we should know about?
- What's the average days-on-market for RENTAL listings here right now (not sales)? A rising rental-DOM trend means longer vacancies and softer asking-rent achievability than the comps imply.
- What's the recent tenant-quality profile in this submarket — average credit score on applications, eviction rate, late-payment / NSF rate, and stable-employment percentage? A property-management company in the area should have these aggregated.
- How much new for-sale + rental construction is in the pipeline within 1–3 miles? Heavy new supply typically softens prices + rents 12–24 months out; constrained supply supports both.
Investment metrics
- 1% rule
- 0.89% ✗
- Cap rate
- 4.66%
- Cash-on-cash
- -5.83%
- DSCR
- 0.74
- GRM
- 9.3
CMA / ARV
- ARV (median comp)
- $239,272
- List price
- $220,000
- Delta
- -8.05%
- Verdict
- FAIR
- Comps
- 20 within 1.0 mi
Show comp detail 1 sale within ~0.75 mi
| Address | Dist | Beds/Ba | Sqft | Sold | Price | $/sf | Match |
|---|---|---|---|---|---|---|---|
| 705 S Covered Bridge Rd #4 | 0.37mi | 3/2.0 (+1) | 1,155 (+15%) | 7mo | $277,000 | $240 | 48 |
Match score weights: distance 35% · size 25% · config 20% · recency 20%. Top-matched comps best support the ARV.
Projected returns pro-forma
-3.0% appreciation · 0.0% rent growth · sell at horizon
- IRR
- -30.5%
- Equity multiple
- 0.02×
- Total profit
- $-60,225
- Equity at exit
- $32,803
- IRR
- -59.3%
- Equity multiple
- -0.60×
- Total profit
- $-98,279
- Equity at exit
- $19,022
Cash invested: $61,600 (down + closing). Projections, not guarantees.
Landlord ↔ Tenant lean methodology
- Overall (STATE)
- 87 Strongly Landlord-Friendly
- State Florida
- 87 Strongly Landlord-Friendly · R+3
- County
- — inherits STATE
- City
- — inherits STATE
ZIP-level market 32259
- Home prices YoY
- -28.8%
- Rents YoY
- 0.0%
- Active inventory
- 762
- Price-to-rent
- 9.3×
Monthly cashflow live
- Estimated rent
- $1,965 high interval (Pro) →
- Mortgage (P&I)
- −$1,154
- Tax from tax record
- −$298 /mo · $3,576/yr
- Insurance
- −$92
- HOA
- −$308
- Vacancy / Maint / Mgmt
- −$413
- Net cashflow
- $-299
Break-even live
UW: 25.0% down · 7.5% · 30yr · 1.5% tax · 5.0% vac · 8.0% maint · 8.0% mgmt
Financing live
Cash to close
- Down payment
- $55,000
- Closing costs
- $6,600
- Reserves months
- —
- Total cash needed
- —
Loan-product check · same deal, 3 products live
Conventional
25% down · 7.5% · 30yr
- Down + closing
- —
- Monthly P&I
- —
- Monthly cashflow
- —
- DSCR
- —
- Eligible?
- —
Personal DTI + credit; lowest rate.
DSCR
20% down · 8.5% · 30yr
- Down + closing
- —
- Monthly P&I
- —
- Monthly cashflow
- —
- DSCR
- —
- Eligible?
- —
No personal income docs; deal must DSCR.
Hard money
10% down · 12.0% · 12mo
- Down + closing
- —
- Monthly P&I
- —
- Monthly cashflow
- —
- DSCR
- —
- Eligible?
- —
Short-term bridge; refi at stabilization.
Rent comps 6 comps
| Address | Beds | Baths | Sqft | Rent | $/sqft | DOM | Units | Dist |
|---|---|---|---|---|---|---|---|---|
| 416 Honeycomb Way Saint Johns, FL | 2.0 | 2.5 | 1500 | $1,995 | $1.33 | 23d | 1 | 0.13mi |
| 729 Middle Branch Way Saint Johns, FL | 2.0 | 3.0 | 1104 | $1,650 | $1.49 | 23d | 1 | 0.18mi |
| 155 Southern Bridge Blvd #6 Saint Johns, FL | 3.0 | 2.0 | 1144 | $1,950 | $1.70 | 14d | 1 | 0.32mi |
| 155 Southern Bridge Blvd #4 Saint Johns, FL | 3.0 | 2.5 | 1500 | $1,950 | $1.30 | 1d | 1 | 0.32mi |
| 908 Buttercup Dr Saint Johns, FL | 3.0 | 2.0 | 1253 | $2,400 | $1.92 | 14d | 1 | 0.37mi |
| 505 S Steel Bridge Rd #2 Saint Johns, FL | 3.0 | 2.5 | 1460 | $2,000 | $1.37 | 21d | 1 | 0.38mi |
HOA detail
- Monthly dues
- $308 · $3,696/yr
- Likely covers
- security
Listing history 22 events
-
2026-06-18days on market $220,000 Active 153 DOM
-
2026-06-17days on market $220,000 Active 152 DOM
-
2026-06-16days on market $220,000 Active 151 DOM
-
2026-06-15days on market $220,000 Active 150 DOM
-
2026-06-13days on market $220,000 Active 148 DOM
-
2026-06-13days on market $220,000 Active 147 DOM
-
2026-06-10days on market $220,000 Active 144 DOM
-
2026-06-08days on market $220,000 Active 143 DOM
-
2026-06-07days on market $220,000 Active 142 DOM
-
2026-06-03days on market $220,000 Active 138 DOM
-
2026-06-02days on market $220,000 Active 137 DOM
-
2026-06-01days on market $220,000 Active 136 DOM
-
2026-05-31days on market $220,000 Active 135 DOM
-
2026-05-01status Active 582-char remark
Show marketing remark (582 chars)
Don't wait on this well maintained townhome in a desirable area! The home is move-in ready, so no expenses after closing are necessary, unless you want to personalize the space to your preference. This is a gated community that is also associated with the greater Julington Plantation amenities. This home provides a covered front porch, as well as an open patio on the rear. The long driveway can host several vehicles for your personal or social needs. Wether you are looking for a personal space, or trying to build a rental portfolio, this is a home you should want to consider.
-
2026-04-30historical 582-char remark
Show marketing remark (582 chars)
Don't wait on this well maintained townhome in a desirable area! The home is move-in ready, so no expenses after closing are necessary, unless you want to personalize the space to your preference. This is a gated community that is also associated with the greater Julington Plantation amenities. This home provides a covered front porch, as well as an open patio on the rear. The long driveway can host several vehicles for your personal or social needs. Wether you are looking for a personal space, or trying to build a rental portfolio, this is a home you should want to consider.
-
2026-04-22price $229,500 582-char remark
Show marketing remark (582 chars)
Don't wait on this well maintained townhome in a desirable area! The home is move-in ready, so no expenses after closing are necessary, unless you want to personalize the space to your preference. This is a gated community that is also associated with the greater Julington Plantation amenities. This home provides a covered front porch, as well as an open patio on the rear. The long driveway can host several vehicles for your personal or social needs. Wether you are looking for a personal space, or trying to build a rental portfolio, this is a home you should want to consider.
-
2026-03-03price $235,000 582-char remark
Show marketing remark (582 chars)
Don't wait on this well maintained townhome in a desirable area! The home is move-in ready, so no expenses after closing are necessary, unless you want to personalize the space to your preference. This is a gated community that is also associated with the greater Julington Plantation amenities. This home provides a covered front porch, as well as an open patio on the rear. The long driveway can host several vehicles for your personal or social needs. Wether you are looking for a personal space, or trying to build a rental portfolio, this is a home you should want to consider.
-
2026-01-15$240,000 Active 582-char remark
Show marketing remark (582 chars)
Don't wait on this well maintained townhome in a desirable area! The home is move-in ready, so no expenses after closing are necessary, unless you want to personalize the space to your preference. This is a gated community that is also associated with the greater Julington Plantation amenities. This home provides a covered front porch, as well as an open patio on the rear. The long driveway can host several vehicles for your personal or social needs. Wether you are looking for a personal space, or trying to build a rental portfolio, this is a home you should want to consider.
-
2024-12-09historical $1,550
-
2024-10-23$1,550
-
2005-06-15soldstatus $142,000
-
2004-04-19soldstatus $452,500
ⓘ Source: listings_history table (triggers on properties + properties_extension) + one-shot
backfill from property_details.listing_events for pre-trigger history.
Tax reassessment forecast FL · Resets to sale price
- Current annual tax
- $3,576 · $298/mo
- Projected year-2 tax
- $3,576 · $298/mo
- Expected delta
- $0/yr ($0/mo · -0.0%)
ⓘ Screening estimate from a state-policy table — verify with the county assessor before closing.
Climate risk First Street
- Flood 1/10 Low FEMA zone X (unshaded) · 0% chance over 30 yrs
- Wildfire 5/10 Major
- Heat 9/10 Extreme 7 d/yr ≥107°F today · 22 d/yr by 30 yrs out
- Wind 9/10 Extreme 99% chance of damaging wind over 30 yrs
- Air quality 4/10 Moderate 5 unhealthy d/yr today · 5 by 30 yrs out
Nearby sold comps map
Loading sold comps map…
Walkable amenities ~0.75 mi
Loading nearby amenities…
Taxation est. · year 1
- Rental income
- $23,578
- − Mortgage interest
- −$12,323
- − Property taxes
- −$3,576
- − Insurance
- −$1,100
- − Repairs & maintenance
- −$1,886
- − Management
- −$1,886
- − HOA
- −$3,696
- − Depreciation
- −$6,400
- Taxable loss
- −$7,289
- Est. tax savings @ 24.0%
- +$1,749
- After-tax cash flow
- $-1,840/yr
For passive investors: Depreciation is non-cash, so a rental often shows a tax loss while cash-flowing — sheltering income. Rental losses are passive: they offset passive income freely, and up to $25,000/yr can offset ordinary (W-2) income if you actively participate and your MAGI is under $100k (phasing out to $0 by $150k); unused losses carry forward. On sale, claimed depreciation is recaptured at up to 25%, and gains may owe capital-gains tax (a 1031 exchange can defer both). Figures are a year-1 estimate at your 24.0% rate — not tax advice; consult a CPA.
Schools (NCES district)
- District
- St. Johns
- NCES district ID
- 1201740
- Math proficiency
- 75% ▼ -5.00%
- Reading proficiency
- 73% ▼ -2.00%
- Median HH income
- $66,842
- Composite
- 64.31/100
- National rank
- #556
- State rank
- #2 of 73 in FL
Livability — Fruit Cove
- Score
- 69/100
- State rank
- #469
- US rank
- #8490
Category grades
Schools grade is shown separately in the Schools card above.
Census & demographics
- Census place
- Fruit Cove, FL
- County
- Saint Johns County · 301,599 people
- Metro
- Jacksonville, FL
- Population (ZIP)
- 75,016
- Household income
- $150,736
- Rent vs Own
- Severe rent burden
- 727.0
Population outlook (St. Johns County) Hauer SSP2
- Today (2025)
- 303,941 people
- By 2030
- 342,590 · +12.7%
- By 2040
- 417,328 · +37.3%
- By 2050
- 487,011 · +60.2%
- By 2075
- 635,395 · +109.1%
- By 2100
- 717,469 · +136.1%
Race, ethnicity, and origin ACS 2023
- Neighborhood character
- Predominantly White (73%)
- Race & ethnicity
- White 73% Two or more races 11% Hispanic / Latino 9% Black 6% Asian 6%
- Hispanic origin (detail)
- Puerto Rican 2% Cuban 1%
- Common ancestry
- Romanian 2% Lithuanian 2% Slovak 2%
- Foreign-born
- 13% · Canada, Jamaica, China
- Languages at home
- 86% English-only · Spanish 5% Other Indo-European 4% Other Asian/Pacific 2%
Political lean MEDSL · St. Johns
- 2024 margin
- Solid R (+31.4) · D 33.9% · R 65.2%
- 2008→2024 swing
- +0.2pp no change · 2008: -31.6pp · 2024: -31.4pp
- All cycles
- 2024: R+31.4 2020: R+26.7 2016: R+33.4 2012: R+37.8 2008: R+31.6
Not yet ingested
- Civics
- —
Market trends
- HPI YoY
- ▼ -105.54%
- Current HPI
- 261.2552
- Rent YoY
- ▬ 0.00%
- Metro
- Jacksonville, FL
- State GDP YoY
- ▲ 3.28%
- F500 in state
- 36
Industry mix (Fortune 500 HQ in FL)
| Industry | F500 HQs | Revenue |
|---|---|---|
| Industrial Technology | 2 | $29B |
|
||
| Insurance | 2 | $17B |
|
||
| Retail | 1 | $60B |
|
||
| Technology Distribution | 1 | $58B |
|
||
| Homebuilding | 1 | $35B |
|
||
| Technology Manufacturing | 1 | $35B |
|
||
Price history
-49.3% since first listed9 events — show timeline
- 2026-05-01 Relisted — realMLS
- 2026-04-30 Listing Removed — realMLS
- 2026-04-22 Price Changed $229,500 realMLS
- 2026-03-03 Price Changed $235,000 realMLS
- 2026-01-15 Listed $240,000 realMLS
- 2024-12-09 Rental Removed $1,550 NEFLMLS
- 2024-10-23 Listed for Rent $1,550 NEFLMLS
- 2005-06-15 Sold (Public Records) $142,000 Public Records
- 2004-04-19 Sold (Public Records) $452,500 Public Records
Property tax history
+6.5%/yrLatest (2025): $3,576 · +10.6% YoY. Source: county tax records.
Cash-flow waterfall
monthlySold comps — $/sqft
last 12 mo · ≤1 miLoading sold comps…