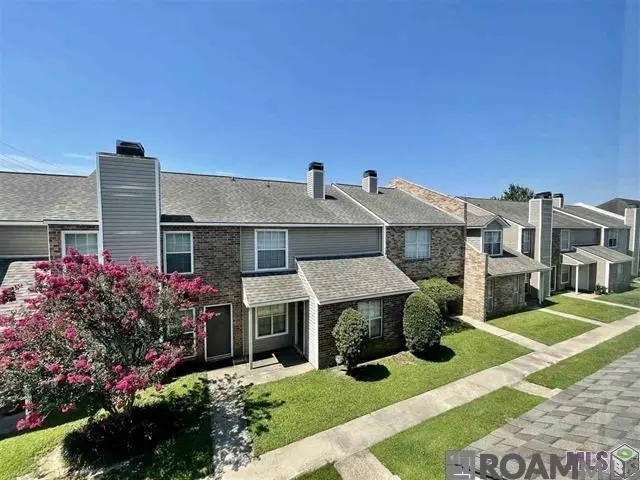
6212 Stumberg Ln #202 · Baton Rouge, LA
Flood risk 1/10 · Minimal
- FEMA flood zone
- X
- Chance of flooding over 30 yrs
- 0.0%
- Est. flood insurance / yr
- $507 – $1,088
Fire risk 1/10 · Minimal
- Est. fire insurance / yr
- $1,269 – $2,357
Heat risk 8/10 · Major
- Hot days now (above 108°F)
- 7 days/yr
- Hot days in 30 yrs
- 21 days/yr
Wind risk 9/10 · Severe
- Chance of severe wind over 30 yrs
- 99.0%
Air-quality risk 3/10 · Minor
- Unhealthy air days now
- 2 days/yr
- Unhealthy air days in 30 yrs
- 3 days/yr
Risk factors via First Street. Map © Google.
Why this score? — see what drove the D- grade
The composite is a weighted blend of 9 inputs, each scored 0–100. Each bar is that input's sub-score; the figure is the points it added to the 100-point composite (weight × sub-score).
- ARV discount +12.7/15.0
- Cash flow +7.3/30.0
- 1% rule +5.5/10.0
- Livability +3.7/5.0
- Rent growth +2.5/5.0
- Condition / age +2.5/5.0
- Schools +2.4/10.0
- DSCR +1.5/10.0
- Appreciation +0.0/10.0
$129,000
🖨 Deal sheet (PDF) 📄 Offer letter ✓ Due diligence
Listing remarks MLS
Discover this beautifully located 2-bedroom, 2.5-bath condo right in the heart of the city. Featuring a charming kitchen complete with all appliances, a formal dining area, and abundant storage throughout, this home offers both comfort and functionality. The spacious living room boasts a cozy fireplace, plenty of natural light, and a versatile nook ideal for a home office or study space. Upstairs, you'll find two generously sized bedrooms, each with its own full bath, providing privacy and convenience. The property is currently tenant-occupied at $1,300 per month on a month-to-month lease, offering flexibility for investors or future owner-occupants alike.Residents enjoy access to community amenities including a clubhouse and swimming pool--perfect for relaxing during the summer months. Do not Disturb Tenant.
Key facts
- Versatile nook
- Charming kitchen
- Natural light
Tags
Neighborhood map
What this means for you Summary
Snapshot
- This is a 2-bed/2.5-bath condo listed at $129k.
Deal economics
- At list price, monthly cash flow is $-170 ($-2k/yr) — negative.
- To cash-flow at today's rent, offer at most $99k (23.3% below list).
- Meets the 1% rule at list price ($1k rent vs $129k).
- Recommended offer: $99k (23.3% below list) — sets the bar for cash-flow.
Location & tenants
- Location reads 74/100 on livability (#24 in LA, #4,535 nationally) — a middle-class / working-renter tenant base. Strengths: commute A+, cost of living A+, health & safety A+; Watch: amenities D, crime F, employment D-.
- East Baton Rouge Parish (urban): math 22% / reading 34% proficiency, ranked #47 of 98 in LA (top 48%) — low school quality limits family demand, transient renter base, plan for 1-2y turnover; 77% free/reduced lunch — lower-income household profile, screen leases tightly.
- Zoned schools: Parkview Elementary School (math 47% / reading 64%, grade C, #89 of 646 statewide, top 14%, 539 students, 68% FRL); Woodlawn Middle School (math 20% / reading 39%, grade F, #116 of 218 statewide, top 53%, 887 students, 69% FRL); Woodlawn High School (math 25% / reading 30%, grade F, #133 of 265 statewide, top 51%, 1,527 students, 62% FRL).
- Market conditions: Rents flat; 255 active listings in the ZIP; 16 comparable units currently listed for rent nearby; rentals lingering (median 46d on market — plan ~5-8 weeks vacancy on turnover, expect pricing pressure); 56% of comp listings sitting > 30 days — soft ceiling on asking rent; 2,252 units permitted in East Baton Rouge Parish in 2024 (440 in 5+ unit buildings).
Forward outlook
- Local home prices are declining (-3.0%/yr); year-one equity from $892 of loan paydown is wiped out by about $4k of value loss. Plan a longer hold.
- East Baton Rouge County population projected at +4% by 2050 — modest demand growth; plan on rents tracking national, not racing it.
Negotiation context
- It's been on market 79 days — a 6% lower offer ($121k) is reasonable based on typical stale-listing flexibility.
- 12 sale attempts since 24y ago with the ask held roughly flat each time — persistent listings suggest the price (not the market) is what's stuck; bring a comps-based counter.
Risks & watch-outs
- Watch-outs: HOA is 29% of rent.
- Climate carrying-cost: severe wind risk, 99% chance of damaging wind over 30y; extreme-heat days projected 7→21/yr by 2055 (HVAC capex compounding) — expect insurance premiums to compound above CPI over the hold.
Questions for the listing agent
- What do current leases actually rent for vs. the listed asking? Can we see a recent rent roll and the last 12 months of T-12 income?
- It's been on market 79 days. Have you received any prior offers? Is the seller open to a 23% concession, seller financing, or rate buy-down credit?
- What does the HOA fee cover, when was the last increase, and are there any pending special assessments or reserve-fund shortfalls?
- Any open or pending special assessments — roof, HVAC, plumbing, elevator, façade? What's the per-unit balance and payoff schedule, and is the seller paying it off at close or rolling it to the buyer?
- Why hasn't it sold? Are there any deal-killer items the seller is aware of (foundation, flood, title, zoning, code violations)?
- Is there a deadline driving the sale (1031 exchange, divorce, estate, relocation)? That informs how much negotiation room exists.
- Crime grade is F in this area — have there been break-ins, vandalism, or insurance claims at this property in the last 3 years? What carrier currently insures it and at what premium?
- The area grade is low — what's the realistic commute time and amenity access for the typical tenant pool here? Any planned neighborhood developments (good or bad) we should know about?
- What's the average days-on-market for RENTAL listings here right now (not sales)? A rising rental-DOM trend means longer vacancies and softer asking-rent achievability than the comps imply.
- What's the recent tenant-quality profile in this submarket — average credit score on applications, eviction rate, late-payment / NSF rate, and stable-employment percentage? A property-management company in the area should have these aggregated.
- How much new apartment / multifamily construction is in the pipeline within 1–3 miles? Heavy new supply (>2% of stock underway) typically softens rents 12–24 months out; light construction supports rent growth.
Investment metrics
- 1% rule
- 1.05% ✓
- Cap rate
- 4.71%
- Cash-on-cash
- -5.66%
- DSCR
- 0.75
- GRM
- 8.0
CMA / ARV
- ARV (median comp)
- $145,779
- List price
- $129,000
- Delta
- -11.51%
- Verdict
- UNDERPRICED
- Comps
- 20 within 1.0 mi
Projected returns pro-forma
-3.0% appreciation · 0.16% rent growth · sell at horizon
- IRR
- -30.5%
- Equity multiple
- 0.02×
- Total profit
- $-35,273
- Equity at exit
- $19,234
- IRR
- -63.0%
- Equity multiple
- -0.61×
- Total profit
- $-58,293
- Equity at exit
- $11,154
Cash invested: $36,120 (down + closing). Projections, not guarantees.
Landlord ↔ Tenant lean methodology
- Overall (STATE)
- 90 Strongly Landlord-Friendly
- State Louisiana
- 90 Strongly Landlord-Friendly · R+12
- County
- — inherits STATE
- City
- — inherits STATE
ZIP-level market 70816
- Rents YoY
- 0.2%
- Active inventory
- 255
- Price-to-rent
- 8.0×
Monthly cashflow live
- Estimated rent
- $1,351 high interval (Pro) →
- Mortgage (P&I)
- −$676
- Tax from tax record
- −$117 /mo · $1,410/yr
- Insurance
- −$54
- HOA
- −$390
- Vacancy / Maint / Mgmt
- −$284
- Net cashflow
- $-170
Break-even live
Sensitivity live
| Price | -10% $-97 | -5% $-134 | +0% $-170 | +5% $-207 | +10% $-243 |
|---|---|---|---|---|---|
| Rent | -10% $-277 | -5% $-224 | +0% $-170 | +5% $-117 | +10% $-64 |
| Rate | -1.0pp $-105 | -0.5pp $-138 | base $-170 | +0.5pp $-204 | +1.0pp $-238 |
UW: 25.0% down · 7.5% · 30yr · 1.5% tax · 5.0% vac · 8.0% maint · 8.0% mgmt
Financing live
Cash to close
- Down payment
- $32,250
- Closing costs
- $3,870
- Reserves months
- —
- Total cash needed
- —
Loan-product check · same deal, 3 products live
Conventional
25% down · 7.5% · 30yr
- Down + closing
- —
- Monthly P&I
- —
- Monthly cashflow
- —
- DSCR
- —
- Eligible?
- —
Personal DTI + credit; lowest rate.
DSCR
20% down · 8.5% · 30yr
- Down + closing
- —
- Monthly P&I
- —
- Monthly cashflow
- —
- DSCR
- —
- Eligible?
- —
No personal income docs; deal must DSCR.
Hard money
10% down · 12.0% · 12mo
- Down + closing
- —
- Monthly P&I
- —
- Monthly cashflow
- —
- DSCR
- —
- Eligible?
- —
Short-term bridge; refi at stabilization.
Rent comps 16 comps
| Address | Beds | Baths | Sqft | Rent | $/sqft | DOM | Units | Dist |
|---|---|---|---|---|---|---|---|---|
| 6212 Stumberg Ln Baton Rouge, LA | 3.0 | 2.0 | 1424 | $1,500 | $1.05 | 45d | 1 | 0.04mi |
| 5159 S Oaks Dr Baton Rouge, LA | 2.0 | 2.5 | 1200 | $1,500 | $1.25 | 45d | 1 | 0.57mi |
| 12784 Brogdon Ln Unit 12784-H Baton Rouge, LA | 2.0 | 2.0 | 1100 | $1,100 | $1.00 | 45d | 1 | 0.62mi |
| 14020 Tiger Bend Rd Apt 4 Baton Rouge, LA | 2.0 | 1.5 | 1176 | $1,100 | $0.94 | 45d | 1 | 0.71mi |
| 14020 Tiger Bend Rd Apt 11 Baton Rouge, LA | 2.0 | 1.5 | 1176 | $1,100 | $0.94 | 25d | 1 | 0.72mi |
| 11850 Wentling Ave Baton Rouge, LA | 1.0–2.0 | 1.0–1.5 | 870 | $1,278 | $1.47 | 16d | 20 | 0.75mi |
| 12757 Coursey Blvd Baton Rouge, LA | 1.0–2.0 | 1.0–2.0 | 870 | $1,049 | $1.21 | 16d | 19 | 1.17mi |
| 12138 Coursey Blvd #1 Baton Rouge, LA | 2.0 | 1.5 | 1150 | $1,550 | $1.35 | 25d | 1 | 1.18mi |
| 4360 Stumberg Ln Baton Rouge, LA | 2.0 | 2.5 | 1100 | $1,300 | $1.18 | 45d | 1 | 1.26mi |
| 5960 Siegen Ln Baton Rouge, LA | 1.0–2.0 | 1.0–2.0 | 1006 | $1,386 | $1.38 | 16d | 8 | 1.29mi |
| 4138 Stumberg Ln Baton Rouge, LA | 3.0 | 2.0 | 1477 | $1,925 | $1.30 | 45d | 1 | 1.31mi |
| 4126 Stumberg Ln Baton Rouge, LA | 3.0 | 2.0 | 1480 | $2,150 | $1.45 | 16d | 1 | 1.31mi |
| 13675 Coursey Blvd Baton Rouge, LA | 1.0–3.0 | 1.0–2.0 | 951 | $1,130 | $1.19 | 45d | 23 | 1.35mi |
| 8028 Pine Valley Dr Baton Rouge, LA | 3.0 | 2.0 | 1124 | $2,100 | $1.87 | 45d | 1 | 1.42mi |
| 4747 Southpark Dr Baton Rouge, LA | 2.0 | 2.0 | 900 | $1,450 | $1.61 | 25d | 1 | 1.46mi |
| 4747 Southpark Dr Baton Rouge, LA | 2.0 | 2.0 | 840 | $1,450 | $1.73 | 45d | 1 | 1.46mi |
HOA detail condo
- Monthly dues
- $390 · $4,680/yr
- Likely covers
- pool
- Assessments
- None detected in remarks — confirm with the listing agent.
Listing history 42 events
-
2026-06-22days on market $129,000 Active 79 DOM
-
2026-06-18days on market $129,000 Active 76 DOM
-
2026-06-17days on market $129,000 Active 75 DOM
-
2026-06-16days on market $129,000 Active 74 DOM
-
2026-06-15days on market $129,000 Active 73 DOM
-
2026-06-14days on market $129,000 Active 71 DOM
-
2026-06-10days on market $129,000 Active 68 DOM
-
2026-06-09days on market $129,000 Active 67 DOM
-
2026-06-08days on market $129,000 Active 66 DOM
-
2026-06-07days on market $129,000 Active 65 DOM
-
2026-06-05days on market $129,000 Active 62 DOM
-
2026-06-03days on market $129,000 Active 61 DOM
-
2026-06-02days on market $129,000 Active 60 DOM
-
2026-06-01days on market $129,000 Active 59 DOM
-
2026-05-31days on market $129,000 Active 58 DOM
-
2026-05-31pricedays on market $129,000 Active 57 DOM
-
2026-04-03$135,000 Active 820-char remark
Show marketing remark (832 chars)
Discover this beautifully located 2-bedroom, 2.5-bath condo right in the heart of the city. Featuring a charming kitchen complete with all appliances, a formal dining area, and abundant storage throughout, this home offers both comfort and functionality. The spacious living room boasts a cozy fireplace, plenty of natural light, and a versatile nook ideal for a home office or study space. Upstairs, you’ll find two generously sized bedrooms, each with its own full bath, providing privacy and convenience. The property is currently tenant-occupied at $1,300 per month on a month-to-month lease, offering flexibility for investors or future owner-occupants alike. Residents enjoy access to community amenities including a clubhouse and swimming pool—perfect for relaxing during the summer months. Do not Disturb Tenant.
-
2026-04-03$135,000 Active 832-char remark
Show marketing remark (832 chars)
Discover this beautifully located 2-bedroom, 2.5-bath condo right in the heart of the city. Featuring a charming kitchen complete with all appliances, a formal dining area, and abundant storage throughout, this home offers both comfort and functionality. The spacious living room boasts a cozy fireplace, plenty of natural light, and a versatile nook ideal for a home office or study space. Upstairs, you’ll find two generously sized bedrooms, each with its own full bath, providing privacy and convenience. The property is currently tenant-occupied at $1,300 per month on a month-to-month lease, offering flexibility for investors or future owner-occupants alike. Residents enjoy access to community amenities including a clubhouse and swimming pool—perfect for relaxing during the summer months. Do not Disturb Tenant.
-
2025-06-11price $133,500
-
2025-06-11price $133,500
-
2025-04-04$135,000 Active
-
2025-04-04$135,000 Active
-
2023-11-17soldstatus
-
2023-08-05$1,300
-
2022-08-08soldstatus
-
2022-07-28$1,300
-
2021-11-11soldstatus
-
2021-10-21$1,275
-
2021-10-21soldstatus $121,000
-
2021-10-20soldstatus Sold
-
2021-08-13status Pending
-
2021-07-26price $125,000
-
2021-07-26status Active
-
2021-07-08status Pending
-
2021-06-16$129,500 Active
-
2021-06-16$125,000
-
2019-03-18soldstatus $99,999
-
2012-08-02soldstatus $116,000
-
2006-04-10soldstatus $91,500
-
2003-02-03soldstatus
-
2002-11-04$86,000
-
2002-11-04$86,000
ⓘ Source: listings_history table (triggers on properties + properties_extension) + one-shot
backfill from property_details.listing_events for pre-trigger history.
Tax reassessment forecast LA · Resets to sale price
- Current annual tax
- $1,410 · $117/mo
- Projected year-2 tax
- $1,410 · $117/mo
- Expected delta
- $0/yr ($0/mo · 0.0%)
ⓘ Screening estimate from a state-policy table — verify with the county assessor before closing.
Climate risk First Street
- Flood 1/10 Low FEMA zone X · 0% chance over 30 yrs
- Wildfire 1/10 Low
- Heat 8/10 Severe 7 d/yr ≥108°F today · 21 d/yr by 30 yrs out
- Wind 9/10 Extreme 99% chance of damaging wind over 30 yrs
- Air quality 3/10 Moderate 2 unhealthy d/yr today · 3 by 30 yrs out
Nearby sold comps map
Loading sold comps map…
Walkable amenities ~0.75 mi
Loading nearby amenities…
Taxation est. · year 1
- Rental income
- $16,214
- − Mortgage interest
- −$7,226
- − Property taxes
- −$1,410
- − Insurance
- −$645
- − Repairs & maintenance
- −$1,297
- − Management
- −$1,297
- − HOA
- −$4,680
- − Depreciation
- −$3,753
- Taxable loss
- −$4,094
- Est. tax savings @ 24.0%
- +$983
- After-tax cash flow
- $-1,061/yr
For passive investors: Depreciation is non-cash, so a rental often shows a tax loss while cash-flowing — sheltering income. Rental losses are passive: they offset passive income freely, and up to $25,000/yr can offset ordinary (W-2) income if you actively participate and your MAGI is under $100k (phasing out to $0 by $150k); unused losses carry forward. On sale, claimed depreciation is recaptured at up to 25%, and gains may owe capital-gains tax (a 1031 exchange can defer both). Figures are a year-1 estimate at your 24.0% rate — not tax advice; consult a CPA.
Schools (NCES district)
- District
- East Baton Rouge Parish
- NCES district ID
- 2200540
- Math proficiency
- 22% ▼ -36.00%
- Reading proficiency
- 34% ▼ -31.00%
- Median HH income
- $46,263
- Composite
- 24.14/100
- National rank
- #7745
- State rank
- #47 of 98 in LA
Livability — Baton Rouge
- Score
- 74/100
- State rank
- #24
- US rank
- #4535
Category grades
Schools grade is shown separately in the Schools card above.
Census & demographics
- Census place
- Baton Rouge, LA
- County
- East Baton Rouge Parish · 399,686 people
- City population
- 351,868
- Metro
- Baton Rouge, LA
- Population (ZIP)
- 45,718
- Household income
- $67,353
- Rent vs Own
- Severe rent burden
- 2162.0
Population outlook (East Baton Rouge County) Hauer SSP2
- Today (2025)
- 464,810 people
- By 2030
- 472,137 · +1.6%
- By 2040
- 480,243 · +3.3%
- By 2050
- 484,422 · +4.2%
- By 2075
- 492,069 · +5.9%
- By 2100
- 476,347 · +2.5%
Race, ethnicity, and origin ACS 2023
- Neighborhood character
- Diverse neighborhood (Simpson 0.67)
- Race & ethnicity
- Black 41% White 38% Hispanic / Latino 11% Two or more races 7% Asian 5%
- Hispanic origin (detail)
- Mexican 3%
- Common ancestry
- Lithuanian 7% Italian 1% Hispanic 1%
- Foreign-born
- 11% · Canada, China, Vietnam
- Languages at home
- 86% English-only · Spanish 9% Chinese 1% Other Indo-European 1%
Political lean MEDSL · East Baton Rouge
- 2024 margin
- D (+11.1) · D 54.5% · R 43.4% · Other 2.1%
- 2008→2024 swing
- +8.9pp toward D · 2008: 2.2pp · 2024: 11.1pp
- All cycles
- 2024: D+11.1 2020: D+13.1 2016: D+9.2 2012: D+5.2 2008: D+2.2
Not yet ingested
- Civics
- —
Market trends
- HPI YoY
- ▼ -161.21%
- Current HPI
- 157.3823
- Rent YoY
- ▲ 0.16%
- Metro
- Baton Rouge, LA
- State GDP YoY
- ▲ 3.29%
- F500 in state
- 10
Industry mix (Fortune 500 HQ in LA)
| Industry | F500 HQs | Revenue |
|---|---|---|
| Telecommunications | 2 | $23B |
|
||
| Utilities | 1 | $12B |
|
||
| Wholesale / Distribution | 1 | $5B |
|
||
| Advertising | 1 | $2B |
|
||
Price history
+57.0% since first listed26 events — show timeline
- 2026-04-03 Listed $135,000 GBRMLS
- 2026-04-03 Listed $135,000 AcadianaMLS
- 2025-06-11 Price Changed $133,500 AcadianaMLS
- 2025-06-11 Price Changed $133,500 GBRMLS
- 2025-04-04 Listed $135,000 GBRMLS
- 2025-04-04 Listed $135,000 AcadianaMLS
- 2023-11-17 Sold (MLS) — GBRMLS
- 2023-08-05 Listed $1,300 GBRMLS
- 2022-08-08 Sold (MLS) — GBRMLS
- 2022-07-28 Listed $1,300 GBRMLS
- 2021-11-11 Sold (MLS) — GBRMLS
- 2021-10-21 Sold (Public Records) $121,000 Public Records
- 2021-10-21 Listed $1,275 GBRMLS
- 2021-10-20 Sold (MLS) — GBRMLS
- 2021-08-13 Pending — GBRMLS
- 2021-07-26 Price Changed $125,000 GBRMLS
- 2021-07-26 Relisted — GBRMLS
- 2021-07-08 Pending — GBRMLS
- 2021-06-16 Listed $125,000 AcadianaMLS
- 2021-06-16 Listed $129,500 GBRMLS
- 2019-03-18 Sold (Public Records) $99,999 Public Records
- 2012-08-02 Sold (Public Records) $116,000 Public Records
- 2006-04-10 Sold (Public Records) $91,500 Public Records
- 2003-02-03 Sold (MLS) — GBRMLS
- 2002-11-04 Listed $86,000 AcadianaMLS
- 2002-11-04 Listed $86,000 GBRMLS
Property tax history
+10.2%/yrLatest (2025): $1,410 · +4.7% YoY. Source: county tax records.
Cash-flow waterfall
monthlySold comps — $/sqft
last 12 mo · ≤1 miLoading sold comps…