 🏷️ Likely Rental
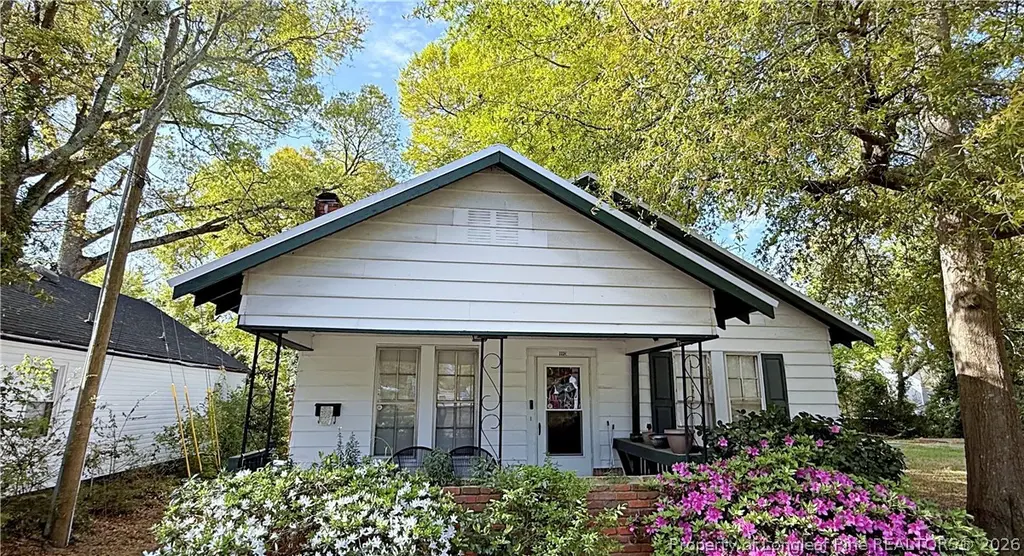
1113 Branson St · Fayetteville, NC
Flood risk 1/10 · Minimal
- FEMA flood zone
- X (unshaded)
- Chance of flooding over 30 yrs
- 0.0%
- Est. flood insurance / yr
- $507 – $1,088
Fire risk 4/10 · Minor
- Est. fire insurance / yr
- $906 – $1,684
Heat risk 7/10 · Major
- Hot days now (above 106°F)
- 7 days/yr
- Hot days in 30 yrs
- 16 days/yr
Wind risk 8/10 · Major
- Chance of severe wind over 30 yrs
- 80.0%
Air-quality risk 2/10 · Minimal
- Unhealthy air days now
- 0 days/yr
- Unhealthy air days in 30 yrs
- 1 days/yr
Risk factors via First Street. Map © Google.
Why this score? — see what drove the C- grade
The composite is a weighted blend of 9 inputs, each scored 0–100. Each bar is that input's sub-score; the figure is the points it added to the 100-point composite (weight × sub-score).
- ARV discount +15.0/15.0
- Cash flow +14.4/30.0
- DSCR +4.4/10.0
- Livability +3.8/5.0
- 1% rule +3.6/10.0
- Rent growth +3.5/5.0
- Schools +3.1/10.0
- Condition / age +2.5/5.0
- Appreciation +0.0/10.0
$149,000
🖨 Deal sheet (PDF) 📄 Offer letter ✓ Due diligence
Listing remarks
This is a great property with a tenant or month-to-month 2 bedrooms, 1 bath. 900 per month would be willing to stay, metal roof and 2017, hardwood floors, house is in good working order, aluminum siding. Showings only available during the week 430 to 6 or on the weekends. As is property no repairs to be made.
Key facts
- 6,098 sq ft lot
- Built 1937
- Listed 93 days
Property features AI
Exterior
- Parking: No garage
- Utilities: Public water; Public sewer
- Home design: Single family residence; Residential property; Interior lot; Cleared, level topography
- Construction: Aluminum siding; Crawl space foundation
- Exterior features: Front covered porch; Porch
Interior
- Kitchen: Laminate counters
- Bedrooms: Total rooms: 5
- Flooring: Hardwood; Tile
- Bathrooms: 1 full bathroom
- Heating & cooling: Ceiling fan(s); Central air
- Interior features: Ceiling fans; Crown molding; Laminate countertops
Neighborhood map
What this means for you Summary
Snapshot
- This is a 2-bed/1.0-bath single-family listed at $149k.
Deal economics
- At list price, monthly cash flow is $31 ($375/yr) — positive.
- The deal already cash-flows at list — no discount required.
- To meet the 1% rule (rent ≥ 1% of price), the offer needs to be $129k (13.6% below list).
- Recommended offer: $129k (13.6% below list) — sets the bar for 1% rule.
- Cap rate 6.5% vs local median 4.8% in Fayetteville — top-decile yield for the area; either an underpriced asset or a hidden risk that comps aren't pricing in. Stress-test before assuming the spread holds.
Location & tenants
- Location reads 75/100 on livability (#45 in NC, #4,031 nationally) — a middle-class / working-renter tenant base. Strengths: commute A+, cost of living A+, housing A+; Watch: crime F, employment D-.
- Cumberland County Schools (urban): math 32% / reading 41% proficiency, ranked #126 of 178 in NC (top 71%) — families likely to look elsewhere, expect single-tenant / working-renter base with shorter leases.
- Zoned schools: Vanstory Hills Elementary (math 46% / reading 50%, grade D, #477 of 1,410 statewide, top 35%, 469 students, 99% FRL); R Max Abbott Middle (math 31% / reading 45%, grade F, #251 of 475 statewide, top 54%, 759 students, 99% FRL); Terry Sanford High (math 49% / reading 52%, grade D+, #306 of 535 statewide, top 57%, 1,224 students, 59% FRL) — zoned schools average 86% FRL vs 55% district-wide (31 pts higher); higher-poverty schools than district average — tighter screening recommended.
- Market conditions: Rents rising (+4.0%/yr); 104 active listings in the ZIP; 40 comparable units currently listed for rent nearby; rentals at typical pace (median 25d on market — plan ~3-4 weeks tenant-placement turnaround); solid renter incomes; 1,125 units permitted in Cumberland County in 2024 (104 in 5+ unit buildings).
Forward outlook
- Local home prices are declining (-3.0%/yr); year-one equity from $1k of loan paydown is wiped out by about $4k of value loss. Plan a longer hold.
Negotiation context
- It's been on market 93 days — a 9% lower offer ($136k) is reasonable based on typical stale-listing flexibility.
- Current owner paid $25k; list at $149k implies a 496% gain — meaningful room to come down on a strong offer.
Risks & watch-outs
- Watch-outs: built in 1937 — expect roof / HVAC / electrical / plumbing capex.
- Climate carrying-cost: severe wind risk, 80% chance of damaging wind over 30y; extreme-heat days projected 7→16/yr by 2055 (HVAC capex compounding) — expect insurance premiums to compound above CPI over the hold.
Questions for the listing agent
- It's been on market 93 days. Have you received any prior offers? Is the seller open to a 14% concession, seller financing, or rate buy-down credit?
- Built in 1937 — when were the roof, HVAC, electrical panel, plumbing, and water heater last replaced?
- Why hasn't it sold? Are there any deal-killer items the seller is aware of (foundation, flood, title, zoning, code violations)?
- Is there a deadline driving the sale (1031 exchange, divorce, estate, relocation)? That informs how much negotiation room exists.
- Crime grade is F in this area — have there been break-ins, vandalism, or insurance claims at this property in the last 3 years? What carrier currently insures it and at what premium?
- What's the average days-on-market for RENTAL listings here right now (not sales)? A rising rental-DOM trend means longer vacancies and softer asking-rent achievability than the comps imply.
- What's the recent tenant-quality profile in this submarket — average credit score on applications, eviction rate, late-payment / NSF rate, and stable-employment percentage? A property-management company in the area should have these aggregated.
- How much new for-sale + rental construction is in the pipeline within 1–3 miles? Heavy new supply typically softens prices + rents 12–24 months out; constrained supply supports both.
Investment metrics
- 1% rule
- 0.86% ✗
- Cap rate
- 6.54%
- Cash-on-cash
- 0.90%
- DSCR
- 1.04
- GRM
- 9.6
CMA / ARV
- ARV (on-the-fly)
- $218,520
- Comps found
- 12
Show comp detail 12 sales within ~0.75 mi
| Address | Dist | Beds/Ba | Sqft | Sold | Price | $/sf | Match |
|---|---|---|---|---|---|---|---|
| 310 Highland Ave | 0.05mi | 3/1.0 (+1) | 1,232 (+2%) | 2mo | $68,500 | $56 | 89 |
| 320 Valley Rd | 0.19mi | 3/2.5 (+1) | 1,162 (-4%) | 4mo | $323,000 | $278 | 69 |
| 1117 Turnpike Rd | 0.20mi | 3/2.0 (+1) | 1,260 (+4%) | 8mo | $200,000 | $159 | 69 |
| 1420 Summitt Ave | 0.64mi | 3/1.5 (+1) | 1,238 (+2%) | 5mo | $222,000 | $179 | 56 |
| 432 Rollingwood Cir | 0.70mi | 2/1.0 | 1,247 (+3%) | 9mo | $220,000 | $176 | 56 |
| 1003 Branson St | 0.15mi | 3/1.5 (+1) | 1,047 (-14%) | 12mo | $209,900 | $200 | 53 |
| 408 Rollingwood Cir | 0.67mi | 2/2.0 | 1,251 (+3%) | 21mo | $250,000 | $200 | 42 |
| 737 Italy St | 0.42mi | 3/1.5 (+1) | 1,100 (-9%) | 19mo | $120,000 | $109 | 42 |
| 414 Park Ave | 0.67mi | 3/1.5 (+1) | 1,106 (-9%) | 6mo | $200,000 | $181 | 42 |
| 447 Rollingwood Cir | 0.65mi | 2/1.0 | 1,314 (+8%) | 20mo | $236,000 | $180 | 39 |
| 704 Ellis St | 0.49mi | 3/2.0 (+1) | 1,356 (+12%) | 18mo | $234,900 | $173 | 34 |
| 201 Woodside Ave | 0.53mi | 3/3.0 (+1) | 1,059 (-13%) | 11mo | $245,000 | $231 | 32 |
Match score weights: distance 35% · size 25% · config 20% · recency 20%. Top-matched comps best support the ARV.
Projected returns pro-forma
-3.0% appreciation · 3.95% rent growth · sell at horizon
- IRR
- -13.9%
- Equity multiple
- 0.50×
- Total profit
- $-20,921
- Equity at exit
- $22,216
- IRR
- -3.6%
- Equity multiple
- 0.75×
- Total profit
- $-10,489
- Equity at exit
- $12,883
Cash invested: $41,720 (down + closing). Projections, not guarantees.
Landlord ↔ Tenant lean methodology
- Overall (STATE)
- 85 Strongly Landlord-Friendly
- State North Carolina
- 85 Strongly Landlord-Friendly · R+3
- County
- — inherits STATE
- City
- — inherits STATE
ZIP-level market 28305
- Home prices YoY
- -28.4%
- Rents YoY
- 4.0%
- Active inventory
- 104
- Price-to-rent
- 9.6×
Monthly cashflow live
- Estimated rent
- $1,288 high interval (Pro) →
- Mortgage (P&I)
- −$781
- Tax from tax record
- −$143 /mo · $1,713/yr
- Insurance
- −$62
- HOA
- −$0
- Vacancy / Maint / Mgmt
- −$270
- Net cashflow
- $31
Break-even live
Sensitivity live
| Price | -10% $116 | -5% $73 | +0% $31 | +5% $-11 | +10% $-53 |
|---|---|---|---|---|---|
| Rent | -10% $-71 | -5% $-20 | +0% $31 | +5% $82 | +10% $133 |
| Rate | -1.0pp $106 | -0.5pp $69 | base $31 | +0.5pp $-7 | +1.0pp $-47 |
UW: 25.0% down · 7.5% · 30yr · 1.5% tax · 5.0% vac · 8.0% maint · 8.0% mgmt
Financing live
Cash to close
- Down payment
- $37,250
- Closing costs
- $4,470
- Reserves months
- —
- Total cash needed
- —
Loan-product check · same deal, 3 products live
Conventional
25% down · 7.5% · 30yr
- Down + closing
- —
- Monthly P&I
- —
- Monthly cashflow
- —
- DSCR
- —
- Eligible?
- —
Personal DTI + credit; lowest rate.
DSCR
20% down · 8.5% · 30yr
- Down + closing
- —
- Monthly P&I
- —
- Monthly cashflow
- —
- DSCR
- —
- Eligible?
- —
No personal income docs; deal must DSCR.
Hard money
10% down · 12.0% · 12mo
- Down + closing
- —
- Monthly P&I
- —
- Monthly cashflow
- —
- DSCR
- —
- Eligible?
- —
Short-term bridge; refi at stabilization.
Rent comps 40 comps
| Address | Beds | Baths | Sqft | Rent | $/sqft | DOM | Units | Dist |
|---|---|---|---|---|---|---|---|---|
| 1106 Clark St Unit A Fayetteville, NC | 2.0 | 1.0 | 825 | $975 | $1.18 | 25d | 1 | 0.09mi |
| 322 Valley Rd Fayetteville, NC | 3.0 | 2.0 | 1328 | $1,650 | $1.24 | 15d | 1 | 0.24mi |
| 1406 Raeford Rd Fayetteville, NC | 2.0 | 2.0 | 1176 | $1,650 | $1.40 | 15d | 1 | 0.26mi |
| 1100 Clarendon St #402 Fayetteville, NC | 2.0 | 2.0 | 1073 | $1,400 | $1.30 | 23d | 1 | 0.34mi |
| 421 Cityview Ln Fayetteville, NC | 2.0 | 2.5 | 1050 | $1,700 | $1.62 | 25d | 1 | 0.34mi |
| 452 Cityview Ln Fayetteville, NC | 2.0 | 2.5 | 1088 | $1,200 | $1.10 | 25d | 1 | 0.35mi |
| 807 Branson St #2 Fayetteville, NC | 3.0 | 2.0 | 1304 | $1,350 | $1.04 | 25d | 1 | 0.35mi |
| 314 Bradford Ave Fayetteville, NC | 3.0 | 2.0 | 1000 | $1,380 | $1.38 | 25d | 1 | 0.36mi |
| 100 Bradford Ave Unit 4 Fayetteville, NC | 1.0 | 1.0 | 890 | $790 | $0.89 | 25d | 1 | 0.41mi |
| 1108 Norwood St Unit A Fayetteville, NC | 2.0 | 1.0 | 856 | $1,025 | $1.20 | 25d | 1 | 0.44mi |
| 718 Dwain Dr Fayetteville, NC | 3.0 | 1.0 | 962 | $1,250 | $1.30 | 25d | 1 | 0.45mi |
| 1021 W Rowan St Unit H Fayetteville, NC | 2.0 | 1.5 | 930 | $850 | $0.91 | 25d | 1 | 0.54mi |
| 1107 W Rowan St Unit 1111-3 Fayetteville, NC | 1.0 | 1.0 | 700 | $850 | $1.21 | 25d | 1 | 0.56mi |
| 1507 Westlawn Ave Fayetteville, NC | 2.0 | 2.0 | 1386 | $1,500 | $1.08 | 25d | 1 | 0.59mi |
| 211 Ellington St Fayetteville, NC | 2.0 | 1.5 | 1050 | $1,395 | $1.33 | 25d | 1 | 0.59mi |
| 501 Lambert St Fayetteville, NC | 2.0 | 2.0 | 1200 | $1,230 | $1.02 | 15d | 3 | 0.71mi |
| 318 Fairwood Ct Fayetteville, NC | 3.0 | 2.0 | 1126 | $1,550 | $1.38 | 25d | 1 | 0.79mi |
| 620 Forest Rd Fayetteville, NC | 2.0 | 1.0 | 1000 | $975 | $0.97 | 25d | 2 | 0.83mi |
| 1228 Woodland Dr Unit 1 Fayetteville, NC | 2.0 | 2.0 | 1465 | $1,595 | $1.09 | 15d | 1 | 0.86mi |
| 118 N Virginia Ave Fayetteville, NC | 1.0 | 1.0 | 800 | $800 | $1.00 | 25d | 1 | 0.86mi |
| 450 Hay St Fayetteville, NC | 1.0–2.0 | 1.0–2.0 | 799 | $1,745 | $2.18 | 15d | 3 | 0.90mi |
| 217 N Virginia Ave Fayetteville, NC | 1.0 | 1.0 | 800 | $850 | $1.06 | 25d | 1 | 0.95mi |
| 1918 Millan Dr Fayetteville, NC | 2.0 | 1.0 | 720 | $1,099 | $1.53 | 25d | 1 | 0.95mi |
| 1918 Millan Dr Unit A Fayetteville, NC | 1.0 | 1.0 | 720 | $1,099 | $1.53 | 25d | 1 | 0.95mi |
| 123 Pennmark Pl Fayetteville, NC | 2.0 | 2.5 | 1380 | $1,600 | $1.16 | 15d | 1 | 0.98mi |
| 104 Brett Ct Fayetteville, NC | 2.0 | 2.5 | 1210 | $1,400 | $1.16 | 23d | 1 | 0.98mi |
| 325 Hay St #306 Fayetteville, NC | 1.0 | 1.0 | 882 | $1,550 | $1.76 | 25d | 1 | 0.98mi |
| 159 Maxwell St Unit 200 Fayetteville, NC | 2.0 | 2.0 | 1000 | $1,450 | $1.45 | 25d | 1 | 0.99mi |
| 530 Pearl St Unit 1367379P Fayetteville, NC | 3.0 | 2.0 | 1194 | $3,577 | $3.00 | 15d | 1 | 1.08mi |
| 129 Franklin St Fayetteville, NC | 1.0 | 1.0 | 1100 | $1,100 | $1.00 | 15d | 1 | 1.08mi |
| 123 Anderson St Fayetteville, NC | 2.0 | 2.0 | 1500 | $1,800 | $1.20 | 25d | 1 | 1.10mi |
| 536 Pearl St Fayetteville, NC | 2.0 | 1.0 | 1101 | $1,349 | $1.23 | 15d | 1 | 1.10mi |
| 1319 Levy Dr Fayetteville, NC | 3.0 | 2.0 | 1428 | $1,700 | $1.19 | 15d | 1 | 1.11mi |
| 469 McBain Dr Fayetteville, NC | 2.0 | 1.0 | 858 | $1,000 | $1.17 | 25d | 1 | 1.12mi |
| 479 McBain Dr Fayetteville, NC | 2.0 | 1.0 | 858 | $1,200 | $1.40 | 25d | 1 | 1.13mi |
| 1401 Briarcliff Dr Unit B Fayetteville, NC | 1.0 | 1.0 | 1001 | $875 | $0.87 | 25d | 1 | 1.17mi |
| 1347 Levy Dr Fayetteville, NC | 3.0 | 1.0 | 999 | $1,000 | $1.00 | 25d | 1 | 1.17mi |
| 230 Pinecrest Dr Fayetteville, NC | 1.0 | 1.0 | 853 | $995 | $1.17 | 25d | 1 | 1.18mi |
| 600 Glenville Ave Fayetteville, NC | 2.0 | 1.5 | 1105 | $1,295 | $1.17 | 15d | 1 | 1.19mi |
| 2209 Morganton Rd Fayetteville, NC | 2.0 | 2.0 | 1163 | $1,317 | $1.13 | 15d | 7 | 1.22mi |
Listing history 18 events
-
2026-06-21days on market $149,000 Active 93 DOM
-
2026-06-18days on market $149,000 Active 90 DOM
-
2026-06-17days on market $149,000 Active 89 DOM
-
2026-06-16days on market $149,000 Active 88 DOM
-
2026-06-15days on market $149,000 Active 87 DOM
-
2026-06-14days on market $149,000 Active 85 DOM
-
2026-06-13days on market $149,000 Active 84 DOM
-
2026-06-10days on market $149,000 Active 82 DOM
-
2026-06-09days on market $149,000 Active 81 DOM
-
2026-06-08days on market $149,000 Active 80 DOM
-
2026-06-07days on market $149,000 Active 79 DOM
-
2026-06-03days on market $149,000 Active 75 DOM
-
2026-06-02days on market $149,000 Active 74 DOM
-
2026-06-01days on market $149,000 Active 73 DOM
-
2026-05-31days on market $149,000 Active 72 DOM
-
2026-05-30days on market $149,000 Active 71 DOM
-
2026-03-20$149,000 Active
-
2015-06-02soldstatus $25,000
ⓘ Source: listings_history table (triggers on properties + properties_extension) + one-shot
backfill from property_details.listing_events for pre-trigger history.
Tax reassessment forecast NC · Resets to sale price
- Current annual tax
- $1,713 · $143/mo
- Projected year-2 tax
- $1,713 · $143/mo
- Expected delta
- $0/yr ($0/mo · 0.0%)
ⓘ Screening estimate from a state-policy table — verify with the county assessor before closing.
Climate risk First Street
- Flood 1/10 Low FEMA zone X (unshaded) · 0% chance over 30 yrs
- Wildfire 4/10 Moderate
- Heat 7/10 Severe 7 d/yr ≥106°F today · 16 d/yr by 30 yrs out
- Wind 8/10 Severe 80% chance of damaging wind over 30 yrs
- Air quality 2/10 Low 0 unhealthy d/yr today · 1 by 30 yrs out
Nearby sold comps map
Loading sold comps map…
Walkable amenities ~0.75 mi
Loading nearby amenities…
Taxation est. · year 1
- Rental income
- $15,454
- − Mortgage interest
- −$8,346
- − Property taxes
- −$1,713
- − Insurance
- −$745
- − Repairs & maintenance
- −$1,236
- − Management
- −$1,236
- − Depreciation
- −$4,335
- Taxable loss
- −$2,157
- Est. tax savings @ 24.0%
- +$518
- After-tax cash flow
- $892/yr
For passive investors: Depreciation is non-cash, so a rental often shows a tax loss while cash-flowing — sheltering income. Rental losses are passive: they offset passive income freely, and up to $25,000/yr can offset ordinary (W-2) income if you actively participate and your MAGI is under $100k (phasing out to $0 by $150k); unused losses carry forward. On sale, claimed depreciation is recaptured at up to 25%, and gains may owe capital-gains tax (a 1031 exchange can defer both). Figures are a year-1 estimate at your 24.0% rate — not tax advice; consult a CPA.
Schools (NCES district)
- District
- Cumberland County Schools
- NCES district ID
- 3700011
- Math proficiency
- 32% ▼ -2.00%
- Reading proficiency
- 41% ▼ -1.00%
- Median HH income
- $44,168
- Composite
- 31.0/100
- National rank
- #6096
- State rank
- #126 of 178 in NC
Livability — Fayetteville
- Score
- 75/100
- State rank
- #45
- US rank
- #4031
Category grades
Schools grade is shown separately in the Schools card above.
Census & demographics
- Census place
- Fayetteville, NC
- County
- Cumberland County · 265,314 people
- City population
- 226,118
- Metro
- Fayetteville, NC
- Population (ZIP)
- 5,710
- Household income
- $78,148
- Rent vs Own
- Severe rent burden
- 344.0
Population outlook (Cumberland County) Hauer SSP2
- Today (2025)
- 330,855 people
- By 2030
- 333,523 · +0.8%
- By 2040
- 335,583 · +1.4%
- By 2050
- 335,325 · +1.4%
- By 2075
- 342,853 · +3.6%
- By 2100
- 340,698 · +3.0%
Race, ethnicity, and origin ACS 2023
- Neighborhood character
- Majority White (64%)
- Race & ethnicity
- White 64% Black 19% Hispanic / Latino 9% Two or more races 5% Asian 3%
- Hispanic origin (detail)
- Mexican 4% Puerto Rican 1% Dominican 2%
- Common ancestry
- Slovak 5% Serbian 3% Italian 2%
- Foreign-born
- 5% · Canada, South Korea
- Languages at home
- 89% English-only · Spanish 7% Tagalog/Filipino 1% Other Indo-European 1%
Political lean MEDSL · Cumberland
- 2024 margin
- D (+13.4) · D 56.1% · R 42.7% · Other 1.2%
- 2008→2024 swing
- -4.3pp toward R · 2008: 17.7pp · 2024: 13.4pp
- All cycles
- 2024: D+13.4 2020: D+16.6 2016: D+16.0 2012: D+19.7 2008: D+17.7
Not yet ingested
- Civics
- —
Market trends
- HPI YoY
- ▼ -90.32%
- Current HPI
- 227.8969
- Rent YoY
- ▲ 3.95%
- Metro
- Fayetteville, NC
- State GDP YoY
- ▲ 3.28%
- F500 in state
- 26
Industry mix (Fortune 500 HQ in NC)
| Industry | F500 HQs | Revenue |
|---|---|---|
| Financial Services | 2 | $213B |
|
||
| Retail | 2 | $95B |
|
||
| Industrial Conglomerate | 1 | $38B |
|
||
| Metals / Steel | 1 | $35B |
|
||
| Utilities | 1 | $30B |
|
||
| Industrial Machinery | 1 | $19B |
|
||
Price history
+496.0% since first listed2 events — show timeline
- 2026-03-20 Listed $149,000 LPRMLS
- 2015-06-02 Sold (Public Records) $25,000 Public Records
Property tax history
+8.7%/yrLatest (2025): $1,713 · +93.9% YoY. Source: county tax records.
Cash-flow waterfall
monthlySold comps — $/sqft
last 12 mo · ≤1 miLoading sold comps…