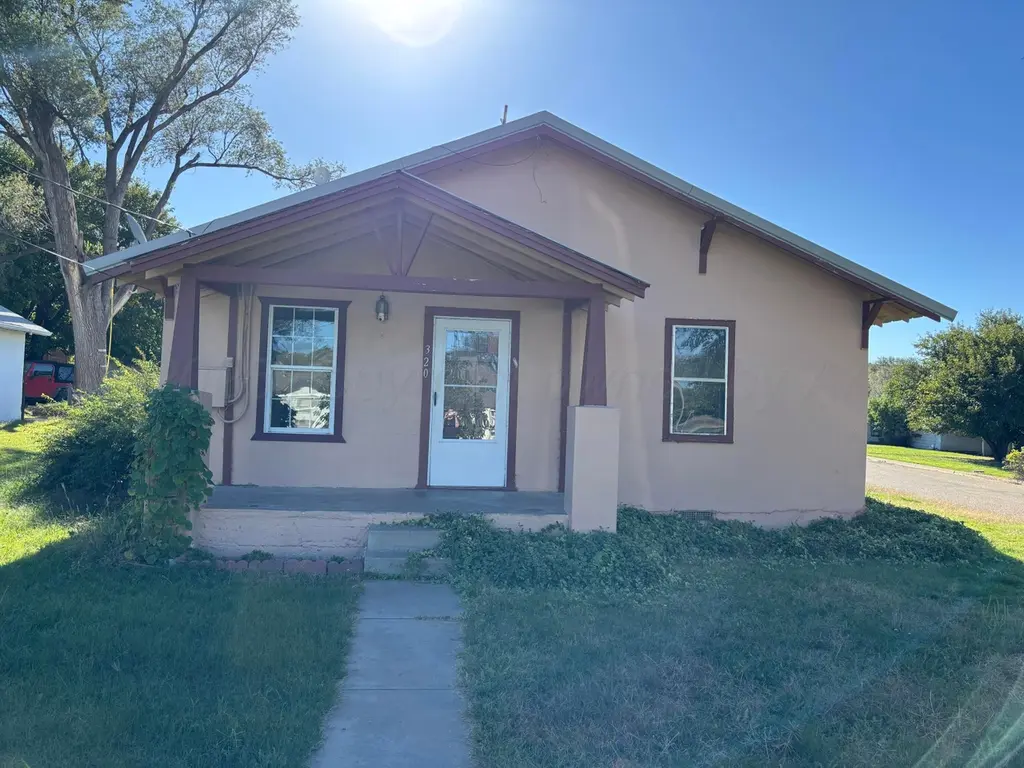
320 Summit St · Miami, TX
Flood risk 1/10 · Minimal
- FEMA flood zone
- —
- Chance of flooding over 30 yrs
- 0.0%
- Est. flood insurance / yr
- —
Fire risk 8/10 · Major
- Est. fire insurance / yr
- $1,222 – $2,270
Heat risk 5/10 · Moderate
- Hot days now (above 100°F)
- 7 days/yr
- Hot days in 30 yrs
- 20 days/yr
Wind risk 2/10 · Minimal
- Chance of severe wind over 30 yrs
- 0.0%
Air-quality risk 2/10 · Minimal
- Unhealthy air days now
- 1 days/yr
- Unhealthy air days in 30 yrs
- 1 days/yr
Risk factors via First Street. Map © Google.
Why this score? — see what drove the B- grade
The composite is a weighted blend of 9 inputs, each scored 0–100. Each bar is that input's sub-score; the figure is the points it added to the 100-point composite (weight × sub-score).
- Cash flow +26.0/30.0
- DSCR +8.8/10.0
- ARV discount +7.5/15.0
- 1% rule +6.4/10.0
- Appreciation +5.0/10.0
- Schools +4.2/10.0
- Livability +3.1/5.0
- Rent growth +2.5/5.0
- Condition / age +2.5/5.0
$77,700
🖨 Deal sheet 📄 Offer letter ✓ Due diligence
Listing remarks MLS
Charming 2-bedroom, 1-bath stucco home on a spacious corner lot! This property features an open-concept living room and kitchen with updated touches throughout. Fenced in area perfect for pets or outdoor living, plus a handy storage shed for tools and extras. A durable metal roof adds peace of mind. Great starter home or investment opportunity—move-in ready and full of potential!
Key facts
- Fenced in area
- Metal roof
- Storage shed
Tags
Neighborhood map
What this means for you Summary
Snapshot
- This is a 2-bed/1.0-bath single-family listed at $78k.
Deal economics
- At list price, monthly cash flow is $195 ($2k/yr) — positive.
- The deal already cash-flows at list — no discount required.
- Meets the 1% rule at list price ($888 rent vs $78k).
- Recommended offer: $68k (12.0% below list) — sets the bar for market timing.
Location & tenants
- Location reads 62/100 on livability (#945 in TX) — a middle-class / working-renter tenant base. Strengths: cost of living A+, employment B; Watch: crime F, amenities F, commute F.
- Miami ISD (rural): math 40% / reading 50% proficiency, ranked #479 of 1,141 in TX (top 42%) — families likely to look elsewhere, expect single-tenant / working-renter base with shorter leases.
- Market conditions: 9 active listings in the ZIP.
Forward outlook
- In year one you build about $3k of equity ($537 loan paydown + $2k appreciation (3.0% local appreciation)).
- Roberts County population projected at +9% by 2050 — modest demand growth; plan on rents tracking national, not racing it.
- At projected returns (3.0% appreciation + 3.0% rent growth), your $22k cash investment doubles in ~4 years — after that, you're playing with house money.
Negotiation context
- It's been on market 199 days — a 12% lower offer ($68k) is reasonable based on typical stale-listing flexibility.
Risks & watch-outs
- Watch-outs: built in 1950 — expect roof / HVAC / electrical / plumbing capex.
- Climate carrying-cost: severe wildfire risk; extreme-heat days projected 7→20/yr by 2055 (HVAC capex compounding) — expect insurance premiums to compound above CPI over the hold.
Questions for the listing agent
- It's been on market 199 days. Have you received any prior offers? Is the seller open to a 12% concession, seller financing, or rate buy-down credit?
- Built in 1950 — when were the roof, HVAC, electrical panel, plumbing, and water heater last replaced?
- Why hasn't it sold? Are there any deal-killer items the seller is aware of (foundation, flood, title, zoning, code violations)?
- Is there a deadline driving the sale (1031 exchange, divorce, estate, relocation)? That informs how much negotiation room exists.
- Crime grade is F in this area — have there been break-ins, vandalism, or insurance claims at this property in the last 3 years? What carrier currently insures it and at what premium?
- What's the average days-on-market for RENTAL listings here right now (not sales)? A rising rental-DOM trend means longer vacancies and softer asking-rent achievability than the comps imply.
- What's the recent tenant-quality profile in this submarket — average credit score on applications, eviction rate, late-payment / NSF rate, and stable-employment percentage? A property-management company in the area should have these aggregated.
- How much new for-sale + rental construction is in the pipeline within 1–3 miles? Heavy new supply typically softens prices + rents 12–24 months out; constrained supply supports both.
Investment metrics
- 1% rule
- 1.14% ✓
- Cap rate
- 9.30%
- Cash-on-cash
- 10.73%
- DSCR
- 1.48
- GRM
- 7.3
CMA / ARV
No comps found within radius.
Projected returns pro-forma
3.0% appreciation · 3.0% rent growth · sell at horizon
- IRR
- 17.5%
- Equity multiple
- 2.00×
- Total profit
- $21,744
- Equity at exit
- $34,937
- IRR
- 19.0%
- Equity multiple
- 3.76×
- Total profit
- $60,048
- Equity at exit
- $53,843
Cash invested: $21,756 (down + closing). Projections, not guarantees.
Landlord ↔ Tenant lean methodology
- Overall (STATE)
- 87 Strongly Landlord-Friendly
- State Texas
- 87 Strongly Landlord-Friendly · R+5
- County
- — inherits STATE
- City
- — inherits STATE
ZIP-level market 79059
- Active inventory
- 9
- Price-to-rent
- 7.3×
Monthly cashflow live
- Estimated rent
- $888 medium interval (Pro) →
- Mortgage (P&I)
- −$407
- Tax from tax record
- −$67 /mo · $803/yr
- Insurance
- −$32
- HOA
- −$0
- Vacancy / Maint / Mgmt
- −$186
- Net cashflow
- $195
Break-even live
UW: 25.0% down · 7.5% · 30yr · 1.5% tax · 5.0% vac · 8.0% maint · 8.0% mgmt
Financing live
Cash to close
- Down payment
- $19,425
- Closing costs
- $2,331
- Reserves months
- —
- Total cash needed
- —
Loan-product check · same deal, 3 products live
Conventional
25% down · 7.5% · 30yr
- Down + closing
- —
- Monthly P&I
- —
- Monthly cashflow
- —
- DSCR
- —
- Eligible?
- —
Personal DTI + credit; lowest rate.
DSCR
20% down · 8.5% · 30yr
- Down + closing
- —
- Monthly P&I
- —
- Monthly cashflow
- —
- DSCR
- —
- Eligible?
- —
No personal income docs; deal must DSCR.
Hard money
10% down · 12.0% · 12mo
- Down + closing
- —
- Monthly P&I
- —
- Monthly cashflow
- —
- DSCR
- —
- Eligible?
- —
Short-term bridge; refi at stabilization.
Listing history 17 events
-
2026-06-18days on market $77,700 Active 199 DOM
-
2026-06-17days on market $77,700 Active 198 DOM
-
2026-06-16days on market $77,700 Active 197 DOM
-
2026-06-15days on market $77,700 Active 196 DOM
-
2026-06-15days on market $77,700 Active 195 DOM
-
2026-06-13days on market $77,700 Active 194 DOM
-
2026-06-12days on market $77,700 Active 193 DOM
-
2026-06-10days on market $77,700 Active 190 DOM
-
2026-06-08days on market $77,700 Active 189 DOM
-
2026-06-08days on market $77,700 Active 188 DOM
-
2026-06-05days on market $77,700 Active 186 DOM
-
2026-06-03days on market $77,700 Active 184 DOM
-
2026-06-02days on market $77,700 Active 183 DOM
-
2026-06-01days on market $77,700 Active 182 DOM
-
2026-05-31days on market $77,700 Active 181 DOM
-
2026-02-03price $77,700 388-char remark
Show marketing remark (388 chars)
Charming 2-bedroom, 1-bath stucco home on a spacious corner lot! This property features an open-concept living room and kitchen with updated touches throughout. Fenced in area perfect for pets or outdoor living, plus a handy storage shed for tools and extras. A durable metal roof adds peace of mind. Great starter home or investment opportunity—move-in ready and full of potential!
-
2025-12-01$82,700 Active 388-char remark
Show marketing remark (388 chars)
Charming 2-bedroom, 1-bath stucco home on a spacious corner lot! This property features an open-concept living room and kitchen with updated touches throughout. Fenced in area perfect for pets or outdoor living, plus a handy storage shed for tools and extras. A durable metal roof adds peace of mind. Great starter home or investment opportunity—move-in ready and full of potential!
ⓘ Source: listings_history table (triggers on properties + properties_extension) + one-shot
backfill from property_details.listing_events for pre-trigger history.
Tax reassessment forecast TX · Resets to sale price
- Current annual tax
- $803 · $67/mo
- Projected year-2 tax
- $1,422 · $118/mo
- Expected delta
- +$619/yr (+$52/mo · 77.1%)
ⓘ Screening estimate from a state-policy table — verify with the county assessor before closing.
Climate risk First Street
- Flood 1/10 Low 0% chance over 30 yrs
- Wildfire 8/10 Severe
- Heat 5/10 Major 7 d/yr ≥100°F today · 20 d/yr by 30 yrs out
- Wind 2/10 Low 0% chance of damaging wind over 30 yrs
- Air quality 2/10 Low 1 unhealthy d/yr today · 1 by 30 yrs out
Nearby sold comps map
Loading sold comps map…
Walkable amenities ~0.75 mi
Loading nearby amenities…
Taxation est. · year 1
- Rental income
- $10,652
- − Mortgage interest
- −$4,352
- − Property taxes
- −$803
- − Insurance
- −$388
- − Repairs & maintenance
- −$852
- − Management
- −$852
- − Depreciation
- −$2,260
- Taxable income
- $1,144
- Est. tax owed @ 24.0%
- −$274
- After-tax cash flow
- $2,060/yr
For passive investors: Depreciation is non-cash, so a rental often shows a tax loss while cash-flowing — sheltering income. Rental losses are passive: they offset passive income freely, and up to $25,000/yr can offset ordinary (W-2) income if you actively participate and your MAGI is under $100k (phasing out to $0 by $150k); unused losses carry forward. On sale, claimed depreciation is recaptured at up to 25%, and gains may owe capital-gains tax (a 1031 exchange can defer both). Figures are a year-1 estimate at your 24.0% rate — not tax advice; consult a CPA.
Schools (NCES district)
- District
- Miami ISD
- NCES district ID
- 4830480
- Math proficiency
- 40% ▼ -15.00%
- Reading proficiency
- 50% ▼ -5.00%
- Median HH income
- $61,573
- Composite
- 41.95/100
- National rank
- #7103
- State rank
- #479 of 1141 in TX
Livability — Miami
- Score
- 62/100
- State rank
- #945
- US rank
- #16835
Category grades
Schools grade is shown separately in the Schools card above.
Census & demographics
- Census place
- Miami, TX
- Population (ZIP)
- 669
Population outlook (Roberts County) Hauer SSP2
- Today (2025)
- 977 people
- By 2030
- 984 · +0.7%
- By 2040
- 1,024 · +4.8%
- By 2050
- 1,063 · +8.8%
- By 2075
- 1,202 · +23.0%
- By 2100
- 1,289 · +31.9%
Race, ethnicity, and origin ACS 2023
- Neighborhood character
- Predominantly White (85%)
- Race & ethnicity
- White 85% Hispanic / Latino 12% Two or more races 3%
- Hispanic origin (detail)
- Mexican 11% Puerto Rican 1%
- Common ancestry
- Lithuanian 5% Iranian 4% European 2%
- Languages at home
- 96% English-only · Spanish 2% Other Indo-European 2%
Political lean MEDSL · Roberts
- 2024 margin
- Solid R (+92.5) · D 3.5% · R 96.0%
- 2008→2024 swing
- -8.3pp toward R · 2008: -84.2pp · 2024: -92.5pp
- All cycles
- 2024: R+92.5 2020: R+93.1 2016: R+91.6 2012: R+87.2 2008: R+84.2
Not yet ingested
- Civics
- —
Market trends
- HPI YoY
- —
- Current HPI
- —
- Rent YoY
- —
- Metro
- —
- State GDP YoY
- ▲ 3.95%
- F500 in state
- 110
Industry mix (Fortune 500 HQ in TX)
| Industry | F500 HQs | Revenue |
|---|---|---|
| Energy | 16 | $1,198B |
|
||
| Technology | 5 | $198B |
|
||
| Engineering / Construction | 4 | $72B |
|
||
| Energy Services | 3 | $60B |
|
||
| Utilities | 3 | $41B |
|
||
| Healthcare | 2 | $330B |
|
||
Price history
-6.0% since first listed2 events — show timeline
- 2026-02-03 Price Changed $77,700 AARMLS
- 2025-12-01 Listed $82,700 AARMLS
Property tax history
+3.4%/yrLatest (2025): $803 · -5.3% YoY. Source: county tax records.
Cash-flow waterfall
monthlySold comps — $/sqft
last 12 mo · ≤1 miLoading sold comps…