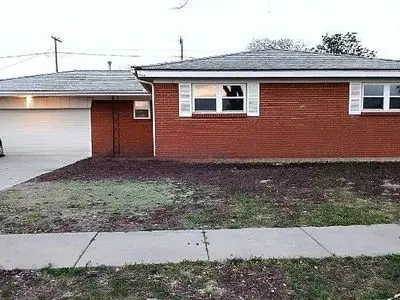
1201 Jackson St · Perryton, TX
Flood risk 1/10 · Minimal
- FEMA flood zone
- —
- Chance of flooding over 30 yrs
- 0.0%
- Est. flood insurance / yr
- —
Fire risk 3/10 · Minor
- Est. fire insurance / yr
- $1,222 – $2,270
Heat risk 5/10 · Moderate
- Hot days now (above 100°F)
- 7 days/yr
- Hot days in 30 yrs
- 19 days/yr
Wind risk 2/10 · Minimal
- Chance of severe wind over 30 yrs
- —
Air-quality risk 2/10 · Minimal
- Unhealthy air days now
- 0 days/yr
- Unhealthy air days in 30 yrs
- 1 days/yr
Risk factors via First Street. Map © Google.
Why this score? — see what drove the D grade
The composite is a weighted blend of 9 inputs, each scored 0–100. Each bar is that input's sub-score; the figure is the points it added to the 100-point composite (weight × sub-score).
- Cash flow +13.4/30.0
- ARV discount +7.5/15.0
- Schools +4.3/10.0
- 1% rule +4.0/10.0
- DSCR +4.0/10.0
- Livability +3.8/5.0
- Rent growth +2.5/5.0
- Condition / age +2.5/5.0
- Appreciation +0.0/10.0
$130,000
🖨 Deal sheet (PDF) 📄 Offer letter ✓ Due diligence
Listing remarks
Spacious 3-bedroom, 2-bath home offering 2,592 sq ft of living space on a 7,361 sq ft lot, conveniently located across from the high school and close to other schools on a quiet street. The home features a walk-in jacuzzi tub and walk-in shower, with recent updates including windows and doors (2018), roof and gutters, and laminate flooring installed within the past 6 months. Water and gas lines were updated in 2013. A gas heater is installed in the capped fireplace for additional heating. Interior will benefit from light cosmetic updates, including some flooring replacement. The property also includes a 3-car garage with epoxy floors, offering excellent space for vehicles, storage, or a wor
Key facts
- Laminate flooring
- Recent updates
- Walk-in jacuzzi tub
Tags
Neighborhood map
What this means for you Summary
Snapshot
- This is a 3-bed/2.0-bath single-family listed at $130k.
Deal economics
- At list price, monthly cash flow is $3 ($38/yr) — positive.
- The deal already cash-flows at list — no discount required.
- To meet the 1% rule (rent ≥ 1% of price), the offer needs to be $117k (9.9% below list).
- Recommended offer: $117k (9.9% below list) — sets the bar for 1% rule.
Location & tenants
- Location reads 76/100 on livability (#97 in TX, #3,326 nationally) — a middle-class / working-renter tenant base. Strengths: cost of living A+, housing A+, health & safety A+; Watch: employment C-, amenities D+, commute F.
- Perryton ISD (town): math 53% / reading 47% proficiency, ranked #186 of 826 in TX (top 22%) — acceptable for families but not a draw, mixed tenant base, ~2y average lease.
- Zoned schools: James L Wright El (math 37% / reading 42%, grade F, #1,545 of 4,322 statewide, top 38%, 471 students, 67% FRL); Perryton J H (math 53% / reading 48%, grade C, #333 of 1,662 statewide, top 21%, 436 students, 58% FRL); Perryton H S (math 62% / reading 57%, grade C+, #275 of 1,632 statewide, top 19%, 620 students, 56% FRL).
- Market conditions: 42 active listings in the ZIP; 4 units permitted in Ochiltree County in 2024 (0 in 5+ unit buildings).
Forward outlook
- Local home prices are declining (-3.0%/yr); year-one equity from $899 of loan paydown is wiped out by about $4k of value loss. Plan a longer hold.
- Ochiltree County population projected at +31% by 2050 — long-run rental-demand tailwind backs the buy-and-hold thesis.
Negotiation context
- It's been on market 26 days — a 2% lower offer ($128k) is reasonable based on typical stale-listing flexibility.
Risks & watch-outs
- Climate carrying-cost: extreme-heat days projected 7→19/yr by 2055 (HVAC capex compounding) — expect insurance premiums to compound above CPI over the hold.
Questions for the listing agent
- Built in 1965 — when were the roof, HVAC, electrical panel, plumbing, and water heater last replaced?
- Is there a deadline driving the sale (1031 exchange, divorce, estate, relocation)? That informs how much negotiation room exists.
- Schools are F-rated, which usually means shorter tenancies and higher turnover. Who's the typical renter profile here, and what's been the actual vacancy rate?
- The area grade is low — what's the realistic commute time and amenity access for the typical tenant pool here? Any planned neighborhood developments (good or bad) we should know about?
- What's the average days-on-market for RENTAL listings here right now (not sales)? A rising rental-DOM trend means longer vacancies and softer asking-rent achievability than the comps imply.
- What's the recent tenant-quality profile in this submarket — average credit score on applications, eviction rate, late-payment / NSF rate, and stable-employment percentage? A property-management company in the area should have these aggregated.
- How much new for-sale + rental construction is in the pipeline within 1–3 miles? Heavy new supply typically softens prices + rents 12–24 months out; constrained supply supports both.
Investment metrics
- 1% rule
- 0.90% ✗
- Cap rate
- 6.32%
- Cash-on-cash
- 0.10%
- DSCR
- 1.00
- GRM
- 9.2
CMA / ARV
No comps found within radius.
Projected returns pro-forma
-3.0% appreciation · 3.0% rent growth · sell at horizon
- IRR
- -16.1%
- Equity multiple
- 0.43×
- Total profit
- $-20,833
- Equity at exit
- $19,383
- IRR
- -7.7%
- Equity multiple
- 0.51×
- Total profit
- $-17,751
- Equity at exit
- $11,240
Cash invested: $36,400 (down + closing). Projections, not guarantees.
Landlord ↔ Tenant lean methodology
- Overall (STATE)
- 87 Strongly Landlord-Friendly
- State Texas
- 87 Strongly Landlord-Friendly · R+5
- County
- — inherits STATE
- City
- — inherits STATE
ZIP-level market 79070
- Active inventory
- 42
- Price-to-rent
- 9.2×
Monthly cashflow live
- Estimated rent
- $1,172 medium interval (Pro) →
- Mortgage (P&I)
- −$682
- Tax from tax record
- −$187 /mo · $2,240/yr
- Insurance
- −$54
- HOA
- −$0
- Vacancy / Maint / Mgmt
- −$246
- Net cashflow
- $3
Break-even live
Sensitivity live
| Price | -10% $77 | -5% $40 | +0% $3 | +5% $-34 | +10% $-70 |
|---|---|---|---|---|---|
| Rent | -10% $-89 | -5% $-43 | +0% $3 | +5% $49 | +10% $96 |
| Rate | -1.0pp $69 | -0.5pp $36 | base $3 | +0.5pp $-31 | +1.0pp $-65 |
UW: 25.0% down · 7.5% · 30yr · 1.5% tax · 5.0% vac · 8.0% maint · 8.0% mgmt
Financing live
Cash to close
- Down payment
- $32,500
- Closing costs
- $3,900
- Reserves months
- —
- Total cash needed
- —
Loan-product check · same deal, 3 products live
Conventional
25% down · 7.5% · 30yr
- Down + closing
- —
- Monthly P&I
- —
- Monthly cashflow
- —
- DSCR
- —
- Eligible?
- —
Personal DTI + credit; lowest rate.
DSCR
20% down · 8.5% · 30yr
- Down + closing
- —
- Monthly P&I
- —
- Monthly cashflow
- —
- DSCR
- —
- Eligible?
- —
No personal income docs; deal must DSCR.
Hard money
10% down · 12.0% · 12mo
- Down + closing
- —
- Monthly P&I
- —
- Monthly cashflow
- —
- DSCR
- —
- Eligible?
- —
Short-term bridge; refi at stabilization.
Listing history 19 events
-
2026-06-21days on market $130,000 Active 26 DOM
-
2026-06-21days on market $130,000 Active 25 DOM
-
2026-06-18days on market $130,000 Active 23 DOM
-
2026-06-17days on market $130,000 Active 22 DOM
-
2026-06-16days on market $130,000 Active 21 DOM
-
2026-06-15days on market $130,000 Active 20 DOM
-
2026-06-15days on market $130,000 Active 19 DOM
-
2026-06-13days on market $130,000 Active 18 DOM
-
2026-06-12days on market $130,000 Active 17 DOM
-
2026-06-09days on market $130,000 Active 14 DOM
-
2026-06-08days on market $130,000 Active 13 DOM
-
2026-06-08days on market $130,000 Active 12 DOM
-
2026-06-07days on market $130,000 Active 11 DOM
-
2026-06-03days on market $130,000 Active 8 DOM
-
2026-06-02days on market $130,000 Active 7 DOM
-
2026-06-01days on market $130,000 Active 6 DOM
-
2026-05-31days on market $130,000 Active 5 DOM
-
2026-05-26$130,000 Active
-
1989-06-27soldstatus
ⓘ Source: listings_history table (triggers on properties + properties_extension) + one-shot
backfill from property_details.listing_events for pre-trigger history.
Tax reassessment forecast TX · Resets to sale price
- Current annual tax
- $2,240 · $187/mo
- Projected year-2 tax
- $2,379 · $198/mo
- Expected delta
- +$139/yr (+$12/mo · 6.2%)
ⓘ Screening estimate from a state-policy table — verify with the county assessor before closing.
Climate risk First Street
- Flood 1/10 Low 0% chance over 30 yrs
- Wildfire 3/10 Moderate
- Heat 5/10 Major 7 d/yr ≥100°F today · 19 d/yr by 30 yrs out
- Wind 2/10 Low
- Air quality 2/10 Low 0 unhealthy d/yr today · 1 by 30 yrs out
Nearby sold comps map
Loading sold comps map…
Walkable amenities ~0.75 mi
Loading nearby amenities…
Taxation est. · year 1
- Rental income
- $14,061
- − Mortgage interest
- −$7,282
- − Property taxes
- −$2,240
- − Insurance
- −$650
- − Repairs & maintenance
- −$1,125
- − Management
- −$1,125
- − Depreciation
- −$3,782
- Taxable loss
- −$2,142
- Est. tax savings @ 24.0%
- +$514
- After-tax cash flow
- $552/yr
For passive investors: Depreciation is non-cash, so a rental often shows a tax loss while cash-flowing — sheltering income. Rental losses are passive: they offset passive income freely, and up to $25,000/yr can offset ordinary (W-2) income if you actively participate and your MAGI is under $100k (phasing out to $0 by $150k); unused losses carry forward. On sale, claimed depreciation is recaptured at up to 25%, and gains may owe capital-gains tax (a 1031 exchange can defer both). Figures are a year-1 estimate at your 24.0% rate — not tax advice; consult a CPA.
Schools (NCES district)
- District
- Perryton ISD
- NCES district ID
- 4834650
- Math proficiency
- 53% ▲ 8.00%
- Reading proficiency
- 47% ▲ 6.00%
- Median HH income
- $49,119
- Composite
- 42.73/100
- National rank
- #3159
- State rank
- #186 of 826 in TX
Livability — Perryton
- Score
- 76/100
- State rank
- #97
- US rank
- #3326
Category grades
Schools grade is shown separately in the Schools card above.
Census & demographics
- Census place
- Perryton, TX
- Population (ZIP)
- 9,655
Population outlook (Ochiltree County) Hauer SSP2
- Today (2025)
- 11,879 people
- By 2030
- 12,522 · +5.4%
- By 2040
- 13,989 · +17.8%
- By 2050
- 15,572 · +31.1%
- By 2075
- 19,380 · +63.1%
- By 2100
- 22,039 · +85.5%
Race, ethnicity, and origin ACS 2023
- Neighborhood character
- Majority Hispanic (56%)
- Race & ethnicity
- Hispanic / Latino 56% White 41% Two or more races 13%
- Hispanic origin (detail)
- Mexican 55%
- Common ancestry
- Lithuanian 1% Slovak 1% Italian 1%
- Foreign-born
- 30% · Canada
- Languages at home
- 53% English-only · Spanish 46%
Political lean MEDSL · Ochiltree
- 2024 margin
- Solid R (+81.6) · D 8.9% · R 90.5%
- 2008→2024 swing
- +2.3pp toward D · 2008: -83.9pp · 2024: -81.6pp
- All cycles
- 2024: R+81.6 2020: R+79.5 2016: R+79.0 2012: R+82.4 2008: R+83.9
Not yet ingested
- Civics
- —
Market trends
- HPI YoY
- ▼ -88.26%
- Current HPI
- 102.4171
- Rent YoY
- —
- Metro
- —
- State GDP YoY
- ▲ 3.95%
- F500 in state
- 110
Industry mix (Fortune 500 HQ in TX)
| Industry | F500 HQs | Revenue |
|---|---|---|
| Energy | 16 | $1,198B |
|
||
| Technology | 5 | $198B |
|
||
| Engineering / Construction | 4 | $72B |
|
||
| Energy Services | 3 | $60B |
|
||
| Utilities | 3 | $41B |
|
||
| Healthcare | 2 | $330B |
|
||
Price history
2 events — show timeline
- 2026-05-26 Listed $130,000 FSBO.com
- 1989-06-27 Sold (Public Records) — Public Records
Property tax history
+0.1%/yrLatest (2025): $2,240 · -45.0% YoY. Source: county tax records.
Cash-flow waterfall
monthlySold comps — $/sqft
last 12 mo · ≤1 miLoading sold comps…