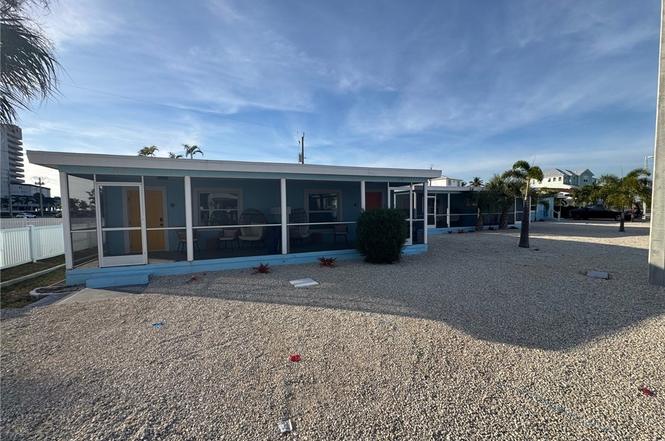
 Fourplex
113-119 Fairweather Ln · Fort Myers Beach, FL
Flood risk 10/10 · Severe
- FEMA flood zone
- AE
- Chance of flooding over 30 yrs
- 0.99%
- Est. flood insurance / yr
- $1,737 – $8,500
Fire risk 1/10 · Minimal
- Est. fire insurance / yr
- $947 – $1,759
Heat risk 10/10 · Severe
- Hot days now (above 113°F)
- 7 days/yr
- Hot days in 30 yrs
- 28 days/yr
Wind risk 10/10 · Severe
- Chance of severe wind over 30 yrs
- 99.0%
Air-quality risk 2/10 · Minimal
- Unhealthy air days now
- 1 days/yr
- Unhealthy air days in 30 yrs
- 1 days/yr
Risk factors via First Street. Map © Google.
Why this score? — see what drove the F grade
The composite is a weighted blend of 9 inputs, each scored 0–100. Each bar is that input's sub-score; the figure is the points it added to the 100-point composite (weight × sub-score).
- ARV discount +7.5/15.0
- Cash flow +7.3/30.0
- Schools +4.1/10.0
- Livability +3.5/5.0
- Rent growth +2.5/5.0
- Condition / age +2.5/5.0
- DSCR +1.5/10.0
- 1% rule +1.1/10.0
- Appreciation +0.0/10.0
$1,490,000
🖨 Deal sheet (PDF) 📄 Offer letter ✓ Due diligence
Multi-family units
County records classify this as Multi-Family (5+ Unit). Listing-text estimate: 4 units. estimate disagrees with records
5+ unit building — per-unit beds/baths from public records are typically unavailable; the breakdown below (if shown) is an estimate from the listing text.
Listing remarks
Stunning Income-Producing 4-Plex on Fort Myers Beach Discover an exceptional investment opportunity just steps from the white-sand shoreline of Fort Myers Beach. This 4-unit multifamily property offers the perfect blend of island living and strong rental performance. Each unit is thoughtfully designed to maximize comfort, natural light, and functionality, appealing to both long-term residents and short-term vacation tenants. This property was completely remodeled and completed in late 2025, is located on a street that allows weekly rentals which means 1 guest per week, no matter how long the reservation! The property features updated interiors, modern kitchens, and well-maintained bat
Key facts
- Remodeled
- Modern kitchens
- Updated interiors
Tags
Property features AI
Finance
- Other: Pets allowed
- Financial info: Gross scheduled income: $200,000; Operating expenses: $80,000; Typical actual rent per 1-bedroom furnished unit: $4,200
- HOA & community: Association provides beach access; Non-gated community
Exterior
- Parking: Public maintained road access
- Utilities: Cable available; Water assessment paid; Sewer assessment paid
- Home design: Multi-family property with 4 total units; Resale condition; Zoned RM-2
- Construction: Block, concrete and stucco construction; Built-up and flat roof
- Exterior features: Fenced property; Room available for a pool; Across-the-road water frontage; Oversized lot
Interior
- Kitchen: Each unit includes a cooktop and range; Microwave in units; Refrigerator (with ice in some units); Freezer in some units
- Bedrooms: Four 1-bedroom units (each furnished)
- Flooring: Tile flooring throughout
- Bathrooms: Four full bathrooms
- Heating & cooling: Window heating units; Wall and window cooling units
- Interior features: Impact glass windows
- Laundry & utility: Cable available
Neighborhood map
What this means for you Summary
Snapshot
- This is a 4 × 4-bed/4.0-bath units multifamily listed at $1.49M.
Deal economics
- At list price, monthly cash flow is $-2k ($-29k/yr) — negative. Per door: $-597/mo.
- To cash-flow at today's rent, offer at most $1.07M (28.3% below list).
- To meet the 1% rule (rent ≥ 1% of price), the offer needs to be $904k (39.3% below list).
- Recommended offer: $904k (39.3% below list) — sets the bar for 1% rule.
- Cap rate 4.7% vs local median 0.3% in Fort Myers Beach — top-decile yield for the area; either an underpriced asset or a hidden risk that comps aren't pricing in. Stress-test before assuming the spread holds.
Location & tenants
- Location reads 69/100 on livability (#489 in FL) — a middle-class / working-renter tenant base. Strengths: crime A+, employment A+, schools A-; Watch: amenities F, commute F, cost of living F.
- Lee (suburban): math 47% / reading 50% proficiency, ranked #42 of 73 in FL (top 58%) — families likely to look elsewhere, expect single-tenant / working-renter base with shorter leases.
- Market conditions: 876 active listings in the ZIP; 8 comparable units currently listed for rent nearby; rentals at typical pace (median 25d on market — plan ~3-4 weeks tenant-placement turnaround); solid renter incomes; 15,411 units permitted in Lee County in 2024 (4,686 in 5+ unit buildings).
- At $9,037/mo this rent would consume 137% of the median local household income ($79k/yr) (locally 145% of renters already pay >50% of income on rent) — very limited rent-growth headroom before tenants either downsize or default.
Forward outlook
- Local home prices are declining (-3.0%/yr); year-one equity from $10k of loan paydown is wiped out by about $45k of value loss. Plan a longer hold.
- Lee County population projected at +44% by 2050 — long-run rental-demand tailwind backs the buy-and-hold thesis.
Negotiation context
- It's been on market 214 days — a 12% lower offer ($1.31M) is reasonable based on typical stale-listing flexibility.
- Current owner paid $500k; list at $1.49M implies a 198% gain — meaningful room to come down on a strong offer.
Risks & watch-outs
- Watch-outs: flood insurance adds $427/mo; built in 1957 — expect roof / HVAC / electrical / plumbing capex.
- Climate carrying-cost: in FEMA flood zone AE (mandatory federal flood insurance); severe wind risk, 99% chance of damaging wind over 30y; extreme-heat days projected 7→28/yr by 2055 (HVAC capex compounding) — expect insurance premiums to compound above CPI over the hold.
Questions for the listing agent
- What do current leases actually rent for vs. the listed asking? Can we see a recent rent roll and the last 12 months of T-12 income?
- It's been on market 214 days. Have you received any prior offers? Is the seller open to a 39% concession, seller financing, or rate buy-down credit?
- Can we see the unit-by-unit rent roll, current vacancy, and any below-market leases? What's the average tenancy length?
- What capital expenditures (roof, boiler, parking lot, exteriors) have been made in the last 5 years, and what's planned in the next 2?
- Built in 1957 — when were the roof, HVAC, electrical panel, plumbing, and water heater last replaced?
- What's the actual annual flood-insurance premium (NFIP or private), and is the property in a SFHA with mandatory coverage?
- Why hasn't it sold? Are there any deal-killer items the seller is aware of (foundation, flood, title, zoning, code violations)?
- Is there a deadline driving the sale (1031 exchange, divorce, estate, relocation)? That informs how much negotiation room exists.
- Schools are A-rated — typically a magnet for longer-tenancy family renters. What's the average tenant stay here, and is there a school-zone premium baked into asking?
- The area grade is low — what's the realistic commute time and amenity access for the typical tenant pool here? Any planned neighborhood developments (good or bad) we should know about?
- What's the average days-on-market for RENTAL listings here right now (not sales)? A rising rental-DOM trend means longer vacancies and softer asking-rent achievability than the comps imply.
- What's the recent tenant-quality profile in this submarket — average credit score on applications, eviction rate, late-payment / NSF rate, and stable-employment percentage? A property-management company in the area should have these aggregated.
- How much new apartment / multifamily construction is in the pipeline within 1–3 miles? Heavy new supply (>2% of stock underway) typically softens rents 12–24 months out; light construction supports rent growth.
Investment metrics
- 1% rule
- 0.61% ✗
- Cap rate
- 4.71%
- Cash-on-cash
- -5.64%
- DSCR
- 0.75
- GRM
- 13.7
CMA / ARV
No comps found within radius.
Projected returns pro-forma
-3.0% appreciation · 3.0% rent growth · sell at horizon
- IRR
- -28.2%
- Equity multiple
- 0.06×
- Total profit
- $-393,754
- Equity at exit
- $222,164
- IRR
- -27.5%
- Equity multiple
- -0.29×
- Total profit
- $-539,935
- Equity at exit
- $128,828
Cash invested: $417,200 (down + closing). Projections, not guarantees.
Landlord ↔ Tenant lean methodology
- Overall (STATE)
- 87 Strongly Landlord-Friendly
- State Florida
- 87 Strongly Landlord-Friendly · R+3
- County
- — inherits STATE
- City
- — inherits STATE
ZIP-level market 33931
- Home prices YoY
- -18.8%
- Active inventory
- 876
- Price-to-rent
- 55.0×
Monthly cashflow live
- Estimated rent
- $9,037 medium interval (Pro) →
- Mortgage (P&I)
- −$7,814
- Tax from tax record
- −$664 /mo · $7,971/yr
- Insurance
- −$621
- Flood insurance flood zone
- −$427 /mo · $5,118/yr
- HOA
- −$0
- Vacancy / Maint / Mgmt
- −$1,898
- Net cashflow
- $-2,386
Break-even live
Sensitivity live
| Price | -10% $-1,543 | -5% $-1,964 | +0% $-2,386 | +5% $-2,808 | +10% $-3,230 |
|---|---|---|---|---|---|
| Rent | -10% $-3,100 | -5% $-2,743 | +0% $-2,386 | +5% $-2,029 | +10% $-1,672 |
| Rate | -1.0pp $-1,636 | -0.5pp $-2,007 | base $-2,386 | +0.5pp $-2,772 | +1.0pp $-3,165 |
4-unit breakdown (identical units grouped — click to expand)
| Units | Beds | Baths | Est. rent |
|---|---|---|---|
| 4× units | 4 | 4 | $9,036 |
| #1 | 4 | 4 | $2,259 |
| #2 | 4 | 4 | $2,259 |
| #3 | 4 | 4 | $2,259 |
| #4 | 4 | 4 | $2,259 |
| Total (4 units) | $9,037 | ||
UW: 25.0% down · 7.5% · 30yr · 1.5% tax · 5.0% vac · 8.0% maint · 8.0% mgmt
Financing live
Cash to close
- Down payment
- $372,500
- Closing costs
- $44,700
- Reserves months
- —
- Total cash needed
- —
Loan-product check · same deal, 3 products live
Conventional
25% down · 7.5% · 30yr
- Down + closing
- —
- Monthly P&I
- —
- Monthly cashflow
- —
- DSCR
- —
- Eligible?
- —
Personal DTI + credit; lowest rate.
DSCR
20% down · 8.5% · 30yr
- Down + closing
- —
- Monthly P&I
- —
- Monthly cashflow
- —
- DSCR
- —
- Eligible?
- —
No personal income docs; deal must DSCR.
Hard money
10% down · 12.0% · 12mo
- Down + closing
- —
- Monthly P&I
- —
- Monthly cashflow
- —
- DSCR
- —
- Eligible?
- —
Short-term bridge; refi at stabilization.
Rent comps 8 comps
| Address | Beds | Baths | Sqft | Rent | $/sqft | DOM | Units | Dist |
|---|---|---|---|---|---|---|---|---|
| 222 Fairweather Ln Unit 5 Fort Myers Beach, FL | 1.0 | 1.0 | 850 | $1,595 | $1.88 | 25d | 1 | 0.11mi |
| 2532 Estero Blvd #208 Fort Myers Beach, FL | 2.0 | 2.0 | 1312 | $4,900 | $3.73 | 25d | 1 | 0.22mi |
| 2560 Estero Blvd Unit 4A Fort Myers Beach, FL | 3.0 | 2.0 | 1211 | $4,900 | $4.05 | 25d | 1 | 0.24mi |
| 1511 Estero Blvd Fort Myers Beach, FL | 2.0 | 2.0 | 961 | $7,000 | $7.28 | 25d | 1 | 0.33mi |
| 2810 Estero Blvd #511 Fort Myers Beach, FL | 2.0 | 2.0 | 1266 | $13,250 | $10.47 | 25d | 1 | 0.46mi |
| 254 Palermo Cir Fort Myers Beach, FL | 3.0 | 2.0 | 1104 | $2,600 | $2.36 | 25d | 1 | 0.52mi |
| 70 Emily Ln Fort Myers Beach, FL | 2.0 | 2.0 | 960 | $5,000 | $5.21 | 25d | 1 | 0.81mi |
| 200 Mid Island Dr Fort Myers Beach, FL | 2.0 | 2.0 | 900 | $1,700 | $1.89 | 25d | 1 | 1.02mi |
Listing history 13 events
-
2026-06-17days on market $1,490,000 Active 214 DOM
-
2026-06-16days on market $1,490,000 Active 213 DOM
-
2026-06-16days on market $1,490,000 Active 212 DOM
-
2026-06-13days on market $1,490,000 Active 210 DOM
-
2026-06-09days on market $1,490,000 Active 206 DOM
-
2026-06-07days on market $1,490,000 Active 204 DOM
-
2026-06-02days on market $1,490,000 Active 199 DOM
-
2026-06-01days on market $1,490,000 Active 198 DOM
-
2026-06-01days on market $1,490,000 Active 197 DOM
-
2025-11-15$1,490,000 Active
-
2019-06-13soldstatus $500,000
-
1994-04-29soldstatus $155,000
-
1978-04-01soldstatus $78,000
ⓘ Source: listings_history table (triggers on properties + properties_extension) + one-shot
backfill from property_details.listing_events for pre-trigger history.
Tax reassessment forecast FL · Resets to sale price
- Current annual tax
- $7,971 · $664/mo
- Projected year-2 tax
- $12,367 · $1,031/mo
- Expected delta
- +$4,396/yr (+$366/mo · 55.2%)
ⓘ Screening estimate from a state-policy table — verify with the county assessor before closing.
Climate risk First Street
- Flood 10/10 Extreme FEMA zone AE · 99% chance over 30 yrs
- Wildfire 1/10 Low
- Heat 10/10 Extreme 7 d/yr ≥113°F today · 28 d/yr by 30 yrs out
- Wind 10/10 Extreme 99% chance of damaging wind over 30 yrs
- Air quality 2/10 Low 1 unhealthy d/yr today · 1 by 30 yrs out
Nearby sold comps map
Loading sold comps map…
Walkable amenities ~0.75 mi
Loading nearby amenities…
Taxation est. · year 1
- Rental income
- $108,444
- − Mortgage interest
- −$83,463
- − Property taxes
- −$7,971
- − Insurance
- −$12,568
- − Repairs & maintenance
- −$8,676
- − Management
- −$8,676
- − Depreciation
- −$43,345
- Taxable loss
- −$56,255
- Est. tax savings @ 24.0%
- +$13,501
- After-tax cash flow
- $-15,132/yr
For passive investors: Depreciation is non-cash, so a rental often shows a tax loss while cash-flowing — sheltering income. Rental losses are passive: they offset passive income freely, and up to $25,000/yr can offset ordinary (W-2) income if you actively participate and your MAGI is under $100k (phasing out to $0 by $150k); unused losses carry forward. On sale, claimed depreciation is recaptured at up to 25%, and gains may owe capital-gains tax (a 1031 exchange can defer both). Figures are a year-1 estimate at your 24.0% rate — not tax advice; consult a CPA.
Schools (NCES district)
- District
- Lee
- NCES district ID
- 1201080
- Math proficiency
- 47% ▼ -11.00%
- Reading proficiency
- 50% ▼ -4.00%
- Median HH income
- $49,518
- Composite
- 41.49/100
- National rank
- #3458
- State rank
- #42 of 73 in FL
Livability — Fort Myers Beach
- Score
- 69/100
- State rank
- #489
- US rank
- #8995
Category grades
Schools grade is shown separately in the Schools card above.
Census & demographics
- Census place
- Fort Myers Beach, FL
- County
- Lee County · 788,662 people
- Metro
- Cape Coral-Fort Myers, FL
- Population (ZIP)
- 8,350
- Household income
- $79,018
- Rent vs Own
- Severe rent burden
- 145.0
Population outlook (Lee County) Hauer SSP2
- Today (2025)
- 871,946 people
- By 2030
- 955,468 · +9.6%
- By 2040
- 1,113,587 · +27.7%
- By 2050
- 1,256,891 · +44.1%
- By 2075
- 1,560,270 · +78.9%
- By 2100
- 1,726,848 · +98.0%
Race, ethnicity, and origin ACS 2023
- Neighborhood character
- Predominantly White (94%)
- Race & ethnicity
- White 94% Hispanic / Latino 4% Two or more races 4%
- Common ancestry
- Romanian 5% Portuguese 3% Lithuanian 3%
- Foreign-born
- 5% · Canada
- Languages at home
- 94% English-only · Spanish 2% German/W. Germanic 1% French/Haitian/Cajun 1%
Political lean MEDSL · Lee
- 2024 margin
- Strong R (+28.4) · D 35.5% · R 63.9%
- 2008→2024 swing
- -18.0pp toward R · 2008: -10.4pp · 2024: -28.4pp
- All cycles
- 2024: R+28.4 2020: R+19.2 2016: R+20.4 2012: R+16.6 2008: R+10.4
Not yet ingested
- Civics
- —
Market trends
- HPI YoY
- ▼ -194.12%
- Current HPI
- 837.37
- Rent YoY
- —
- Metro
- Cape Coral-Fort Myers, FL
- State GDP YoY
- ▲ 3.28%
- F500 in state
- 36
Industry mix (Fortune 500 HQ in FL)
| Industry | F500 HQs | Revenue |
|---|---|---|
| Industrial Technology | 2 | $29B |
|
||
| Insurance | 2 | $17B |
|
||
| Retail | 1 | $60B |
|
||
| Technology Distribution | 1 | $58B |
|
||
| Homebuilding | 1 | $35B |
|
||
| Technology Manufacturing | 1 | $35B |
|
||
Price history
+1810.3% since first listed4 events — show timeline
- 2025-11-15 Listed $1,490,000 FORTMLS
- 2019-06-13 Sold (Public Records) $500,000 Public Records
- 1994-04-29 Sold (Public Records) $155,000 Public Records
- 1978-04-01 Sold (Public Records) $78,000 Public Records
Property tax history
+2.7%/yrLatest (2025): $7,971 · -28.1% YoY. Source: county tax records.
Cash-flow waterfall
monthlySold comps — $/sqft
last 12 mo · ≤1 miLoading sold comps…