2811 Lyons Center Rd · Vidalia, GA
Flood risk 1/10 · Minimal
- FEMA flood zone
- X (unshaded)
- Chance of flooding over 30 yrs
- 0.0%
- Est. flood insurance / yr
- $507 – $1,088
Fire risk 7/10 · Major
- Est. fire insurance / yr
- $963 – $1,789
Heat risk 8/10 · Major
- Hot days now (above 108°F)
- 7 days/yr
- Hot days in 30 yrs
- 18 days/yr
Wind risk 8/10 · Major
- Chance of severe wind over 30 yrs
- 80.0%
Air-quality risk 2/10 · Minimal
- Unhealthy air days now
- 1 days/yr
- Unhealthy air days in 30 yrs
- 1 days/yr
Risk factors via First Street. Map © Google.
Why this score? — see what drove the A grade
The composite is a weighted blend of 9 inputs, each scored 0–100. Each bar is that input's sub-score; the figure is the points it added to the 100-point composite (weight × sub-score).
- Cash flow +30.0/30.0
- ARV discount +15.0/15.0
- 1% rule +10.0/10.0
- DSCR +10.0/10.0
- Appreciation +10.0/10.0
- Livability +3.0/5.0
- Schools +2.8/10.0
- Rent growth +2.5/5.0
- Condition / age +2.5/5.0
$89,000
🖨 Deal sheet (PDF) 📄 Offer letter ✓ Due diligence
Listing remarks MLS
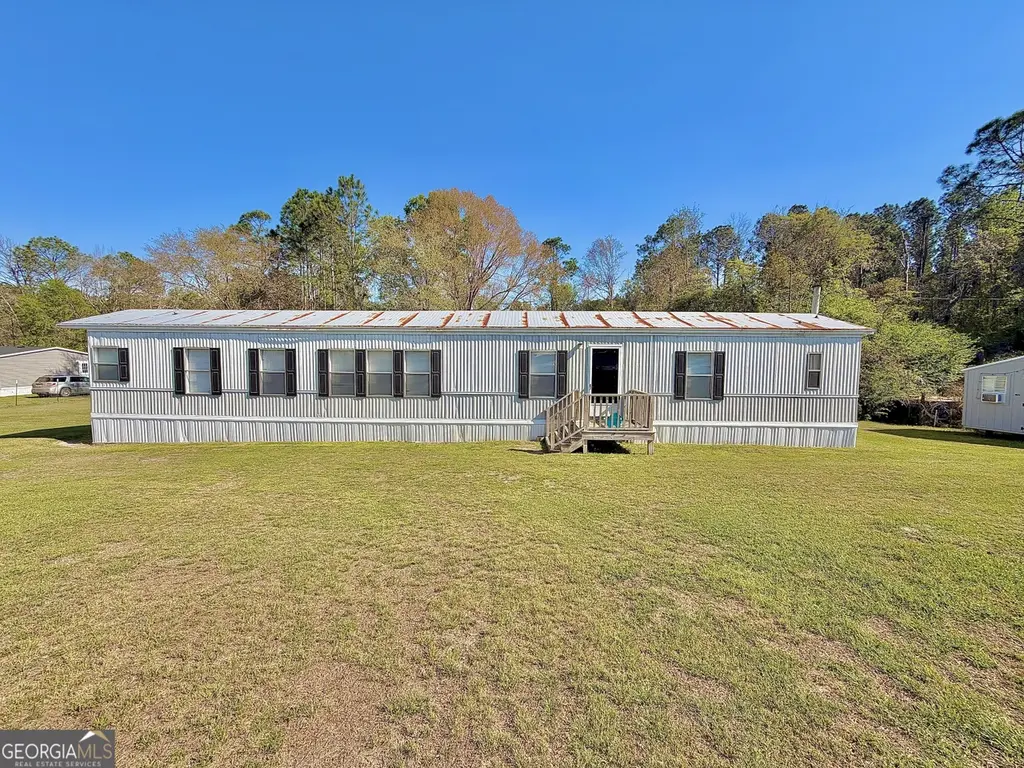
Welcome home to this charming 3 bedroom, 2 bathroom manufactured home situated on a full 1-acre lot! Enjoy the perfect blend of comfort and country living with plenty of space both inside and out. Step inside to find a functional layout with a cozy living area, open kitchen, and split-bedroom floor plan offering privacy for the primary suite. The spacious yard provides endless opportunities-whether you're looking to garden, entertain, or simply enjoy the peaceful surroundings. If you've been searching for affordable living with room to spread out, this property checks all the boxes!
Key facts
- Spacious yard
- Full acre lot
- Open kitchen
Tags
Neighborhood map
What this means for you Summary
Snapshot
- This is a 3-bed/2.0-bath other listed at $89k.
Deal economics
- At list price, monthly cash flow is $742 ($9k/yr) — positive.
- The deal already cash-flows at list — no discount required.
- Meets the 1% rule at list price ($2k rent vs $89k).
- Recommended offer: $84k (6.0% below list) — sets the bar for market timing.
- Cap rate 16.3% vs local median 3.9% in Vidalia — top-decile yield for the area; either an underpriced asset or a hidden risk that comps aren't pricing in. Stress-test before assuming the spread holds.
Location & tenants
- Location reads 60/100 on livability (#377 in GA) — a middle-class / working-renter tenant base. Strengths: cost of living A+, housing A+; Watch: health & safety C-, schools F, crime F.
- Toombs County (rural): math 36% / reading 31% proficiency, ranked #77 of 174 in GA (top 44%) — families likely to look elsewhere, expect single-tenant / working-renter base with shorter leases; 72% free/reduced lunch — lower-income household profile, screen leases tightly.
- Market conditions: 43 active listings in the ZIP; 33 units permitted in Toombs County in 2024 (0 in 5+ unit buildings).
Forward outlook
- In year one you build about $10k of equity ($615 loan paydown + $9k appreciation (10.0% local appreciation)).
- Toombs County population projected at -11% by 2050 — secular population decline; favor cash flow + early exit over multi-decade hold.
- At projected returns (10.0% appreciation + 3.0% rent growth), your $25k cash investment doubles in ~2 years — after that, you're playing with house money.
- By year 4, paydown + projected appreciation supports a ~$34k cash-out refi (75% LTV) — recoverable capital for the next deal without selling this one.
Negotiation context
- It's been on market 86 days — a 6% lower offer ($84k) is reasonable based on typical stale-listing flexibility.
- Current owner paid $54k; list at $89k implies a 65% gain — meaningful room to come down on a strong offer.
Risks & watch-outs
- Climate carrying-cost: severe wind risk, 80% chance of damaging wind over 30y; major wildfire risk; extreme-heat days projected 7→18/yr by 2055 (HVAC capex compounding) — expect insurance premiums to compound above CPI over the hold.
Questions for the listing agent
- It's been on market 86 days. Have you received any prior offers? Is the seller open to a 6% concession, seller financing, or rate buy-down credit?
- Why hasn't it sold? Are there any deal-killer items the seller is aware of (foundation, flood, title, zoning, code violations)?
- Is there a deadline driving the sale (1031 exchange, divorce, estate, relocation)? That informs how much negotiation room exists.
- Schools are F-rated, which usually means shorter tenancies and higher turnover. Who's the typical renter profile here, and what's been the actual vacancy rate?
- Crime grade is F in this area — have there been break-ins, vandalism, or insurance claims at this property in the last 3 years? What carrier currently insures it and at what premium?
- What's the average days-on-market for RENTAL listings here right now (not sales)? A rising rental-DOM trend means longer vacancies and softer asking-rent achievability than the comps imply.
- What's the recent tenant-quality profile in this submarket — average credit score on applications, eviction rate, late-payment / NSF rate, and stable-employment percentage? A property-management company in the area should have these aggregated.
- How much new for-sale + rental construction is in the pipeline within 1–3 miles? Heavy new supply typically softens prices + rents 12–24 months out; constrained supply supports both.
Investment metrics
- 1% rule
- 1.80% ✓
- Cap rate
- 16.29%
- Cash-on-cash
- 35.71%
- DSCR
- 2.59
- GRM
- 4.6
CMA / ARV
- ARV (median comp)
- $145,964
- List price
- $89,000
- Delta
- -39.03%
- Verdict
- UNDERPRICED
- Comps
- 4 within 2.0 mi
Projected returns pro-forma
10.0% appreciation · 3.0% rent growth · sell at horizon
- IRR
- 51.7%
- Equity multiple
- 4.84×
- Total profit
- $95,674
- Equity at exit
- $80,178
- IRR
- 45.3%
- Equity multiple
- 10.81×
- Total profit
- $244,543
- Equity at exit
- $172,907
Cash invested: $24,920 (down + closing). Projections, not guarantees.
Landlord ↔ Tenant lean methodology
- Overall (STATE)
- 90 Strongly Landlord-Friendly
- State Georgia
- 90 Strongly Landlord-Friendly · R+3
- County
- — inherits STATE
- City
- — inherits STATE
ZIP-level market 30436
- Home prices YoY
- 9.5%
- Active inventory
- 43
- Price-to-rent
- 4.6×
Monthly cashflow live
- Estimated rent
- $1,606 medium interval (Pro) →
- Mortgage (P&I)
- −$467
- Tax from tax record
- −$24 /mo · $283/yr
- Insurance
- −$37
- HOA
- −$0
- Vacancy / Maint / Mgmt
- −$337
- Net cashflow
- $742
Break-even live
Sensitivity live
| Price | -10% $792 | -5% $767 | +0% $742 | +5% $716 | +10% $691 |
|---|---|---|---|---|---|
| Rent | -10% $615 | -5% $678 | +0% $742 | +5% $805 | +10% $868 |
| Rate | -1.0pp $786 | -0.5pp $764 | base $742 | +0.5pp $719 | +1.0pp $695 |
UW: 25.0% down · 7.5% · 30yr · 1.5% tax · 5.0% vac · 8.0% maint · 8.0% mgmt
Financing live
Cash to close
- Down payment
- $22,250
- Closing costs
- $2,670
- Reserves months
- —
- Total cash needed
- —
Loan-product check · same deal, 3 products live
Conventional
25% down · 7.5% · 30yr
- Down + closing
- —
- Monthly P&I
- —
- Monthly cashflow
- —
- DSCR
- —
- Eligible?
- —
Personal DTI + credit; lowest rate.
DSCR
20% down · 8.5% · 30yr
- Down + closing
- —
- Monthly P&I
- —
- Monthly cashflow
- —
- DSCR
- —
- Eligible?
- —
No personal income docs; deal must DSCR.
Hard money
10% down · 12.0% · 12mo
- Down + closing
- —
- Monthly P&I
- —
- Monthly cashflow
- —
- DSCR
- —
- Eligible?
- —
Short-term bridge; refi at stabilization.
Listing history 19 events
-
2026-06-21days on market $89,000 Active 86 DOM
-
2026-06-19days on market $89,000 Active 84 DOM
-
2026-06-18days on market $89,000 Active 83 DOM
-
2026-06-17days on market $89,000 Active 82 DOM
-
2026-06-16days on market $89,000 Active 81 DOM
-
2026-06-15days on market $89,000 Active 80 DOM
-
2026-06-14days on market $89,000 Active 78 DOM
-
2026-06-12days on market $89,000 Active 77 DOM
-
2026-06-09days on market $89,000 Active 74 DOM
-
2026-06-08days on market $89,000 Active 73 DOM
-
2026-06-07days on market $89,000 Active 72 DOM
-
2026-06-07days on market $89,000 Active 71 DOM
-
2026-06-04days on market $89,000 Active 68 DOM
-
2026-06-02days on market $89,000 Active 67 DOM
-
2026-06-01days on market $89,000 Active 66 DOM
-
2026-05-31days on market $89,000 Active 65 DOM
-
2026-05-31days on market $89,000 Active 64 DOM
-
2026-03-13$89,000 New 591-char remark
Show marketing remark (591 chars)
Welcome home to this charming 3 bedroom, 2 bathroom manufactured home situated on a full 1-acre lot! Enjoy the perfect blend of comfort and country living with plenty of space both inside and out. Step inside to find a functional layout with a cozy living area, open kitchen, and split-bedroom floor plan offering privacy for the primary suite. The spacious yard provides endless opportunities-whether you're looking to garden, entertain, or simply enjoy the peaceful surroundings. If you've been searching for affordable living with room to spread out, this property checks all the boxes!
-
2023-11-02soldstatus $54,000
ⓘ Source: listings_history table (triggers on properties + properties_extension) + one-shot
backfill from property_details.listing_events for pre-trigger history.
Tax reassessment forecast GA · Resets to sale price
- Current annual tax
- $283 · $24/mo
- Projected year-2 tax
- $819 · $68/mo
- Expected delta
- +$536/yr (+$45/mo · 189.6%)
ⓘ Screening estimate from a state-policy table — verify with the county assessor before closing.
Climate risk First Street
- Flood 1/10 Low FEMA zone X (unshaded) · 0% chance over 30 yrs
- Wildfire 7/10 Severe
- Heat 8/10 Severe 7 d/yr ≥108°F today · 18 d/yr by 30 yrs out
- Wind 8/10 Severe 80% chance of damaging wind over 30 yrs
- Air quality 2/10 Low 1 unhealthy d/yr today · 1 by 30 yrs out
Nearby sold comps map
Loading sold comps map…
Walkable amenities ~0.75 mi
Loading nearby amenities…
Taxation est. · year 1
- Rental income
- $19,275
- − Mortgage interest
- −$4,985
- − Property taxes
- −$283
- − Insurance
- −$445
- − Repairs & maintenance
- −$1,542
- − Management
- −$1,542
- − Depreciation
- −$2,589
- Taxable income
- $7,889
- Est. tax owed @ 24.0%
- −$1,893
- After-tax cash flow
- $7,006/yr
For passive investors: Depreciation is non-cash, so a rental often shows a tax loss while cash-flowing — sheltering income. Rental losses are passive: they offset passive income freely, and up to $25,000/yr can offset ordinary (W-2) income if you actively participate and your MAGI is under $100k (phasing out to $0 by $150k); unused losses carry forward. On sale, claimed depreciation is recaptured at up to 25%, and gains may owe capital-gains tax (a 1031 exchange can defer both). Figures are a year-1 estimate at your 24.0% rate — not tax advice; consult a CPA.
Schools (NCES district)
- District
- Toombs County
- NCES district ID
- 1305040
- Math proficiency
- 36% ▼ -3.00%
- Reading proficiency
- 31% ▼ -5.00%
- Median HH income
- $34,288
- Composite
- 27.63/100
- National rank
- #6922
- State rank
- #77 of 174 in GA
Livability — Vidalia
- Score
- 60/100
- State rank
- #377
- US rank
- #19133
Category grades
Schools grade is shown separately in the Schools card above.
Census & demographics
- City population
- 17,315
- Population (ZIP)
- 11,547
Population outlook (Toombs County) Hauer SSP2
- Today (2025)
- 26,784 people
- By 2030
- 26,312 · -1.8%
- By 2040
- 25,219 · -5.8%
- By 2050
- 23,733 · -11.4%
- By 2075
- 19,107 · -28.7%
- By 2100
- 12,922 · -51.8%
Race, ethnicity, and origin ACS 2023
- Neighborhood character
- Majority White (63%)
- Race & ethnicity
- White 63% Black 20% Hispanic / Latino 14% Two or more races 5%
- Hispanic origin (detail)
- Mexican 13%
- Common ancestry
- Slovak 1% Serbian 1% Italian 1%
- Foreign-born
- 6% · Canada
- Languages at home
- 89% English-only · Spanish 11%
Political lean MEDSL · Toombs
- 2024 margin
- Solid R (+50.7) · D 24.5% · R 75.2%
- 2008→2024 swing
- -12.6pp toward R · 2008: -38.1pp · 2024: -50.7pp
- All cycles
- 2024: R+50.7 2020: R+45.2 2016: R+46.9 2012: R+40.5 2008: R+38.1
Not yet ingested
- Civics
- —
Market trends
- HPI YoY
- ▲ 22.28%
- Current HPI
- 257.7921
- Rent YoY
- —
- Metro
- —
- State GDP YoY
- ▲ 2.66%
- F500 in state
- 28
Industry mix (Fortune 500 HQ in GA)
| Industry | F500 HQs | Revenue |
|---|---|---|
| Paper / Packaging | 2 | $29B |
|
||
| Retail | 1 | $160B |
|
||
| Transportation / Logistics | 1 | $91B |
|
||
| Airlines | 1 | $62B |
|
||
| Consumer Goods | 1 | $47B |
|
||
| Utilities | 1 | $25B |
|
||
Price history
+64.8% since first listed2 events — show timeline
- 2026-03-13 Listed $89,000 GAMLS
- 2023-11-02 Sold (Public Records) $54,000 Public Records
Property tax history
+0.5%/yrLatest (2025): $283 · -0.0% YoY. Source: county tax records.
Cash-flow waterfall
monthlySold comps — $/sqft
last 12 mo · ≤1 miLoading sold comps…