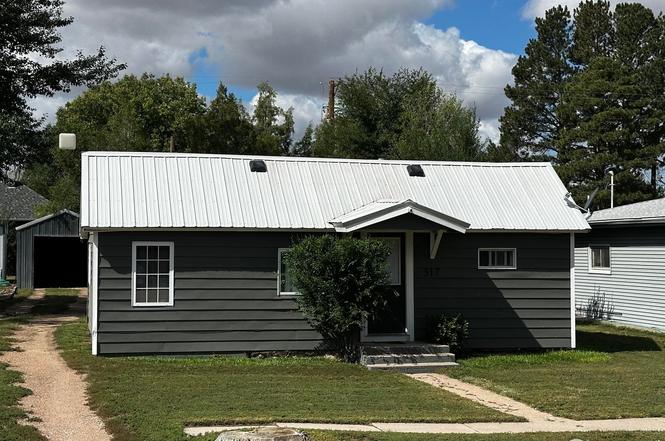
317 N Weld St · Otis, CO
Flood risk No data
- FEMA flood zone
- —
- Chance of flooding over 30 yrs
- —
- Est. flood insurance / yr
- —
Fire risk No data
- Est. fire insurance / yr
- —
Heat risk No data
- Hot days now (above threshold)
- —
- Hot days in 30 yrs
- —
Wind risk No data
- Chance of severe wind over 30 yrs
- —
Air-quality risk No data
- Unhealthy air days now
- —
- Unhealthy air days in 30 yrs
- —
Risk factors via First Street. Map © Google.
Why this score? — see what drove the C grade
The composite is a weighted blend of 9 inputs, each scored 0–100. Each bar is that input's sub-score; the figure is the points it added to the 100-point composite (weight × sub-score).
- Cash flow +15.8/30.0
- ARV discount +15.0/15.0
- Appreciation +9.0/10.0
- DSCR +4.9/10.0
- 1% rule +3.3/10.0
- Schools +2.9/10.0
- Rent growth +2.5/5.0
- Livability +2.5/5.0
- Condition / age +2.5/5.0
$99,900
🖨 Deal sheet (PDF) 📄 Offer letter ✓ Due diligence
Listing remarks
Affordable Fixer-Upper with Great Potential! Looking for a starter home or your next investment project? This 1-bedroom, 1-bath home in Northeast Colorado is full of potential and ready for your vision! Priced just right, this property is a rare opportunity to build equity with some sweat equity. This older home offers solid "good bones", a durable metal roof and siding, and newer carpet in the living room and bedroom. With a bit of updating and elbow grease, this could be the perfect home for first-time buyers, investors, or anyone looking for an affordable property they can truly make their own. Located in a quiet neighborhood with easy access to local amenities, this home offer
Key facts
- Metal roof
- Durable siding
- Spacious lot
Tags
Property features AI
Finance
- HOA & community: No association fees or transfer fees
Exterior
- Parking: Detached garage (1 car)
- Utilities: City water with meter installed; Public sewer; Natural gas available (Black Hills Gas); Electricity available; Town trash service (Town of Otis)
- Home design: Single-family residence; One story; Level-entry lot; Not new, previously owned
- Construction: Vinyl siding; Metal roof; Unfinished basement; Below-grade finished area present
- Exterior features: Fenced yard with chain link fencing; Level lot; Street lights; Alley access; Dirt road frontage on a city street; Minimal flood or C floodplain rating
Interior
- Kitchen: Electric range; Refrigerator
- Bedrooms: 1 bedroom (all bedrooms conform)
- Bathrooms: 1 full bathroom
- Heating & cooling: Space heater
- Interior features: Eat-in kitchen; Window coverings
Neighborhood map
What this means for you Summary
Snapshot
- This is a 1-bed/1.0-bath single-family listed at $100k.
Deal economics
- At list price, monthly cash flow is $46 ($556/yr) — positive.
- The deal already cash-flows at list — no discount required.
- To meet the 1% rule (rent ≥ 1% of price), the offer needs to be $83k (17.0% below list).
- Recommended offer: $83k (17.0% below list) — sets the bar for 1% rule.
Location & tenants
- Location reads 50/100 on livability (#401 in CO) — a working-class tenant base; expect higher turnover. Strengths: cost of living A+; Watch: crime F, amenities F, commute F.
- Otis School District No. R-3 (rural): math 25% / reading 35% proficiency, ranked #108 of 176 in CO (top 61%) — families likely to look elsewhere, expect single-tenant / working-renter base with shorter leases.
- Zoned schools: Otis Elementary School (math 24% / reading 30%, grade F, #552 of 966 statewide, top 59%, 96 students, 59% FRL); Otis Junior-Senior High School (math 24% / reading 30%, grade F, #256 of 381 statewide, top 67%, 105 students, 48% FRL) — zoned schools average 54% FRL vs 34% district-wide (20 pts higher); higher-poverty schools than district average — tighter screening recommended.
- Market conditions: 6 active listings in the ZIP; 2 units permitted in Washington County in 2024 (0 in 5+ unit buildings).
Forward outlook
- In year one you build about $9k of equity ($691 loan paydown + $8k appreciation (8.1% local appreciation)).
- Washington County population projected to shrink 3% by 2050 — rents likely to lag national; underwrite the cash flow, not the appreciation.
- At projected returns (8.1% appreciation + 3.0% rent growth), your $28k cash investment doubles in ~3 years — after that, you're playing with house money.
- By year 4, paydown + projected appreciation supports a ~$30k cash-out refi (75% LTV) — recoverable capital for the next deal without selling this one.
Negotiation context
- It's been on market 161 days — a 12% lower offer ($88k) is reasonable based on typical stale-listing flexibility.
- 3 sale attempts; this cycle's ask has dropped $15k (13%) from the opening price — seller is motivated, your offer sets the floor, not the list.
- Current owner paid $10k; list at $100k implies a 899% gain — meaningful room to come down on a strong offer.
Risks & watch-outs
- Watch-outs: built in 1909 — expect roof / HVAC / electrical / plumbing capex.
Questions for the listing agent
- It's been on market 161 days. Have you received any prior offers? Is the seller open to a 17% concession, seller financing, or rate buy-down credit?
- Built in 1909 — when were the roof, HVAC, electrical panel, plumbing, and water heater last replaced?
- Why hasn't it sold? Are there any deal-killer items the seller is aware of (foundation, flood, title, zoning, code violations)?
- Is there a deadline driving the sale (1031 exchange, divorce, estate, relocation)? That informs how much negotiation room exists.
- Schools are D-rated, which usually means shorter tenancies and higher turnover. Who's the typical renter profile here, and what's been the actual vacancy rate?
- Crime grade is F in this area — have there been break-ins, vandalism, or insurance claims at this property in the last 3 years? What carrier currently insures it and at what premium?
- What's the average days-on-market for RENTAL listings here right now (not sales)? A rising rental-DOM trend means longer vacancies and softer asking-rent achievability than the comps imply.
- What's the recent tenant-quality profile in this submarket — average credit score on applications, eviction rate, late-payment / NSF rate, and stable-employment percentage? A property-management company in the area should have these aggregated.
- How much new for-sale + rental construction is in the pipeline within 1–3 miles? Heavy new supply typically softens prices + rents 12–24 months out; constrained supply supports both.
Investment metrics
- 1% rule
- 0.83% ✗
- Cap rate
- 6.85%
- Cash-on-cash
- 1.99%
- DSCR
- 1.09
- GRM
- 10.0
CMA / ARV
- ARV (on-the-fly)
- $148,224
- Comps found
- 1
Show comp detail 1 sale within ~0.75 mi
| Address | Dist | Beds/Ba | Sqft | Sold | Price | $/sf | Match |
|---|---|---|---|---|---|---|---|
| 110 W 3rd Ave | 0.14mi | 2/1.0 (+1) | 800 (+4%) | 17mo | $154,500 | $193 | 67 |
Match score weights: distance 35% · size 25% · config 20% · recency 20%. Top-matched comps best support the ARV.
Projected returns pro-forma
8.05% appreciation · 3.0% rent growth · sell at horizon
- IRR
- 21.6%
- Equity multiple
- 2.59×
- Total profit
- $44,361
- Equity at exit
- $76,211
- IRR
- 19.8%
- Equity multiple
- 5.52×
- Total profit
- $126,449
- Equity at exit
- $151,578
Cash invested: $27,972 (down + closing). Projections, not guarantees.
Landlord ↔ Tenant lean methodology
- Overall (STATE)
- 38 Tenant-Leaning
- State Colorado
- 38 Tenant-Leaning · D+4
- County
- — inherits STATE
- City
- — inherits STATE
ZIP-level market 80743
- Home prices YoY
- 4.6%
- Active inventory
- 6
- Price-to-rent
- 10.0×
Monthly cashflow live
- Estimated rent
- $829 medium interval (Pro) →
- Mortgage (P&I)
- −$524
- Tax from tax record
- −$43 /mo · $521/yr
- Insurance
- −$42
- HOA
- −$0
- Lot rent
- −$0
- Vacancy / Maint / Mgmt
- −$174
- Net cashflow
- $46
Break-even live
Sensitivity live
| Price | -10% $103 | -5% $75 | +0% $46 | +5% $18 | +10% $-10 |
|---|---|---|---|---|---|
| Rent | -10% $-19 | -5% $14 | +0% $46 | +5% $79 | +10% $112 |
| Rate | -1.0pp $97 | -0.5pp $72 | base $46 | +0.5pp $20 | +1.0pp $-6 |
UW: 25.0% down · 7.5% · 30yr · 1.5% tax · 5.0% vac · 8.0% maint · 8.0% mgmt
Financing live
Cash to close
- Down payment
- $24,975
- Closing costs
- $2,997
- Reserves months
- —
- Total cash needed
- —
Loan-product check · same deal, 3 products live
Conventional
25% down · 7.5% · 30yr
- Down + closing
- —
- Monthly P&I
- —
- Monthly cashflow
- —
- DSCR
- —
- Eligible?
- —
Personal DTI + credit; lowest rate.
DSCR
20% down · 8.5% · 30yr
- Down + closing
- —
- Monthly P&I
- —
- Monthly cashflow
- —
- DSCR
- —
- Eligible?
- —
No personal income docs; deal must DSCR.
Hard money
10% down · 12.0% · 12mo
- Down + closing
- —
- Monthly P&I
- —
- Monthly cashflow
- —
- DSCR
- —
- Eligible?
- —
Short-term bridge; refi at stabilization.
Listing history 26 events
-
2026-06-22days on market $99,900 Active 161 DOM
-
2026-06-21days on market $99,900 Active 160 DOM
-
2026-06-21days on market $99,900 Active 159 DOM
-
2026-06-18days on market $99,900 Active 157 DOM
-
2026-06-17days on market $99,900 Active 156 DOM
-
2026-06-16days on market $99,900 Active 155 DOM
-
2026-06-15days on market $99,900 Active 154 DOM
-
2026-06-13days on market $99,900 Active 152 DOM
-
2026-06-12days on market $99,900 Active 151 DOM
-
2026-06-09days on market $99,900 Active 148 DOM
-
2026-06-08days on market $99,900 Active 147 DOM
-
2026-06-07days on market $99,900 Active 146 DOM
-
2026-06-05days on market $99,900 Active 144 DOM
-
2026-06-04days on market $99,900 Active 142 DOM
-
2026-06-02days on market $99,900 Active 141 DOM
-
2026-06-01days on market $99,900 Active 140 DOM
-
2026-05-31days on market $99,900 Active 139 DOM
-
2026-05-31days on market $99,900 Active 138 DOM
-
2026-05-22price $99,900
-
2026-02-19status Active
-
2026-02-01historical
-
2026-01-15price $107,500
-
2026-01-12$114,900 Active
-
2025-11-25historical
-
2025-09-18$114,900 Active
-
2000-09-19soldstatus $10,000
ⓘ Source: listings_history table (triggers on properties + properties_extension) + one-shot
backfill from property_details.listing_events for pre-trigger history.
Tax reassessment forecast CO · Resets to sale price
- Current annual tax
- $521 · $43/mo
- Projected year-2 tax
- $549 · $46/mo
- Expected delta
- +$28/yr (+$2/mo · 5.4%)
ⓘ Screening estimate from a state-policy table — verify with the county assessor before closing.
Nearby sold comps map
Loading sold comps map…
Walkable amenities ~0.75 mi
Loading nearby amenities…
Taxation est. · year 1
- Rental income
- $9,953
- − Mortgage interest
- −$5,596
- − Property taxes
- −$521
- − Insurance
- −$500
- − Repairs & maintenance
- −$796
- − Management
- −$796
- − Depreciation
- −$2,906
- Taxable loss
- −$1,162
- Est. tax savings @ 24.0%
- +$279
- After-tax cash flow
- $835/yr
For passive investors: Depreciation is non-cash, so a rental often shows a tax loss while cash-flowing — sheltering income. Rental losses are passive: they offset passive income freely, and up to $25,000/yr can offset ordinary (W-2) income if you actively participate and your MAGI is under $100k (phasing out to $0 by $150k); unused losses carry forward. On sale, claimed depreciation is recaptured at up to 25%, and gains may owe capital-gains tax (a 1031 exchange can defer both). Figures are a year-1 estimate at your 24.0% rate — not tax advice; consult a CPA.
Schools (NCES district)
- District
- Otis School District No. R-3
- NCES district ID
- 0805940
- Math proficiency
- 25% ▲ 5.00%
- Reading proficiency
- 35% ▲ 5.00%
- Median HH income
- $44,693
- Composite
- 28.51/100
- National rank
- #12083
- State rank
- #108 of 176 in CO
Livability — Otis
- Score
- 50/100
- State rank
- #401
- US rank
- #25534
Category grades
Schools grade is shown separately in the Schools card above.
Census & demographics
- Census place
- Otis, CO
- Population (ZIP)
- 1,415
Population outlook (Washington County) Hauer SSP2
- Today (2025)
- 4,919 people
- By 2030
- 4,920 · +0.0%
- By 2040
- 4,871 · -1.0%
- By 2050
- 4,758 · -3.3%
- By 2075
- 4,694 · -4.6%
- By 2100
- 3,991 · -18.9%
Race, ethnicity, and origin ACS 2023
- Neighborhood character
- Predominantly White (84%)
- Race & ethnicity
- White 84% Hispanic / Latino 12% Two or more races 4% Black 2%
- Hispanic origin (detail)
- Mexican 9%
- Common ancestry
- Portuguese 3% Slovak 2% Serbian 2%
- Foreign-born
- 4% · Canada
- Languages at home
- 93% English-only · Spanish 6%
Political lean MEDSL · Washington
- 2024 margin
- Solid R (+75.1) · D 11.7% · R 86.8% · Other 1.5%
- 2008→2024 swing
- -18.6pp toward R · 2008: -56.5pp · 2024: -75.1pp
- All cycles
- 2024: R+75.1 2020: R+74.0 2016: R+73.7 2012: R+62.2 2008: R+56.5
Not yet ingested
- Civics
- —
Market trends
- HPI YoY
- ▲ 8.05%
- Current HPI
- 183.616
- Rent YoY
- —
- Metro
- —
- State GDP YoY
- ▲ 1.95%
- F500 in state
- 14
Industry mix (Fortune 500 HQ in CO)
| Industry | F500 HQs | Revenue |
|---|---|---|
| Technology Distribution | 1 | $31B |
|
||
| Food / Agriculture | 1 | $18B |
|
||
| Packaging | 1 | $14B |
|
||
| Healthcare | 1 | $13B |
|
||
| Energy | 1 | $10B |
|
||
| Technology | 1 | $4B |
|
||
Price history
+899.0% since first listed8 events — show timeline
- 2026-05-22 Price Changed $99,900 IRES
- 2026-02-19 Relisted — IRES
- 2026-02-01 Listing Removed — IRES
- 2026-01-15 Price Changed $107,500 IRES
- 2026-01-12 Listed $114,900 IRES
- 2025-11-25 Listing Removed — IRES
- 2025-09-18 Listed $114,900 IRES
- 2000-09-19 Sold (Public Records) $10,000 Public Records
Property tax history
+14.3%/yrLatest (2025): $521 · +126.0% YoY. Source: county tax records.
Cash-flow waterfall
monthlySold comps — $/sqft
last 12 mo · ≤1 miLoading sold comps…