 🌊 Lakefront
15631 Thompson Dr · Albion, NY
Flood risk 5/10 · Moderate
- FEMA flood zone
- X
- Chance of flooding over 30 yrs
- 0.24%
- Est. flood insurance / yr
- $507 – $1,088
Fire risk 1/10 · Minimal
- Est. fire insurance / yr
- $691 – $1,283
Heat risk 2/10 · Minimal
- Hot days now (above 97°F)
- 6 days/yr
- Hot days in 30 yrs
- 13 days/yr
Wind risk 2/10 · Minimal
- Chance of severe wind over 30 yrs
- 1.0%
Air-quality risk 1/10 · Minimal
- Unhealthy air days now
- 0 days/yr
- Unhealthy air days in 30 yrs
- 0 days/yr
Risk factors via First Street. Map © Google.
Why this score? — see what drove the F grade
The composite is a weighted blend of 9 inputs, each scored 0–100. Each bar is that input's sub-score; the figure is the points it added to the 100-point composite (weight × sub-score).
- Appreciation +8.8/10.0
- ARV discount +7.5/15.0
- Schools +6.2/10.0
- Livability +3.0/5.0
- Rent growth +2.5/5.0
- Condition / age +2.5/5.0
- Cash flow +2.2/30.0
- 1% rule +0.2/10.0
- DSCR +0.0/10.0
$199,900
🖨 Deal sheet (PDF) 📄 Offer letter ✓ Due diligence
Listing remarks
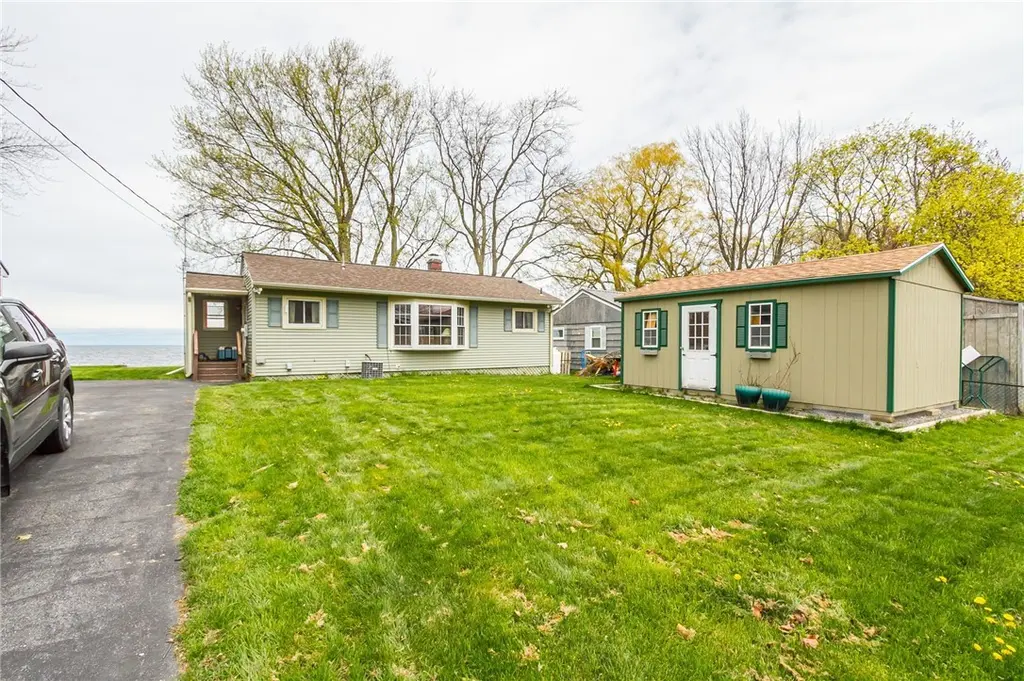
Opportunity Knocks! ~ Cozy Ranch Waiting for Your Updates ~ 60' of Shoreline with a Flat Yard ~ Rebuilt Break Wall ~ 20 Minutes to Lake Ontario Parkway & I-390 Entrance ~ Close Proximity to Hamlin Beach State Park ~ Create a Private Retreat, Use as a Rental, or Remove and Start Over (subject to local zoning regulations) ~ Estate Comes "As-Is" ~ Delayed Negotiations begin Tuesday, 5/12/26 @ Noon
Key facts
- 8,100 sq ft lot
- Built 1952
- Listed 8 days
Property features AI
Exterior
- Parking: No garage
- Utilities: Water connected (public); Septic tank
- Home design: Single-story; Resale property; Has view; Waterfront with beach access to a lake; City street frontage
- Construction: Aluminum siding; Vinyl siding; Architectural shingle roof; Existing construction
- Exterior features: Shed(s) / storage; See remarks
Interior
- Kitchen: Appliances negotiable
- Bedrooms: 2 main-level bedrooms; 5 total rooms
- Flooring: Carpet; Laminate; Varies
- Bathrooms: 1 full bathroom (main level)
- Heating & cooling: Propane forced-air heating; Has heating
- Interior features: Living/Dining room; Bedroom on main level; See remarks
- Laundry & utility: Main-level laundry; Electric water heater
Neighborhood map
What this means for you Summary
Snapshot
- This is a 2-bed/1.0-bath single-family listed at $200k.
Deal economics
- At list price, monthly cash flow is $-717 ($-9k/yr) — negative.
- To cash-flow at today's rent, offer at most $98k (51.1% below list).
- To meet the 1% rule (rent ≥ 1% of price), the offer needs to be $104k (48.0% below list).
- Recommended offer: $98k (51.1% below list) — sets the bar for cash-flow.
- Cap rate 2.0% vs local median 4.1% in Albion — below-typical yield; the buyer is paying a premium for something (appreciation thesis, condition, location) that the cap rate doesn't capture.
Location & tenants
- Location reads 59/100 on livability (#1,009 in NY) — a working-class tenant base; expect higher turnover. Strengths: cost of living A+, housing A-; Watch: crime D-, amenities F, commute F.
- Kendall Central School District (rural): math 74% / reading 72% proficiency, ranked #117 of 590 in NY (top 20%) — strong family-tenant draw, lease renewals of 3-5y typical.
- Zoned schools: Kendall Elementary School (math 72% / reading 67%, grade A-, #447 of 2,108 statewide, top 24%, 355 students, 56% FRL); Kendall Junior-Senior High School (math 77% / reading 77%, grade A-, #583 of 1,100 statewide, top 56%, 325 students, 49% FRL) — zoned schools average 52% FRL vs 35% district-wide (17 pts higher); higher-poverty schools than district average — tighter screening recommended.
- Market conditions: 13 active listings in the ZIP; 28 units permitted in Orleans County in 2024 (0 in 5+ unit buildings).
Forward outlook
- In year one you build about $17k of equity ($1k loan paydown + $15k appreciation (7.7% local appreciation)).
- Orleans County population projected at -20% by 2050 — secular population decline; favor cash flow + early exit over multi-decade hold.
- By year 3, paydown + projected appreciation supports a ~$42k cash-out refi (75% LTV) — recoverable capital for the next deal without selling this one.
Negotiation context
- Only 8 days on market — expect competitive offers; lowballing is unlikely to land.
- Current owner paid $77k; list at $200k implies a 159% gain — meaningful room to come down on a strong offer.
Risks & watch-outs
- Watch-outs: built in 1952 — expect roof / HVAC / electrical / plumbing capex.
- Climate carrying-cost: moderate flood risk — expect insurance premiums to compound above CPI over the hold.
Questions for the listing agent
- What do current leases actually rent for vs. the listed asking? Can we see a recent rent roll and the last 12 months of T-12 income?
- Built in 1952 — when were the roof, HVAC, electrical panel, plumbing, and water heater last replaced?
- Is there a deadline driving the sale (1031 exchange, divorce, estate, relocation)? That informs how much negotiation room exists.
- Crime grade is D in this area — have there been break-ins, vandalism, or insurance claims at this property in the last 3 years? What carrier currently insures it and at what premium?
- The area grade is low — what's the realistic commute time and amenity access for the typical tenant pool here? Any planned neighborhood developments (good or bad) we should know about?
- This sits on a lake — are riparian / water-frontage rights deeded with the parcel? Any dock permits, shoreline easements, or HOA water-use restrictions?
- What's the documented flood / surge / shoreline-erosion history here (FEMA AND non-FEMA — e.g., storm surge, creek backup, septic-field saturation)?
- Any water-quality or seasonal algae-bloom issues that affect tenant satisfaction or short-term-rental demand?
- What's the average days-on-market for RENTAL listings here right now (not sales)? A rising rental-DOM trend means longer vacancies and softer asking-rent achievability than the comps imply.
- What's the recent tenant-quality profile in this submarket — average credit score on applications, eviction rate, late-payment / NSF rate, and stable-employment percentage? A property-management company in the area should have these aggregated.
- How much new for-sale + rental construction is in the pipeline within 1–3 miles? Heavy new supply typically softens prices + rents 12–24 months out; constrained supply supports both.
Investment metrics
- 1% rule
- 0.52% ✗
- Cap rate
- 1.99%
- Cash-on-cash
- -15.37%
- DSCR
- 0.32
- GRM
- 16.0
CMA / ARV
- ARV (median comp)
- $473,469
- List price
- $199,900
- Delta
- -57.78%
- Verdict
- UNDERPRICED
- Comps
- 5 within 1.0 mi
Projected returns pro-forma
7.67% appreciation · 3.0% rent growth · sell at horizon
- IRR
- 7.8%
- Equity multiple
- 1.58×
- Total profit
- $32,549
- Equity at exit
- $147,346
- IRR
- 9.5%
- Equity multiple
- 3.30×
- Total profit
- $128,521
- Equity at exit
- $288,268
Cash invested: $55,972 (down + closing). Projections, not guarantees.
Landlord ↔ Tenant lean methodology
- Overall (STATE)
- 15 Strongly Tenant-Friendly
- State New York
- 15 Strongly Tenant-Friendly · D+10
- County
- — inherits STATE
- City
- — inherits STATE
ZIP-level market 14477
- Home prices YoY
- 2.6%
- Active inventory
- 13
- Price-to-rent
- 16.0×
Monthly cashflow live
- Estimated rent
- $1,040 medium interval (Pro) →
- Mortgage (P&I)
- −$1,048
- Tax from tax record
- −$407 /mo · $4,887/yr
- Insurance
- −$83
- HOA
- −$0
- Vacancy / Maint / Mgmt
- −$218
- Net cashflow
- $-717
Break-even live
Sensitivity live
| Price | -10% $-604 | -5% $-660 | +0% $-717 | +5% $-773 | +10% $-830 |
|---|---|---|---|---|---|
| Rent | -10% $-799 | -5% $-758 | +0% $-717 | +5% $-676 | +10% $-635 |
| Rate | -1.0pp $-616 | -0.5pp $-666 | base $-717 | +0.5pp $-769 | +1.0pp $-821 |
UW: 25.0% down · 7.5% · 30yr · 1.5% tax · 5.0% vac · 8.0% maint · 8.0% mgmt
Financing live
Cash to close
- Down payment
- $49,975
- Closing costs
- $5,997
- Reserves months
- —
- Total cash needed
- —
Loan-product check · same deal, 3 products live
Conventional
25% down · 7.5% · 30yr
- Down + closing
- —
- Monthly P&I
- —
- Monthly cashflow
- —
- DSCR
- —
- Eligible?
- —
Personal DTI + credit; lowest rate.
DSCR
20% down · 8.5% · 30yr
- Down + closing
- —
- Monthly P&I
- —
- Monthly cashflow
- —
- DSCR
- —
- Eligible?
- —
No personal income docs; deal must DSCR.
Hard money
10% down · 12.0% · 12mo
- Down + closing
- —
- Monthly P&I
- —
- Monthly cashflow
- —
- DSCR
- —
- Eligible?
- —
Short-term bridge; refi at stabilization.
Listing history 3 events
-
2026-05-13status Pending 413-char remark
-
2026-05-05$199,900 Active 413-char remark
-
1996-08-29soldstatus $77,200
ⓘ Source: listings_history table (triggers on properties + properties_extension) + one-shot
backfill from property_details.listing_events for pre-trigger history.
Tax reassessment forecast NY · Partial reset (capped growth)
- Current annual tax
- $4,887 · $407/mo
- Projected year-2 tax
- $4,887 · $407/mo
- Expected delta
- $0/yr ($0/mo · 0.0%)
ⓘ Screening estimate from a state-policy table — verify with the county assessor before closing.
Climate risk First Street
- Flood 5/10 Major FEMA zone X · 24% chance over 30 yrs
- Wildfire 1/10 Low
- Heat 2/10 Low 6 d/yr ≥97°F today · 13 d/yr by 30 yrs out
- Wind 2/10 Low 100% chance of damaging wind over 30 yrs
- Air quality 1/10 Low 0 unhealthy d/yr today · 0 by 30 yrs out
Nearby sold comps map
Loading sold comps map…
Walkable amenities ~0.75 mi
Loading nearby amenities…
Taxation est. · year 1
- Rental income
- $12,485
- − Mortgage interest
- −$11,198
- − Property taxes
- −$4,887
- − Insurance
- −$1,000
- − Repairs & maintenance
- −$999
- − Management
- −$999
- − Depreciation
- −$5,815
- Taxable loss
- −$12,412
- Est. tax savings @ 24.0%
- +$2,979
- After-tax cash flow
- $-5,624/yr
For passive investors: Depreciation is non-cash, so a rental often shows a tax loss while cash-flowing — sheltering income. Rental losses are passive: they offset passive income freely, and up to $25,000/yr can offset ordinary (W-2) income if you actively participate and your MAGI is under $100k (phasing out to $0 by $150k); unused losses carry forward. On sale, claimed depreciation is recaptured at up to 25%, and gains may owe capital-gains tax (a 1031 exchange can defer both). Figures are a year-1 estimate at your 24.0% rate — not tax advice; consult a CPA.
Schools (NCES district)
- District
- Kendall Central School District
- NCES district ID
- 3616200
- Math proficiency
- 74% ▲ 15.00%
- Reading proficiency
- 72% ▲ 14.00%
- Median HH income
- $56,456
- Composite
- 62.48/100
- National rank
- #689
- State rank
- #117 of 590 in NY
Livability — Albion
- Score
- 59/100
- State rank
- #1009
- US rank
- #19661
Category grades
Schools grade is shown separately in the Schools card above.
Census & demographics
- Population (ZIP)
- 1,779
Population outlook (Orleans County) Hauer SSP2
- Today (2025)
- 39,123 people
- By 2030
- 37,648 · -3.8%
- By 2040
- 34,432 · -12.0%
- By 2050
- 31,487 · -19.5%
- By 2075
- 26,544 · -32.2%
- By 2100
- 22,251 · -43.1%
Race, ethnicity, and origin ACS 2023
- Neighborhood character
- Predominantly White (93%)
- Race & ethnicity
- White 93% Two or more races 4% Hispanic / Latino 3% Black 2%
- Common ancestry
- Romanian 5% Slovak 5% Lithuanian 2%
- Foreign-born
- 2%
- Languages at home
- 96% English-only · Spanish 4%
Political lean MEDSL · Orleans
- 2024 margin
- Solid R (+40.5) · D 29.8% · R 70.2%
- 2008→2024 swing
- -21.8pp toward R · 2008: -18.7pp · 2024: -40.5pp
- All cycles
- 2024: R+40.5 2020: R+36.0 2016: R+43.4 2012: R+19.4 2008: R+18.7
Not yet ingested
- Civics
- —
Market trends
- HPI YoY
- ▲ 7.67%
- Current HPI
- 296.9489
- Rent YoY
- —
- Metro
- —
- State GDP YoY
- ▲ 2.60%
- F500 in state
- 92
Industry mix (Fortune 500 HQ in NY)
| Industry | F500 HQs | Revenue |
|---|---|---|
| Financial Services | 10 | $950B |
|
||
| Consumer Goods | 9 | $162B |
|
||
| Insurance | 4 | $225B |
|
||
| Telecommunications | 2 | $144B |
|
||
| Pharmaceuticals | 2 | $112B |
|
||
| Media / Entertainment | 2 | $69B |
|
||
Price history
+158.9% since first listed3 events — show timeline
- 2026-05-13 Pending — UNYREIS
- 2026-05-05 Listed $199,900 UNYREIS
- 1996-08-29 Sold (Public Records) $77,200 Public Records
Property tax history
+1.3%/yrLatest (2025): $4,887 · +3.9% YoY. Source: county tax records.
Cash-flow waterfall
monthlySold comps — $/sqft
last 12 mo · ≤1 miLoading sold comps…