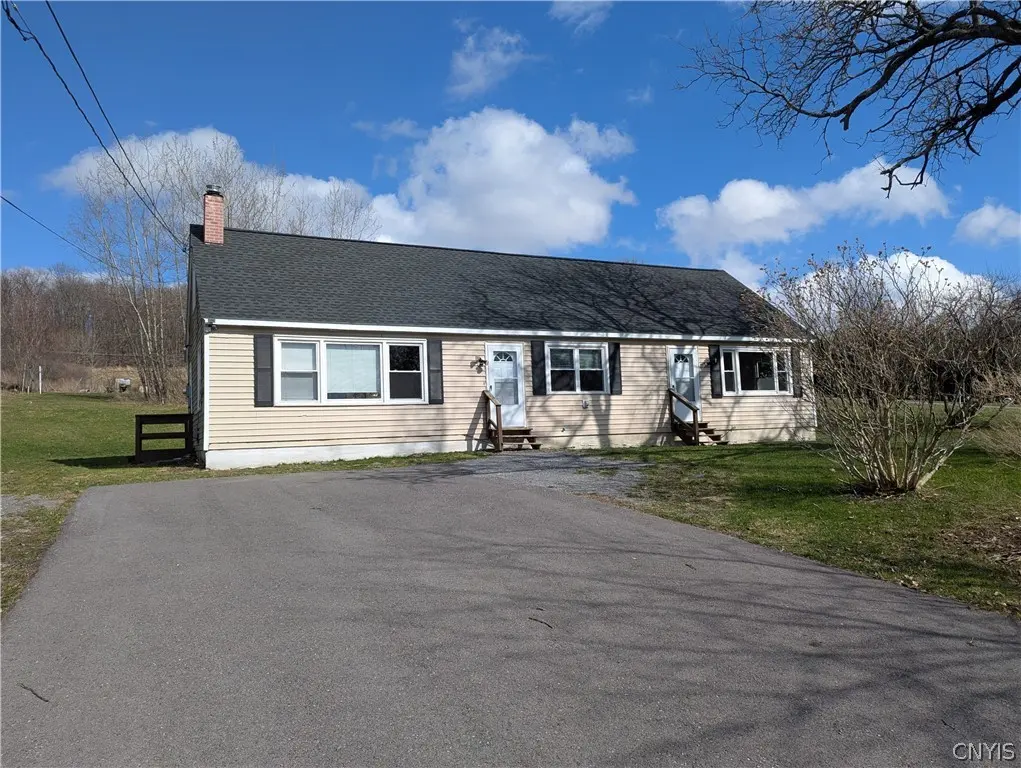
3826 Sentinel Heights Rd · Nedrow, NY
Flood risk 1/10 · Minimal
- FEMA flood zone
- X (unshaded)
- Chance of flooding over 30 yrs
- 0.0%
- Est. flood insurance / yr
- $473 – $860
Fire risk 1/10 · Minimal
- Est. fire insurance / yr
- $691 – $1,283
Heat risk 1/10 · Minimal
- Hot days now (above 91°F)
- 7 days/yr
- Hot days in 30 yrs
- 16 days/yr
Wind risk 1/10 · Minimal
- Chance of severe wind over 30 yrs
- 1.0%
Air-quality risk 2/10 · Minimal
- Unhealthy air days now
- 0 days/yr
- Unhealthy air days in 30 yrs
- 1 days/yr
Risk factors via First Street. Map © Google.
Why this score? — see what drove the D+ grade
The composite is a weighted blend of 9 inputs, each scored 0–100. Each bar is that input's sub-score; the figure is the points it added to the 100-point composite (weight × sub-score).
- ARV discount +15.0/15.0
- Appreciation +8.3/10.0
- Cash flow +6.4/30.0
- Schools +4.4/10.0
- Livability +3.6/5.0
- Rent growth +2.5/5.0
- Condition / age +2.5/5.0
- 1% rule +1.7/10.0
- DSCR +0.7/10.0
$229,900
🖨 Deal sheet (PDF) 📄 Offer letter ✓ Due diligence
Listing remarks MLS
Nothing to do but move in. This spacious Cape features include living and family rooms, dining room, first floor laundry, updated kitchen, full basement and more.
Key facts
- Full basement
- Updated kitchen
- 0.72 acre lot
Tags
Neighborhood map
What this means for you Summary
Snapshot
- This is a 2-bed/1.0-bath single-family listed at $230k.
Deal economics
- At list price, monthly cash flow is $-400 ($-5k/yr) — negative.
- To cash-flow at today's rent, offer at most $159k (30.8% below list).
- To meet the 1% rule (rent ≥ 1% of price), the offer needs to be $155k (32.8% below list).
- Recommended offer: $155k (32.8% below list) — sets the bar for 1% rule.
Location & tenants
- Location reads 71/100 on livability (#415 in NY) — a middle-class / working-renter tenant base. Strengths: cost of living A+, housing A+, health & safety A; Watch: employment C-, amenities F, commute F.
- Lafayette Central School District (rural): math 45% / reading 56% proficiency, ranked #351 of 590 in NY (top 60%) — acceptable for families but not a draw, mixed tenant base, ~2y average lease.
- Zoned schools: C Grant Grimshaw School (math 27% / reading 57%, grade F, #1,361 of 2,108 statewide, top 67%, 327 students, 46% FRL); La Fayette Junior-Senior High School (math 67% / reading 52%, grade C+, #851 of 1,100 statewide, top 80%, 324 students, 40% FRL).
- Market conditions: 19 active listings in the ZIP; 616 units permitted in Onondaga County in 2024 (256 in 5+ unit buildings).
Forward outlook
- In year one you build about $17k of equity ($2k loan paydown + $15k appreciation (6.7% local appreciation)).
- Onondaga County population projected to shrink 9% by 2050 — rents likely to lag national; underwrite the cash flow, not the appreciation.
- By year 3, paydown + projected appreciation supports a ~$42k cash-out refi (75% LTV) — recoverable capital for the next deal without selling this one.
Negotiation context
- It's been on market 87 days — a 6% lower offer ($216k) is reasonable based on typical stale-listing flexibility.
- 6 sale attempts since 9y ago with the ask held roughly flat each time — persistent listings suggest the price (not the market) is what's stuck; bring a comps-based counter.
Risks & watch-outs
- Watch-outs: built in 1959 — expect roof / HVAC / electrical / plumbing capex.
Questions for the listing agent
- What do current leases actually rent for vs. the listed asking? Can we see a recent rent roll and the last 12 months of T-12 income?
- It's been on market 87 days. Have you received any prior offers? Is the seller open to a 33% concession, seller financing, or rate buy-down credit?
- Built in 1959 — when were the roof, HVAC, electrical panel, plumbing, and water heater last replaced?
- Why hasn't it sold? Are there any deal-killer items the seller is aware of (foundation, flood, title, zoning, code violations)?
- Is there a deadline driving the sale (1031 exchange, divorce, estate, relocation)? That informs how much negotiation room exists.
- Schools are D-rated, which usually means shorter tenancies and higher turnover. Who's the typical renter profile here, and what's been the actual vacancy rate?
- The area grade is low — what's the realistic commute time and amenity access for the typical tenant pool here? Any planned neighborhood developments (good or bad) we should know about?
- What's the average days-on-market for RENTAL listings here right now (not sales)? A rising rental-DOM trend means longer vacancies and softer asking-rent achievability than the comps imply.
- What's the recent tenant-quality profile in this submarket — average credit score on applications, eviction rate, late-payment / NSF rate, and stable-employment percentage? A property-management company in the area should have these aggregated.
- How much new for-sale + rental construction is in the pipeline within 1–3 miles? Heavy new supply typically softens prices + rents 12–24 months out; constrained supply supports both.
Investment metrics
- 1% rule
- 0.67% ✗
- Cap rate
- 4.20%
- Cash-on-cash
- -7.46%
- DSCR
- 0.67
- GRM
- 12.4
CMA / ARV
- ARV (median comp)
- $333,586
- List price
- $229,900
- Delta
- -31.08%
- Verdict
- UNDERPRICED
- Comps
- 4 within 1.0 mi
Projected returns pro-forma
6.66% appreciation · 3.0% rent growth · sell at horizon
- IRR
- 11.1%
- Equity multiple
- 1.78×
- Total profit
- $50,042
- Equity at exit
- $154,221
- IRR
- 12.0%
- Equity multiple
- 3.57×
- Total profit
- $165,206
- Equity at exit
- $288,450
Cash invested: $64,372 (down + closing). Projections, not guarantees.
Landlord ↔ Tenant lean methodology
- Overall (STATE)
- 15 Strongly Tenant-Friendly
- State New York
- 15 Strongly Tenant-Friendly · D+10
- County
- — inherits STATE
- City
- — inherits STATE
ZIP-level market 13084
- Home prices YoY
- 2.2%
- Active inventory
- 19
- Price-to-rent
- 12.4×
Monthly cashflow live
- Estimated rent
- $1,545 medium interval (Pro) →
- Mortgage (P&I)
- −$1,206
- Tax from tax record
- −$320 /mo · $3,835/yr
- Insurance
- −$96
- HOA
- −$0
- Vacancy / Maint / Mgmt
- −$325
- Net cashflow
- $-400
Break-even live
Sensitivity live
| Price | -10% $-270 | -5% $-335 | +0% $-400 | +5% $-465 | +10% $-530 |
|---|---|---|---|---|---|
| Rent | -10% $-522 | -5% $-461 | +0% $-400 | +5% $-339 | +10% $-278 |
| Rate | -1.0pp $-284 | -0.5pp $-342 | base $-400 | +0.5pp $-460 | +1.0pp $-520 |
UW: 25.0% down · 7.5% · 30yr · 1.5% tax · 5.0% vac · 8.0% maint · 8.0% mgmt
Financing live
Cash to close
- Down payment
- $57,475
- Closing costs
- $6,897
- Reserves months
- —
- Total cash needed
- —
Loan-product check · same deal, 3 products live
Conventional
25% down · 7.5% · 30yr
- Down + closing
- —
- Monthly P&I
- —
- Monthly cashflow
- —
- DSCR
- —
- Eligible?
- —
Personal DTI + credit; lowest rate.
DSCR
20% down · 8.5% · 30yr
- Down + closing
- —
- Monthly P&I
- —
- Monthly cashflow
- —
- DSCR
- —
- Eligible?
- —
No personal income docs; deal must DSCR.
Hard money
10% down · 12.0% · 12mo
- Down + closing
- —
- Monthly P&I
- —
- Monthly cashflow
- —
- DSCR
- —
- Eligible?
- —
Short-term bridge; refi at stabilization.
Listing history 16 events
-
2026-05-14status Pending 162-char remark
Show marketing remark (162 chars)
Nothing to do but move in. This spacious Cape features include living and family rooms, dining room, first floor laundry, updated kitchen, full basement and more.
-
2026-03-26status Active 162-char remark
Show marketing remark (162 chars)
Nothing to do but move in. This spacious Cape features include living and family rooms, dining room, first floor laundry, updated kitchen, full basement and more.
-
2026-01-13status Pending 162-char remark
Show marketing remark (162 chars)
Nothing to do but move in. This spacious Cape features include living and family rooms, dining room, first floor laundry, updated kitchen, full basement and more.
-
2025-12-05$229,900 Active 162-char remark
Show marketing remark (162 chars)
Nothing to do but move in. This spacious Cape features include living and family rooms, dining room, first floor laundry, updated kitchen, full basement and more.
-
2024-10-26historical
-
2024-08-22price $229,900
-
2024-08-02price $239,900
-
2024-07-24$250,000 Active
-
2022-06-30historical
-
2022-06-02$214,900 Active
-
2021-05-14status Pending Sale
-
2021-05-14historical
-
2021-04-29$199,900 Active
-
2017-09-24historical
-
2017-08-31price $47,500
-
2017-07-26$54,000 Active
ⓘ Source: listings_history table (triggers on properties + properties_extension) + one-shot
backfill from property_details.listing_events for pre-trigger history.
Tax reassessment forecast NY · Partial reset (capped growth)
- Current annual tax
- $3,835 · $320/mo
- Projected year-2 tax
- $3,860 · $322/mo
- Expected delta
- +$25/yr (+$2/mo · 0.7%)
ⓘ Screening estimate from a state-policy table — verify with the county assessor before closing.
Climate risk First Street
- Flood 1/10 Low FEMA zone X (unshaded) · 0% chance over 30 yrs
- Wildfire 1/10 Low
- Heat 1/10 Low 7 d/yr ≥91°F today · 16 d/yr by 30 yrs out
- Wind 1/10 Low 100% chance of damaging wind over 30 yrs
- Air quality 2/10 Low 0 unhealthy d/yr today · 1 by 30 yrs out
Nearby sold comps map
Loading sold comps map…
Walkable amenities ~0.75 mi
Loading nearby amenities…
Taxation est. · year 1
- Rental income
- $18,543
- − Mortgage interest
- −$12,878
- − Property taxes
- −$3,835
- − Insurance
- −$1,150
- − Repairs & maintenance
- −$1,483
- − Management
- −$1,483
- − Depreciation
- −$6,688
- Taxable loss
- −$8,974
- Est. tax savings @ 24.0%
- +$2,154
- After-tax cash flow
- $-2,649/yr
For passive investors: Depreciation is non-cash, so a rental often shows a tax loss while cash-flowing — sheltering income. Rental losses are passive: they offset passive income freely, and up to $25,000/yr can offset ordinary (W-2) income if you actively participate and your MAGI is under $100k (phasing out to $0 by $150k); unused losses carry forward. On sale, claimed depreciation is recaptured at up to 25%, and gains may owe capital-gains tax (a 1031 exchange can defer both). Figures are a year-1 estimate at your 24.0% rate — not tax advice; consult a CPA.
Schools (NCES district)
- District
- Lafayette Central School District
- NCES district ID
- 3616410
- Math proficiency
- 45% ▲ 10.00%
- Reading proficiency
- 56% ▲ 22.00%
- Median HH income
- $63,210
- Composite
- 44.42/100
- National rank
- #2809
- State rank
- #351 of 590 in NY
Livability — Nedrow
- Score
- 71/100
- State rank
- #415
- US rank
- #7218
Category grades
Schools grade is shown separately in the Schools card above.
Census & demographics
- Population (ZIP)
- 3,764
Population outlook (Onondaga County) Hauer SSP2
- Today (2025)
- 467,894 people
- By 2030
- 463,381 · -1.0%
- By 2040
- 447,697 · -4.3%
- By 2050
- 426,399 · -8.9%
- By 2075
- 373,661 · -20.1%
- By 2100
- 307,967 · -34.2%
Race, ethnicity, and origin ACS 2023
- Neighborhood character
- Predominantly White (85%)
- Race & ethnicity
- White 85% Two or more races 10% Black 3% Hispanic / Latino 2% Native American 1%
- Common ancestry
- Romanian 6% Lithuanian 6% Iranian 2%
- Foreign-born
- 2%
Political lean MEDSL · Onondaga
- 2024 margin
- D (+17.3) · D 58.6% · R 41.4%
- 2008→2024 swing
- -3.0pp toward R · 2008: 20.3pp · 2024: 17.3pp
- All cycles
- 2024: D+17.3 2020: D+20.6 2016: D+12.8 2012: D+21.1 2008: D+20.3
Not yet ingested
- Civics
- —
Market trends
- HPI YoY
- ▲ 6.66%
- Current HPI
- 312.478
- Rent YoY
- —
- Metro
- —
- State GDP YoY
- ▲ 2.60%
- F500 in state
- 92
Industry mix (Fortune 500 HQ in NY)
| Industry | F500 HQs | Revenue |
|---|---|---|
| Financial Services | 10 | $950B |
|
||
| Consumer Goods | 9 | $162B |
|
||
| Insurance | 4 | $225B |
|
||
| Telecommunications | 2 | $144B |
|
||
| Pharmaceuticals | 2 | $112B |
|
||
| Media / Entertainment | 2 | $69B |
|
||
Price history
+325.7% since first listed16 events — show timeline
- 2026-05-14 Pending — CNYIS
- 2026-03-26 Relisted — CNYIS
- 2026-01-13 Pending — CNYIS
- 2025-12-05 Listed $229,900 CNYIS
- 2024-10-26 Listing Removed — CNYIS
- 2024-08-22 Price Changed $229,900 CNYIS
- 2024-08-02 Price Changed $239,900 CNYIS
- 2024-07-24 Listed $250,000 CNYIS
- 2022-06-30 Listing Removed — CNYIS
- 2022-06-02 Listed $214,900 CNYIS
- 2021-05-14 Pending — CNYIS
- 2021-05-14 Listing Removed — CNYIS
- 2021-04-29 Listed $199,900 CNYIS
- 2017-09-24 Listing Removed — CNYIS
- 2017-08-31 Price Changed $47,500 CNYIS
- 2017-07-26 Listed $54,000 CNYIS
Property tax history
+13.6%/yrLatest (2025): $3,835 · +2.6% YoY. Source: county tax records.
Cash-flow waterfall
monthlySold comps — $/sqft
last 12 mo · ≤1 miLoading sold comps…