 Duplex
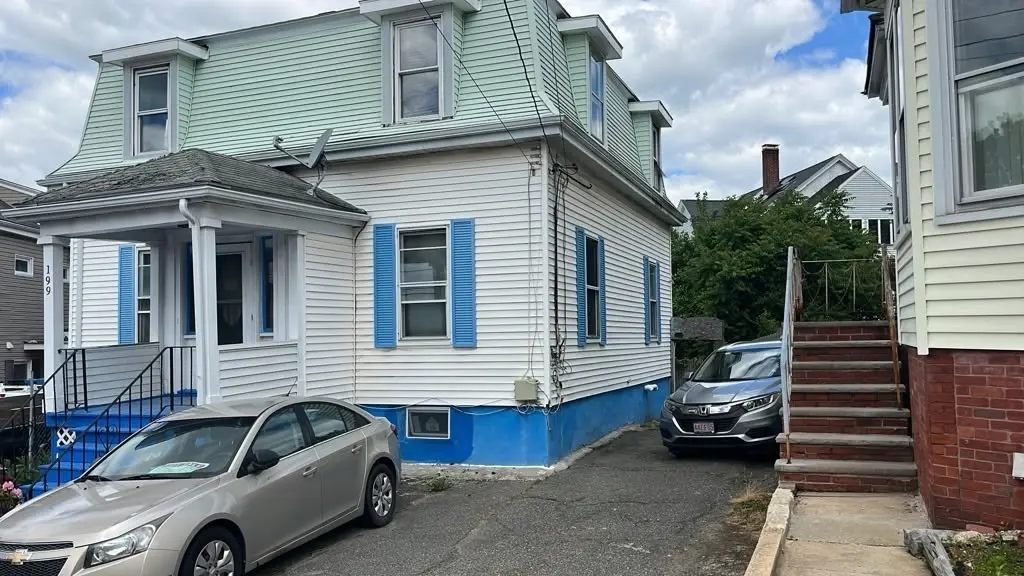
199 Allen Ave · Lynn, MA
Flood risk 1/10 · Minimal
- FEMA flood zone
- X (unshaded)
- Chance of flooding over 30 yrs
- 0.0%
- Est. flood insurance / yr
- $473 – $860
Fire risk 1/10 · Minimal
- Est. fire insurance / yr
- $915 – $1,699
Heat risk 6/10 · Moderate
- Hot days now (above 96°F)
- 7 days/yr
- Hot days in 30 yrs
- 15 days/yr
Wind risk 6/10 · Moderate
- Chance of severe wind over 30 yrs
- 72.0%
Air-quality risk 3/10 · Minor
- Unhealthy air days now
- 3 days/yr
- Unhealthy air days in 30 yrs
- 3 days/yr
Risk factors via First Street. Map © Google.
Why this score? — see what drove the C grade
The composite is a weighted blend of 9 inputs, each scored 0–100. Each bar is that input's sub-score; the figure is the points it added to the 100-point composite (weight × sub-score).
- Cash flow +18.8/30.0
- ARV discount +15.0/15.0
- DSCR +5.9/10.0
- 1% rule +4.7/10.0
- Livability +3.8/5.0
- Rent growth +2.7/5.0
- Condition / age +2.5/5.0
- Schools +1.7/10.0
- Appreciation +0.0/10.0
$509,900
🖨 Deal sheet 📄 Offer letter ✓ Due diligence
Multi-family units
County records classify this as Multi-Family (2-4 Unit). Listing-text estimate: 2 units. confirmed
Listing remarks MLS
NEWLY RENOVATED; NEW WINDOWS, CARPETS, LINO, TILE FLOOR IN 1ST & 2ND BATHS, NEW KITCHEN ON 2ND FL, VYNAL SIDED, TOTALLY VACANT. VACANT. QUICK CLOSING.
Key facts
- 2,609 sq ft lot
- 2 parking spots
- Built 1890
Neighborhood map
What this means for you Summary
Snapshot
- This is a 2 × 2-bed/1.0-bath units multifamily listed at $510k.
Deal economics
- At list price, monthly cash flow is $516 ($6k/yr) — positive. Per door: $258/mo.
- The deal already cash-flows at list — no discount required.
- To meet the 1% rule (rent ≥ 1% of price), the offer needs to be $492k (3.5% below list).
- Recommended offer: $492k (3.5% below list) — sets the bar for 1% rule.
- Cap rate 7.5% vs local median 3.6% in Lynn — top-decile yield for the area; either an underpriced asset or a hidden risk that comps aren't pricing in. Stress-test before assuming the spread holds.
Location & tenants
- Location reads 75/100 on livability (#74 in MA, #4,077 nationally) — a middle-class / working-renter tenant base. Strengths: commute A+, health & safety A+, housing B+; Watch: amenities C-, schools D+, crime D-.
- Lynn (suburban): math 14% / reading 25% proficiency, ranked #293 of 302 in MA (top 97%) — low school quality limits family demand, transient renter base, plan for 1-2y turnover; 73% free/reduced lunch — lower-income household profile, screen leases tightly.
- Market conditions: Rents flat; 51 active listings in the ZIP; 40 comparable units currently listed for rent nearby; rentals at typical pace (median 25d on market — plan ~3-4 weeks tenant-placement turnaround); 40% of comp listings sitting > 30 days — soft ceiling on asking rent; 1,032 units permitted in Essex County in 2024 (590 in 5+ unit buildings).
- At $4,922/mo this rent would consume 88% of the median local household income ($67k/yr) (locally 3883% of renters already pay >50% of income on rent) — very limited rent-growth headroom before tenants either downsize or default.
Forward outlook
- Local home prices are declining (-3.0%/yr); year-one equity from $4k of loan paydown is wiped out by about $15k of value loss. Plan a longer hold.
- Essex County population projected at +15% by 2050 — long-run rental-demand tailwind backs the buy-and-hold thesis.
Negotiation context
- Only 13 days on market — expect competitive offers; lowballing is unlikely to land.
- Current owner paid $203k; list at $510k implies a 151% gain — meaningful room to come down on a strong offer.
Risks & watch-outs
- Watch-outs: built in 1890 — expect roof / HVAC / electrical / plumbing capex.
- Climate carrying-cost: major wind risk, 72% chance of damaging wind over 30y; extreme-heat days projected 7→15/yr by 2055 (HVAC capex compounding) — expect insurance premiums to compound above CPI over the hold.
Questions for the listing agent
- Can we see the unit-by-unit rent roll, current vacancy, and any below-market leases? What's the average tenancy length?
- What capital expenditures (roof, boiler, parking lot, exteriors) have been made in the last 5 years, and what's planned in the next 2?
- Built in 1890 — when were the roof, HVAC, electrical panel, plumbing, and water heater last replaced?
- Is there a deadline driving the sale (1031 exchange, divorce, estate, relocation)? That informs how much negotiation room exists.
- Schools are D-rated, which usually means shorter tenancies and higher turnover. Who's the typical renter profile here, and what's been the actual vacancy rate?
- Crime grade is D in this area — have there been break-ins, vandalism, or insurance claims at this property in the last 3 years? What carrier currently insures it and at what premium?
- What's the average days-on-market for RENTAL listings here right now (not sales)? A rising rental-DOM trend means longer vacancies and softer asking-rent achievability than the comps imply.
- What's the recent tenant-quality profile in this submarket — average credit score on applications, eviction rate, late-payment / NSF rate, and stable-employment percentage? A property-management company in the area should have these aggregated.
- How much new apartment / multifamily construction is in the pipeline within 1–3 miles? Heavy new supply (>2% of stock underway) typically softens rents 12–24 months out; light construction supports rent growth.
Investment metrics
- 1% rule
- 0.97% ✗
- Cap rate
- 7.51%
- Cash-on-cash
- 4.33%
- DSCR
- 1.19
- GRM
- 8.6
CMA / ARV
- ARV (median comp)
- $765,308
- List price
- $509,900
- Delta
- -29.45%
- Verdict
- UNDERPRICED
- Comps
- 20 within 1.0 mi
Show comp detail 8 sales within ~0.75 mi
| Address | Dist | Beds/Ba | Sqft | Sold | Price | $/sf | Match |
|---|---|---|---|---|---|---|---|
| 47 Rockaway St | 0.42mi | 5/3.0 (+1) | 1,555 (-7%) | 1mo | $630,000 | $405 | 64 |
| 25 Acorn St | 0.28mi | 4/2.0 | 1,772 (+6%) | 23mo | $565,000 | $319 | 54 |
| 501 Chestnut St | 0.47mi | 4/2.0 | 1,792 (+7%) | 13mo | $800,000 | $446 | 51 |
| 195 Washington St | 0.31mi | 4/2.0 | 1,785 (+7%) | 23mo | $725,000 | $406 | 51 |
| 48 Eade St | 0.41mi | 5/2.0 (+1) | 1,702 (+2%) | 22mo | $600,000 | $353 | 50 |
| 54 Rockaway Pl | 0.39mi | 4/2.0 | 1,440 (-14%) | 16mo | $695,900 | $483 | 41 |
| 205 Western Ave | 0.55mi | 4/2.0 | 1,909 (+14%) | 14mo | $825,000 | $432 | 35 |
| 106 Eutaw Ave | 0.72mi | 4/3.0 | 1,844 (+10%) | 22mo | $635,000 | $344 | 30 |
Match score weights: distance 35% · size 25% · config 20% · recency 20%. Top-matched comps best support the ARV.
Projected returns pro-forma
-3.0% appreciation · 0.67% rent growth · sell at horizon
- IRR
- -12.1%
- Equity multiple
- 0.57×
- Total profit
- $-61,087
- Equity at exit
- $76,028
- IRR
- -6.7%
- Equity multiple
- 0.61×
- Total profit
- $-55,152
- Equity at exit
- $44,087
Cash invested: $142,772 (down + closing). Projections, not guarantees.
Landlord ↔ Tenant lean methodology
- Overall (STATE)
- 20 Strongly Tenant-Friendly
- State Massachusetts
- 20 Strongly Tenant-Friendly · D+15
- County
- — inherits STATE
- City
- — inherits STATE
ZIP-level market 01902
- Rents YoY
- 0.7%
- Active inventory
- 51
- Price-to-rent
- 17.3×
Monthly cashflow live
- Estimated rent
- $4,922 high interval (Pro) →
- Mortgage (P&I)
- −$2,674
- Tax from tax record
- −$486 /mo · $5,837/yr
- Insurance
- −$212
- HOA
- −$0
- Vacancy / Maint / Mgmt
- −$1,034
- Net cashflow
- $516
Break-even live
2-unit breakdown (identical units grouped — click to expand)
| Units | Beds | Baths | Est. rent |
|---|---|---|---|
| 2× units | 2 | 1 | $4,922 |
| #1 | 2 | 1 | $2,461 |
| #2 | 2 | 1 | $2,461 |
| Total (2 units) | $4,922 | ||
UW: 25.0% down · 7.5% · 30yr · 1.5% tax · 5.0% vac · 8.0% maint · 8.0% mgmt
Financing live
Cash to close
- Down payment
- $127,475
- Closing costs
- $15,297
- Reserves months
- —
- Total cash needed
- —
Loan-product check · same deal, 3 products live
Conventional
25% down · 7.5% · 30yr
- Down + closing
- —
- Monthly P&I
- —
- Monthly cashflow
- —
- DSCR
- —
- Eligible?
- —
Personal DTI + credit; lowest rate.
DSCR
20% down · 8.5% · 30yr
- Down + closing
- —
- Monthly P&I
- —
- Monthly cashflow
- —
- DSCR
- —
- Eligible?
- —
No personal income docs; deal must DSCR.
Hard money
10% down · 12.0% · 12mo
- Down + closing
- —
- Monthly P&I
- —
- Monthly cashflow
- —
- DSCR
- —
- Eligible?
- —
Short-term bridge; refi at stabilization.
Rent comps 40 comps
| Address | Beds | Baths | Sqft | Rent | $/sqft | DOM | Units | Dist |
|---|---|---|---|---|---|---|---|---|
| 155 Allen Ave Unit 3 Lynn, MA | 3.0 | 1.0 | 1149 | $2,700 | $2.35 | 18d | 1 | 0.07mi |
| 107 Hollingsworth St Unit 1 Lynn, MA | 3.0 | 1.0 | 1200 | $3,000 | $2.50 | 18d | 1 | 0.14mi |
| 30 Henry Ave Unit 3 Lynn, MA | 3.0 | 1.0 | 1500 | $2,900 | $1.93 | 24d | 1 | 0.25mi |
| 40 Rogers Ave Unit 2 Lynn, MA | 3.0 | 1.0 | 1500 | $3,000 | $2.00 | 15d | 1 | 0.25mi |
| 43 High Rock St Unit 5 Lynn, MA | 3.0 | 1.0 | 1100 | $3,600 | $3.27 | 2d | 1 | 0.27mi |
| 44 High Rock St #1 Lynn, MA | 5.0 | 1.0 | 1800 | $4,000 | $2.22 | 43d | 1 | 0.28mi |
| 94 Rockaway St Unit 1 Lynn, MA | 3.0 | 1.0 | 1150 | $3,000 | $2.61 | 18d | 1 | 0.30mi |
| 9 Rogers Ave Unit 1 Lynn, MA | 4.0 | 1.0 | 1609 | $3,500 | $2.18 | 5d | 1 | 0.30mi |
| 20 Wilson St Unit 3 Lynn, MA | 3.0 | 1.0 | 1200 | $2,900 | $2.42 | 43d | 1 | 0.32mi |
| 89 Johnson St Unit 2 Lynn, MA | 3.0 | 1.0 | 1100 | $3,300 | $3.00 | 24d | 1 | 0.32mi |
| 25 Brimblecom St Unit 1 Lynn, MA | 3.0 | 1.0 | 1164 | $2,900 | $2.49 | 43d | 1 | 0.46mi |
| 31 Ridgeway St Apt 1 Lynn, MA | 3.0 | 1.0 | 1400 | $3,000 | $2.14 | 43d | 1 | 0.47mi |
| 31 Ridgeway St Apt 1 Lynn, MA | 3.0 | 1.0 | 1400 | $3,000 | $2.14 | 15d | 1 | 0.47mi |
| 31 Ridgeway St Apt 1 Lynn, MA | 3.0 | 1.0 | 1400 | $3,000 | $2.14 | 5d | 1 | 0.47mi |
| 43 Adams St Unit 1 Lynn, MA | 3.0 | 1.0 | 1255 | $2,975 | $2.37 | 11d | 1 | 0.48mi |
| 43 Adams St Unit 2 Lynn, MA | 3.0 | 1.0 | 1255 | $2,975 | $2.37 | 2d | 1 | 0.48mi |
| 43 Adams St Unit 1 Lynn, MA | 3.0 | 1.0 | 1255 | $2,975 | $2.37 | 43d | 1 | 0.48mi |
| 10 Forest St Unit 3 Lynn, MA | 3.0 | 1.0 | 1100 | $2,800 | $2.55 | 43d | 1 | 0.54mi |
| 103 Memorial Park Ave Unit 1 Lynn, MA | 3.0 | 1.0 | 1344 | $2,850 | $2.12 | 12d | 1 | 0.57mi |
| 61 Park St Apt 3 Lynn, MA | 3.0 | 1.0 | 2000 | $3,200 | $1.60 | 43d | 1 | 0.60mi |
| 3 Park St Unit 3 Lynn, MA | 3.0 | 1.0 | 2000 | $3,000 | $1.50 | 43d | 1 | 0.65mi |
| 103 Tracy Ave Unit 2 Lynn, MA | 3.0 | 1.0 | 1200 | $3,000 | $2.50 | 43d | 1 | 0.68mi |
| 69 Mall St Unit 2 Lynn, MA | 4.0 | 1.0 | 1250 | $3,300 | $2.64 | 43d | 1 | 0.71mi |
| 65 Moulton St Lynn, MA | 3.0 | 1.0 | 1071 | $1,600 | $1.49 | 18d | 1 | 0.71mi |
| 65 Moulton St Lynn, MA | 3.0 | 1.0 | 1071 | $1,400 | $1.31 | 43d | 1 | 0.71mi |
| 23 Mall St Lynn, MA | 3.0 | 1.0 | 1250 | $2,650 | $2.12 | 5d | 1 | 0.72mi |
| 23 Mall St Unit 12 Lynn, MA | 3.0 | 1.0 | 1250 | $2,650 | $2.12 | 43d | 1 | 0.72mi |
| 23 Mall St Unit 12 Lynn, MA | 3.0 | 1.0 | 1100 | $2,650 | $2.41 | 22d | 1 | 0.72mi |
| 184 Chestnut St Unit 2R Lynn, MA | 3.0 | 1.0 | 1200 | $1,800 | $1.50 | 4d | 1 | 0.73mi |
| 48 Friend St Unit 2 Lynn, MA | 3.0 | 1.0 | 1250 | $2,850 | $2.28 | 15d | 1 | 0.75mi |
| 70 Marianna St Unit 2 Lynn, MA | 3.0 | 1.0 | 1200 | $3,000 | $2.50 | 43d | 1 | 0.80mi |
| 8 Tacoma St Lynn, MA | 3.0 | 2.0 | 1320 | $3,800 | $2.88 | 43d | 1 | 0.80mi |
| 49 N Federal St Apt 3 Lynn, MA | 3.0 | 1.0 | 1464 | $3,000 | $2.05 | 2d | 1 | 0.82mi |
| 347 Summer St Unit 2 Lynn, MA | 4.0 | 2.0 | 1400 | $3,500 | $2.50 | 43d | 1 | 0.83mi |
| 63 Ingalls St Unit 1 Lynn, MA | 3.0 | 1.0 | 1300 | $2,749 | $2.11 | 24d | 1 | 0.85mi |
| 98 Kirtland St Unit 1 Lynn, MA | 3.0 | 1.0 | 1300 | $2,799 | $2.15 | 2d | 1 | 0.91mi |
| 15 Astor St Apt 1 Lynn, MA | 3.0 | 1.0 | 1300 | $2,799 | $2.15 | 16d | 1 | 0.93mi |
| 31 Chestnut St Unit 1 Lynn, MA | 3.0 | 1.0 | 1050 | $2,900 | $2.76 | 24d | 1 | 0.96mi |
| 40 Walter St Unit 1 Lynn, MA | 3.0 | 1.5 | 1843 | $3,849 | $2.09 | 43d | 1 | 0.98mi |
| 83 Neptune St Unit 2 Lynn, MA | 3.0 | 1.0 | 1300 | $3,300 | $2.54 | 24d | 1 | 1.03mi |
Listing history 14 events
-
2026-06-18days on market $509,900 Active 13 DOM
-
2026-06-17days on market $509,900 Active 12 DOM
-
2026-06-16days on market $509,900 Active 11 DOM
-
2026-06-15days on market $509,900 Active 10 DOM
-
2026-06-13days on market $509,900 Active 8 DOM
-
2026-06-13days on market $509,900 Active 7 DOM
-
2026-06-09statusdays on market $509,900 Active 4 DOM
-
2026-06-08days on market $509,900 New 3 DOM
-
2026-06-07pricestatusdays on market $509,900 New 2 DOM
-
2001-08-29soldstatus $203,000 155-char remark
Show marketing remark (155 chars)
NEWLY RENOVATED; NEW WINDOWS, CARPETS, LINO, TILE FLOOR IN 1ST & 2ND BATHS, NEW KITCHEN ON 2ND FL, VYNAL SIDED, TOTALLY VACANT. VACANT. QUICK CLOSING.
-
2001-08-29soldstatus $210,000
Show marketing remark (155 chars)
NEWLY RENOVATED; NEW WINDOWS, CARPETS, LINO, TILE FLOOR IN 1ST & 2ND BATHS, NEW KITCHEN ON 2ND FL, VYNAL SIDED, TOTALLY VACANT. VACANT. QUICK CLOSING.
-
2001-05-16historical 155-char remark
Show marketing remark (155 chars)
NEWLY RENOVATED; NEW WINDOWS, CARPETS, LINO, TILE FLOOR IN 1ST & 2ND BATHS, NEW KITCHEN ON 2ND FL, VYNAL SIDED, TOTALLY VACANT. VACANT. QUICK CLOSING.
-
2001-04-26$219,900 155-char remark
Show marketing remark (155 chars)
NEWLY RENOVATED; NEW WINDOWS, CARPETS, LINO, TILE FLOOR IN 1ST & 2ND BATHS, NEW KITCHEN ON 2ND FL, VYNAL SIDED, TOTALLY VACANT. VACANT. QUICK CLOSING.
-
2001-02-16soldstatus $89,000
ⓘ Source: listings_history table (triggers on properties + properties_extension) + one-shot
backfill from property_details.listing_events for pre-trigger history.
Tax reassessment forecast MA · Partial reset (capped growth)
- Current annual tax
- $5,837 · $486/mo
- Projected year-2 tax
- $6,054 · $505/mo
- Expected delta
- +$217/yr (+$18/mo · 3.7%)
ⓘ Screening estimate from a state-policy table — verify with the county assessor before closing.
Climate risk First Street
- Flood 1/10 Low FEMA zone X (unshaded) · 0% chance over 30 yrs
- Wildfire 1/10 Low
- Heat 6/10 Major 7 d/yr ≥96°F today · 15 d/yr by 30 yrs out
- Wind 6/10 Major 72% chance of damaging wind over 30 yrs
- Air quality 3/10 Moderate 3 unhealthy d/yr today · 3 by 30 yrs out
Nearby sold comps map
Loading sold comps map…
Walkable amenities ~0.75 mi
Loading nearby amenities…
Taxation est. · year 1
- Rental income
- $59,064
- − Mortgage interest
- −$28,562
- − Property taxes
- −$5,837
- − Insurance
- −$2,550
- − Repairs & maintenance
- −$4,725
- − Management
- −$4,725
- − Depreciation
- −$14,833
- Taxable loss
- −$2,169
- Est. tax savings @ 24.0%
- +$520
- After-tax cash flow
- $6,707/yr
For passive investors: Depreciation is non-cash, so a rental often shows a tax loss while cash-flowing — sheltering income. Rental losses are passive: they offset passive income freely, and up to $25,000/yr can offset ordinary (W-2) income if you actively participate and your MAGI is under $100k (phasing out to $0 by $150k); unused losses carry forward. On sale, claimed depreciation is recaptured at up to 25%, and gains may owe capital-gains tax (a 1031 exchange can defer both). Figures are a year-1 estimate at your 24.0% rate — not tax advice; consult a CPA.
Schools (NCES district)
- District
- Lynn
- NCES district ID
- 2507110
- Math proficiency
- 14% ▼ -24.00%
- Reading proficiency
- 25% ▼ -13.00%
- Median HH income
- $46,781
- Composite
- 17.15/100
- National rank
- #9112
- State rank
- #293 of 302 in MA
Livability — Lynn
- Score
- 75/100
- State rank
- #74
- US rank
- #4077
Category grades
Schools grade is shown separately in the Schools card above.
Census & demographics
- Census place
- Lynn, MA
- County
- Essex County · 632,995 people
- City population
- 80,706
- Metro
- Boston-Cambridge-Newton, MA-NH
- Population (ZIP)
- 50,066
- Household income
- $67,046
- Rent vs Own
- Severe rent burden
- 3883.0
Population outlook (Essex County) Hauer SSP2
- Today (2025)
- 840,920 people
- By 2030
- 872,201 · +3.7%
- By 2040
- 927,918 · +10.3%
- By 2050
- 970,206 · +15.4%
- By 2075
- 1,077,993 · +28.2%
- By 2100
- 1,103,053 · +31.2%
Race, ethnicity, and origin ACS 2023
- Neighborhood character
- Diverse neighborhood (Simpson 0.66)
- Race & ethnicity
- Hispanic / Latino 50% White 27% Two or more races 16% Black 12% Asian 6%
- Hispanic origin (detail)
- Mexican 2% Puerto Rican 5% Dominican 18%
- Common ancestry
- Lithuanian 1% Scotch-Irish 1% Hispanic 1%
- Foreign-born
- 42% · Canada, China, Vietnam
- Languages at home
- 40% English-only · Spanish 44% Other Indo-European 5% Other Asian/Pacific 4%
Political lean MEDSL · Essex
- 2024 margin
- Strong D (+20.3) · D 59.2% · R 38.9% · Other 1.9%
- 2008→2024 swing
- 0.0pp no change · 2008: 20.3pp · 2024: 20.3pp
- All cycles
- 2024: D+20.3 2020: D+29.1 2016: D+22.5 2012: D+16.2 2008: D+20.3
Not yet ingested
- Civics
- —
Market trends
- HPI YoY
- ▼ -317.68%
- Current HPI
- 405.3049
- Rent YoY
- ▲ 0.67%
- Metro
- Boston-Cambridge-Newton, MA-NH
- State GDP YoY
- ▲ 2.28%
- F500 in state
- 38
Industry mix (Fortune 500 HQ in MA)
| Industry | F500 HQs | Revenue |
|---|---|---|
| Technology | 3 | $17B |
|
||
| Insurance | 2 | $84B |
|
||
| Retail | 2 | $76B |
|
||
| Life Sciences | 1 | $43B |
|
||
| Energy Technology | 1 | $31B |
|
||
| Aerospace / Defense | 1 | $18B |
|
||
Price history
+136.0% since first listed5 events — show timeline
- 2001-08-29 Sold (Public Records) $210,000 Public Records
- 2001-08-29 Sold (MLS) $203,000 MLS PIN
- 2001-05-16 Listing Removed — MLS PIN
- 2001-04-26 Listed $219,900 MLS PIN
- 2001-02-16 Sold (Public Records) $89,000 Public Records
Property tax history
+5.5%/yrLatest (2023): $5,837 · -2.6% YoY. Source: county tax records.
Cash-flow waterfall
monthlySold comps — $/sqft
last 12 mo · ≤1 miLoading sold comps…