5503 Teakwood Ln · The Woodlands, TX
Flood risk 1/10 · Minimal
- FEMA flood zone
- X (unshaded)
- Chance of flooding over 30 yrs
- 0.0%
- Est. flood insurance / yr
- $507 – $1,088
Fire risk 2/10 · Minimal
- Est. fire insurance / yr
- $1,222 – $2,270
Heat risk 8/10 · Major
- Hot days now (above 111°F)
- 7 days/yr
- Hot days in 30 yrs
- 23 days/yr
Wind risk 8/10 · Major
- Chance of severe wind over 30 yrs
- 99.0%
Air-quality risk 2/10 · Minimal
- Unhealthy air days now
- 2 days/yr
- Unhealthy air days in 30 yrs
- 2 days/yr
Risk factors via First Street. Map © Google.
Why this score? — see what drove the D- grade
The composite is a weighted blend of 9 inputs, each scored 0–100. Each bar is that input's sub-score; the figure is the points it added to the 100-point composite (weight × sub-score).
- Appreciation +10.0/10.0
- ARV discount +9.7/15.0
- Cash flow +4.8/30.0
- Livability +4.5/5.0
- Schools +3.9/10.0
- Rent growth +2.6/5.0
- Condition / age +2.5/5.0
- 1% rule +0.9/10.0
- DSCR +0.0/10.0
$350,000
🖨 Deal sheet 📄 Offer letter ✓ Due diligence
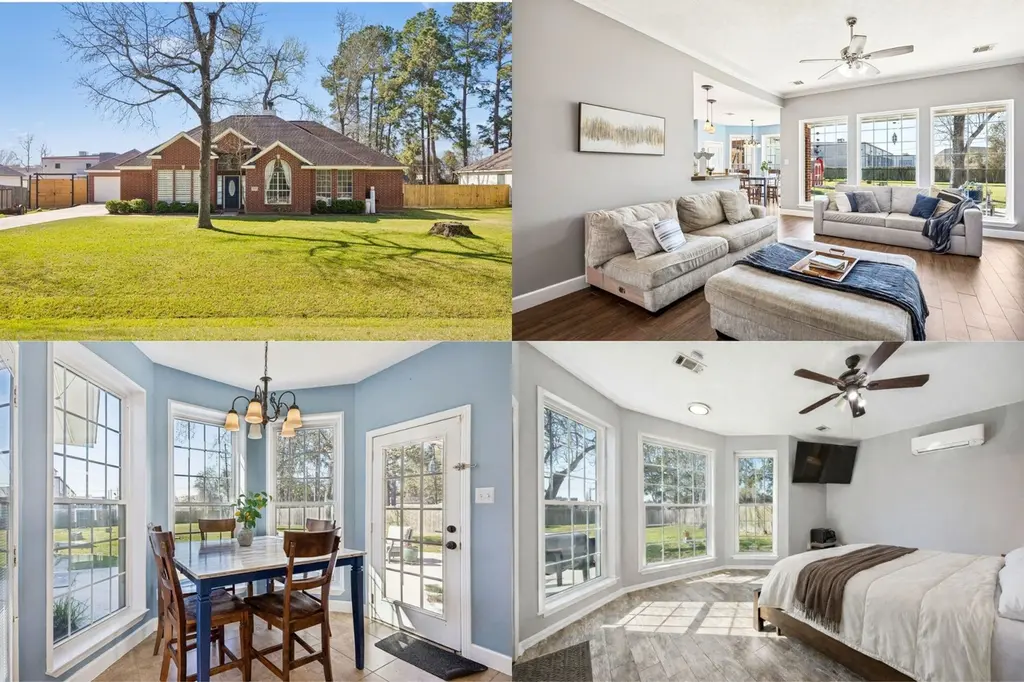
Listing remarks MLS
This beautiful home offers privacy, comfort, and convenience in the peaceful Westwood neighborhood of Magnolia. The spacious split floor plan includes a formal living area, perfect as a flex space, and an open layout connecting the kitchen, breakfast room, and living area, ideal for relaxed gatherings. The cozy living room with a fireplace adds warmth, while the kitchen’s dining space by the window offers natural light and easy access to the back patio. The spacious primary suite features two walk-in closets, a soaking tub, a separate shower, and a bay window. Enjoy direct access to the back patio and a large backyard for outdoor activities. Just minutes from Hwy 249 and TX-99, this home provides easy access to shopping, dining, and entertainment in Tomball and The Woodlands. Westwood is a family-friendly community with parks and highly rated schools. With a long driveway and ample room for entertaining, this home offers both comfort and style. Schedule a showing today to learn more.
Key facts
- Formal living area
- Split floor plan
- Open layout
Tags
Neighborhood map
What this means for you Summary
Snapshot
- This is a 3-bed/2.0-bath single-family listed at $350k.
Deal economics
- At list price, monthly cash flow is $-848 ($-10k/yr) — negative.
- To cash-flow at today's rent, offer at most $200k (42.8% below list).
- To meet the 1% rule (rent ≥ 1% of price), the offer needs to be $205k (41.3% below list).
- Recommended offer: $200k (42.8% below list) — sets the bar for cash-flow.
- Cap rate 3.4% vs local median 2.3% in The Woodlands — top-decile yield for the area; either an underpriced asset or a hidden risk that comps aren't pricing in. Stress-test before assuming the spread holds.
Location & tenants
- Location reads 91/100 on livability (#1 in TX, #47 nationally) — a professional / high-income tenant draw. Strengths: schools A+, amenities A+, commute A+; Watch: cost of living D-.
- Magnolia ISD (rural): math 42% / reading 45% proficiency, ranked #247 of 826 in TX (top 30%) — families likely to look elsewhere, expect single-tenant / working-renter base with shorter leases.
- Market conditions: Rents flat; 1604 active listings in the ZIP; 19 comparable units currently listed for rent nearby; rentals leasing fast (median 5d on market — plan ~1-2 weeks tenant-placement turnaround); high-income renter base; 13,259 units permitted in Montgomery County in 2024 (1,402 in 5+ unit buildings).
Forward outlook
- In year one you build about $37k of equity ($2k loan paydown + $35k appreciation (10.0% local appreciation)).
- Montgomery County population projected at +65% by 2050 — long-run rental-demand tailwind backs the buy-and-hold thesis.
- By year 2, paydown + projected appreciation supports a ~$60k cash-out refi (75% LTV) — recoverable capital for the next deal without selling this one.
Negotiation context
- It's been on market 106 days — a 9% lower offer ($318k) is reasonable based on typical stale-listing flexibility.
- 8 sale attempts since 11y ago with the ask held roughly flat each time — persistent listings suggest the price (not the market) is what's stuck; bring a comps-based counter.
Risks & watch-outs
- Climate carrying-cost: severe wind risk, 99% chance of damaging wind over 30y; extreme-heat days projected 7→23/yr by 2055 (HVAC capex compounding) — expect insurance premiums to compound above CPI over the hold.
Questions for the listing agent
- What do current leases actually rent for vs. the listed asking? Can we see a recent rent roll and the last 12 months of T-12 income?
- It's been on market 106 days. Have you received any prior offers? Is the seller open to a 43% concession, seller financing, or rate buy-down credit?
- What does the HOA fee cover, when was the last increase, and are there any pending special assessments or reserve-fund shortfalls?
- Why hasn't it sold? Are there any deal-killer items the seller is aware of (foundation, flood, title, zoning, code violations)?
- Is there a deadline driving the sale (1031 exchange, divorce, estate, relocation)? That informs how much negotiation room exists.
- Schools are A-rated — typically a magnet for longer-tenancy family renters. What's the average tenant stay here, and is there a school-zone premium baked into asking?
- The area grade is low — what's the realistic commute time and amenity access for the typical tenant pool here? Any planned neighborhood developments (good or bad) we should know about?
- What's the average days-on-market for RENTAL listings here right now (not sales)? A rising rental-DOM trend means longer vacancies and softer asking-rent achievability than the comps imply.
- What's the recent tenant-quality profile in this submarket — average credit score on applications, eviction rate, late-payment / NSF rate, and stable-employment percentage? A property-management company in the area should have these aggregated.
- How much new for-sale + rental construction is in the pipeline within 1–3 miles? Heavy new supply typically softens prices + rents 12–24 months out; constrained supply supports both.
Investment metrics
- 1% rule
- 0.59% ✗
- Cap rate
- 3.38%
- Cash-on-cash
- -10.39%
- DSCR
- 0.54
- GRM
- 14.2
CMA / ARV
- ARV (median comp)
- $368,398
- List price
- $350,000
- Delta
- -4.99%
- Verdict
- FAIR
- Comps
- 20 within 1.0 mi
Show comp detail 12 sales within ~0.75 mi
| Address | Dist | Beds/Ba | Sqft | Sold | Price | $/sf | Match |
|---|---|---|---|---|---|---|---|
| 518 Fairbanks Dr | 0.18mi | 3/2.0 | 1,775 (-1%) | 13mo | $435,000 | $245 | 79 |
| 902 Mesquite Dr | 0.51mi | 3/2.5 | 1,794 (+0%) | 6mo | $299,999 | $167 | 69 |
| 519 Mesquite Dr | 0.24mi | 3/2.0 | 1,651 (-8%) | 8mo | $310,000 | $188 | 69 |
| 5815 Weisinger Dr | 0.36mi | 4/2.0 (+1) | 1,871 (+4%) | 3mo | $359,900 | $192 | 68 |
| 715 Westwood North Dr | 0.38mi | 3/2.5 | 1,952 (+9%) | 1mo | $359,000 | $184 | 64 |
| 6010 Mahogany Way | 0.52mi | 3/2.5 | 1,827 (+2%) | 12mo | $367,500 | $201 | 61 |
| 923 Garrett Dr | 0.67mi | 3/2.0 | 1,838 (+2%) | 11mo | $369,000 | $201 | 56 |
| 33319 Lago Vista Real Dr | 0.66mi | 3/2.0 | 1,922 (+7%) | 4mo | $625,000 | $325 | 54 |
| 5906 Sugar Bush Dr | 0.73mi | 3/2.0 | 1,886 (+5%) | 7mo | $364,000 | $193 | 51 |
| 6111 Weisinger Drive Dr | 0.60mi | 3/2.0 | 1,995 (+11%) | 9mo | $409,900 | $205 | 46 |
| 515 Box Elder Dr | 0.54mi | 3/2.0 | 2,048 (+14%) | 8mo | $399,000 | $195 | 44 |
| 914 Shadberry Dr | 0.55mi | 4/2.5 (+1) | 2,056 (+15%) | 12mo | $370,000 | $180 | 33 |
Match score weights: distance 35% · size 25% · config 20% · recency 20%. Top-matched comps best support the ARV.
Projected returns pro-forma
10.0% appreciation · 0.32% rent growth · sell at horizon
- IRR
- 16.4%
- Equity multiple
- 2.34×
- Total profit
- $131,266
- Equity at exit
- $315,308
- IRR
- 15.3%
- Equity multiple
- 5.28×
- Total profit
- $419,374
- Equity at exit
- $679,973
Cash invested: $98,000 (down + closing). Projections, not guarantees.
Landlord ↔ Tenant lean methodology
- Overall (STATE)
- 87 Strongly Landlord-Friendly
- State Texas
- 87 Strongly Landlord-Friendly · R+5
- County
- — inherits STATE
- City
- — inherits STATE
ZIP-level market 77354
- Home prices YoY
- 2.4%
- Rents YoY
- 0.3%
- Active inventory
- 1604
- Price-to-rent
- 14.2×
Monthly cashflow live
- Estimated rent
- $2,054 high interval (Pro) →
- Mortgage (P&I)
- −$1,835
- Tax from tax record
- −$468 /mo · $5,621/yr
- Insurance
- −$146
- HOA
- −$21
- Vacancy / Maint / Mgmt
- −$431
- Net cashflow
- $-848
Break-even live
UW: 25.0% down · 7.5% · 30yr · 1.5% tax · 5.0% vac · 8.0% maint · 8.0% mgmt
Financing live
Cash to close
- Down payment
- $87,500
- Closing costs
- $10,500
- Reserves months
- —
- Total cash needed
- —
Loan-product check · same deal, 3 products live
Conventional
25% down · 7.5% · 30yr
- Down + closing
- —
- Monthly P&I
- —
- Monthly cashflow
- —
- DSCR
- —
- Eligible?
- —
Personal DTI + credit; lowest rate.
DSCR
20% down · 8.5% · 30yr
- Down + closing
- —
- Monthly P&I
- —
- Monthly cashflow
- —
- DSCR
- —
- Eligible?
- —
No personal income docs; deal must DSCR.
Hard money
10% down · 12.0% · 12mo
- Down + closing
- —
- Monthly P&I
- —
- Monthly cashflow
- —
- DSCR
- —
- Eligible?
- —
Short-term bridge; refi at stabilization.
Rent comps 19 comps
| Address | Beds | Baths | Sqft | Rent | $/sqft | DOM | Units | Dist |
|---|---|---|---|---|---|---|---|---|
| 5402 Farm to Market Road 1488 #3174 Magnolia, TX | 3.0 | 2.0 | 1312 | $1,695 | $1.29 | 11d | 1 | 0.25mi |
| 5402 Farm to Market Road 1488 #5435 Magnolia, TX | 3.0 | 2.0 | 1312 | $1,720 | $1.31 | 43d | 1 | 0.25mi |
| 5402 Farm to Market Road 1488 #3228 Magnolia, TX | 3.0 | 2.0 | 1312 | $1,652 | $1.26 | 2d | 1 | 0.25mi |
| 5408 Farm to Market Road 1488 Unit 1488 The Woodlands, TX | 3.0 | 2.0 | 1312 | $1,675 | $1.28 | 43d | 1 | 0.27mi |
| 340 Watermere Dr Conroe, TX | 1.0–3.0 | 1.0–2.5 | 1307 | $2,500 | $1.91 | 5d | 22 | 0.58mi |
| 300 Enclave Dr Conroe, TX | 1.0–3.0 | 1.0–2.0 | 1128 | $1,779 | $1.58 | 1d | 14 | 0.61mi |
| 15770 Old Conroe Rd Conroe, TX | 1.0–3.0 | 1.0–2.0 | 992 | $2,457 | $2.48 | 2d | 25 | 0.65mi |
| 33150 Willow Heights Ln Magnolia, TX | 4.0 | 2.5 | 1896 | $2,270 | $1.20 | 5d | 1 | 0.85mi |
| 33146 Willow Heights Ln Magnolia, TX | 4.0 | 2.5 | 1896 | $2,270 | $1.20 | 5d | 1 | 0.85mi |
| 33154 Oak Heights Pl Magnolia, TX | 4.0 | 2.5 | 1896 | $2,345 | $1.24 | 17d | 1 | 0.86mi |
| 33154 Oak Heights Pl Magnolia, TX | 4.0 | 2.5 | 1896 | $2,345 | $1.24 | 22d | 1 | 0.86mi |
| 33154 Oak Heights Pl Magnolia, TX | 3.0–4.0 | 2.5 | 1812 | $2,195 | $1.21 | 5d | 7 | 0.86mi |
| 33130 Oak Heights Pl Magnolia, TX | 4.0 | 2.5 | 1896 | $2,270 | $1.20 | 5d | 1 | 0.88mi |
| 135 N Wynnoak Cir Spring, TX | 3.0 | 2.0 | 1690 | $2,150 | $1.27 | 43d | 1 | 0.89mi |
| 33139 Oak Heights Pl Magnolia, TX | 4.0 | 2.5 | 1896 | $2,270 | $1.20 | 5d | 1 | 0.89mi |
| 33123 Oak Heights Pl Magnolia, TX | 4.0 | 2.5 | 1896 | $2,270 | $1.20 | 5d | 1 | 0.90mi |
| 10333 Research Forest Dr Unit 10366 Magnolia, TX | 3.0 | 2.0 | 1377 | $2,372 | $1.72 | 10d | 1 | 1.16mi |
| 10333 Research Forest Dr Unit 3228 Magnolia, TX | 3.0 | 2.0 | 1377 | $2,340 | $1.70 | 2d | 1 | 1.16mi |
| 10333 Research Forest Dr Unit 3047 Magnolia, TX | 3.0 | 2.0 | 1377 | $2,383 | $1.73 | 11d | 1 | 1.28mi |
HOA detail
- Monthly dues
- $21 · $252/yr
Listing history 44 events
-
2026-06-18days on market $350,000 Active 106 DOM
-
2026-06-17days on market $350,000 Active 105 DOM
-
2026-06-16days on market $350,000 Active 104 DOM
-
2026-06-15days on market $350,000 Active 103 DOM
-
2026-06-13days on market $350,000 Active 101 DOM
-
2026-06-09days on market $350,000 Active 97 DOM
-
2026-06-08days on market $350,000 Active 96 DOM
-
2026-06-07days on market $350,000 Active 95 DOM
-
2026-06-04days on market $350,000 Active 92 DOM
-
2026-06-03days on market $350,000 Active 91 DOM
-
2026-06-02days on market $350,000 Active 90 DOM
-
2026-06-01days on market $350,000 Active 89 DOM
-
2026-05-31days on market $350,000 Active 88 DOM
-
2026-03-04$350,000 Active 1004-char remark
Show marketing remark (1004 chars)
This beautiful home offers privacy, comfort, and convenience in the peaceful Westwood neighborhood of Magnolia. The spacious split floor plan includes a formal living area, perfect as a flex space, and an open layout connecting the kitchen, breakfast room, and living area, ideal for relaxed gatherings. The cozy living room with a fireplace adds warmth, while the kitchen’s dining space by the window offers natural light and easy access to the back patio. The spacious primary suite features two walk-in closets, a soaking tub, a separate shower, and a bay window. Enjoy direct access to the back patio and a large backyard for outdoor activities. Just minutes from Hwy 249 and TX-99, this home provides easy access to shopping, dining, and entertainment in Tomball and The Woodlands. Westwood is a family-friendly community with parks and highly rated schools. With a long driveway and ample room for entertaining, this home offers both comfort and style. Schedule a showing today to learn more.
-
2025-12-09historical
-
2025-11-10$399,900 Active
-
2025-11-09historical
-
2025-08-26$399,900 Active
-
2025-08-25historical
-
2025-08-13$414,900 Active
-
2022-07-11soldstatus
-
2022-07-08soldstatus Sold
-
2022-05-24status Pending
-
2022-05-20status Option Pending
-
2022-05-19$375,000 Active
-
2020-03-23soldstatus Sold
-
2020-03-23soldstatus
-
2020-03-08status Pending
-
2020-02-27status Option Pending
-
2020-02-10$249,000 Active
-
2019-03-22soldstatus
-
2015-09-25soldstatus
-
2015-09-24soldstatus Sold
-
2015-08-25status Pending
-
2015-08-14status Option Pending
-
2015-07-16price $210,000
-
2015-06-30price $215,000
-
2015-06-22price $217,000
-
2015-06-22status Active
-
2015-06-21status Option Pending
-
2015-05-07$219,600 Active
-
2005-06-20soldstatus
-
2005-06-20soldstatus
-
1999-07-26soldstatus
ⓘ Source: listings_history table (triggers on properties + properties_extension) + one-shot
backfill from property_details.listing_events for pre-trigger history.
Tax reassessment forecast TX · Resets to sale price
- Current annual tax
- $5,621 · $468/mo
- Projected year-2 tax
- $6,405 · $534/mo
- Expected delta
- +$784/yr (+$65/mo · 14.0%)
ⓘ Screening estimate from a state-policy table — verify with the county assessor before closing.
Climate risk First Street
- Flood 1/10 Low FEMA zone X (unshaded) · 0% chance over 30 yrs
- Wildfire 2/10 Low
- Heat 8/10 Severe 7 d/yr ≥111°F today · 23 d/yr by 30 yrs out
- Wind 8/10 Severe 99% chance of damaging wind over 30 yrs
- Air quality 2/10 Low 2 unhealthy d/yr today · 2 by 30 yrs out
Nearby sold comps map
Loading sold comps map…
Walkable amenities ~0.75 mi
Loading nearby amenities…
Taxation est. · year 1
- Rental income
- $24,645
- − Mortgage interest
- −$19,605
- − Property taxes
- −$5,621
- − Insurance
- −$1,750
- − Repairs & maintenance
- −$1,972
- − Management
- −$1,972
- − HOA
- −$252
- − Depreciation
- −$10,182
- Taxable loss
- −$16,708
- Est. tax savings @ 24.0%
- +$4,010
- After-tax cash flow
- $-6,169/yr
For passive investors: Depreciation is non-cash, so a rental often shows a tax loss while cash-flowing — sheltering income. Rental losses are passive: they offset passive income freely, and up to $25,000/yr can offset ordinary (W-2) income if you actively participate and your MAGI is under $100k (phasing out to $0 by $150k); unused losses carry forward. On sale, claimed depreciation is recaptured at up to 25%, and gains may owe capital-gains tax (a 1031 exchange can defer both). Figures are a year-1 estimate at your 24.0% rate — not tax advice; consult a CPA.
Schools (NCES district)
- District
- Magnolia ISD
- NCES district ID
- 4828740
- Math proficiency
- 42% ▼ -7.00%
- Reading proficiency
- 45% ▼ -4.00%
- Median HH income
- $71,692
- Composite
- 39.46/100
- National rank
- #3958
- State rank
- #247 of 826 in TX
Livability — The Woodlands
- Score
- 91/100
- State rank
- #1
- US rank
- #47
Category grades
Schools grade is shown separately in the Schools card above.
Census & demographics
- County
- Montgomery County · 663,713 people
- City population
- 106,505
- Metro
- Houston-The Woodlands-Sugar Land, TX
- Population (ZIP)
- 44,900
- Household income
- $112,504
- Rent vs Own
- Severe rent burden
- 586.0
Population outlook (Montgomery County) Hauer SSP2
- Today (2025)
- 713,896 people
- By 2030
- 805,263 · +12.8%
- By 2040
- 992,708 · +39.1%
- By 2050
- 1,179,590 · +65.2%
- By 2075
- 1,628,084 · +128.1%
- By 2100
- 1,937,880 · +171.5%
Race, ethnicity, and origin ACS 2023
- Neighborhood character
- Predominantly White (66%)
- Race & ethnicity
- White 66% Hispanic / Latino 25% Two or more races 18% Black 3% Asian 1%
- Hispanic origin (detail)
- Mexican 14% Puerto Rican 1%
- Common ancestry
- Lithuanian 4% Slovak 2% Italian 2%
- Foreign-born
- 11% · Canada, Vietnam
- Languages at home
- 83% English-only · Spanish 15% Other Indo-European 1% German/W. Germanic 1%
Political lean MEDSL · Montgomery
- 2024 margin
- Solid R (+45.5) · D 26.8% · R 72.3%
- 2008→2024 swing
- +7.2pp toward D · 2008: -52.7pp · 2024: -45.5pp
- All cycles
- 2024: R+45.5 2020: R+43.8 2016: R+51.4 2012: R+60.7 2008: R+52.7
Not yet ingested
- Civics
- —
Market trends
- HPI YoY
- ▲ 12.09%
- Current HPI
- 512.87
- Rent YoY
- ▲ 0.32%
- Metro
- Houston-The Woodlands-Sugar Land, TX
- State GDP YoY
- ▲ 3.95%
- F500 in state
- 110
Industry mix (Fortune 500 HQ in TX)
| Industry | F500 HQs | Revenue |
|---|---|---|
| Energy | 16 | $1,198B |
|
||
| Technology | 5 | $198B |
|
||
| Engineering / Construction | 4 | $72B |
|
||
| Energy Services | 3 | $60B |
|
||
| Utilities | 3 | $41B |
|
||
| Healthcare | 2 | $330B |
|
||
Price history
+59.4% since first listed31 events — show timeline
- 2026-03-04 Listed $350,000 HARMLS
- 2025-12-09 Listing Removed — HARMLS
- 2025-11-10 Listed $399,900 HARMLS
- 2025-11-09 Listing Removed — HARMLS
- 2025-08-26 Listed $399,900 HARMLS
- 2025-08-25 Listing Removed — HARMLS
- 2025-08-13 Listed $414,900 HARMLS
- 2022-07-11 Sold (Public Records) — Public Records
- 2022-07-08 Sold (MLS) — HARMLS
- 2022-05-24 Pending — HARMLS
- 2022-05-20 Pending — HARMLS
- 2022-05-19 Listed $375,000 HARMLS
- 2020-03-23 Sold (Public Records) — Public Records
- 2020-03-23 Sold (MLS) — HARMLS
- 2020-03-08 Pending — HARMLS
- 2020-02-27 Pending — HARMLS
- 2020-02-10 Listed $249,000 HARMLS
- 2019-03-22 Sold (Public Records) — Public Records
- 2015-09-25 Sold (Public Records) — Public Records
- 2015-09-24 Sold (MLS) — HARMLS
- 2015-08-25 Pending — HARMLS
- 2015-08-14 Pending — HARMLS
- 2015-07-16 Price Changed $210,000 HARMLS
- 2015-06-30 Price Changed $215,000 HARMLS
- 2015-06-22 Price Changed $217,000 HARMLS
- 2015-06-22 Relisted — HARMLS
- 2015-06-21 Pending — HARMLS
- 2015-05-07 Listed $219,600 HARMLS
- 2005-06-20 Sold (Public Records) — Public Records
- 2005-06-20 Sold (Public Records) — Public Records
- 1999-07-26 Sold (Public Records) — Public Records
Property tax history
+3.4%/yrLatest (2025): $5,621 · -0.9% YoY. Source: county tax records.
Cash-flow waterfall
monthlySold comps — $/sqft
last 12 mo · ≤1 miLoading sold comps…