16741 Briceland Rd · Shelter Cove, CA
Flood risk 1/10 · Minimal
- FEMA flood zone
- X (unshaded)
- Chance of flooding over 30 yrs
- 0.0%
- Est. flood insurance / yr
- $507 – $1,088
Fire risk 5/10 · Moderate
- Est. fire insurance / yr
- $659 – $1,223
Heat risk 3/10 · Minor
- Hot days now (above 84°F)
- 10 days/yr
- Hot days in 30 yrs
- 26 days/yr
Wind risk 1/10 · Minimal
- Chance of severe wind over 30 yrs
- —
Air-quality risk 10/10 · Severe
- Unhealthy air days now
- 22 days/yr
- Unhealthy air days in 30 yrs
- 25 days/yr
Risk factors via First Street. Map © Google.
Why this score? — see what drove the C- grade
The composite is a weighted blend of 9 inputs, each scored 0–100. Each bar is that input's sub-score; the figure is the points it added to the 100-point composite (weight × sub-score).
- Cash flow +22.0/30.0
- ARV discount +7.5/15.0
- DSCR +7.1/10.0
- 1% rule +5.8/10.0
- Schools +3.1/10.0
- Rent growth +2.5/5.0
- Livability +2.3/5.0
- Condition / age +2.2/5.0
- Appreciation +0.0/10.0
$150,000
🖨 Deal sheet 📄 Offer letter ✓ Due diligence
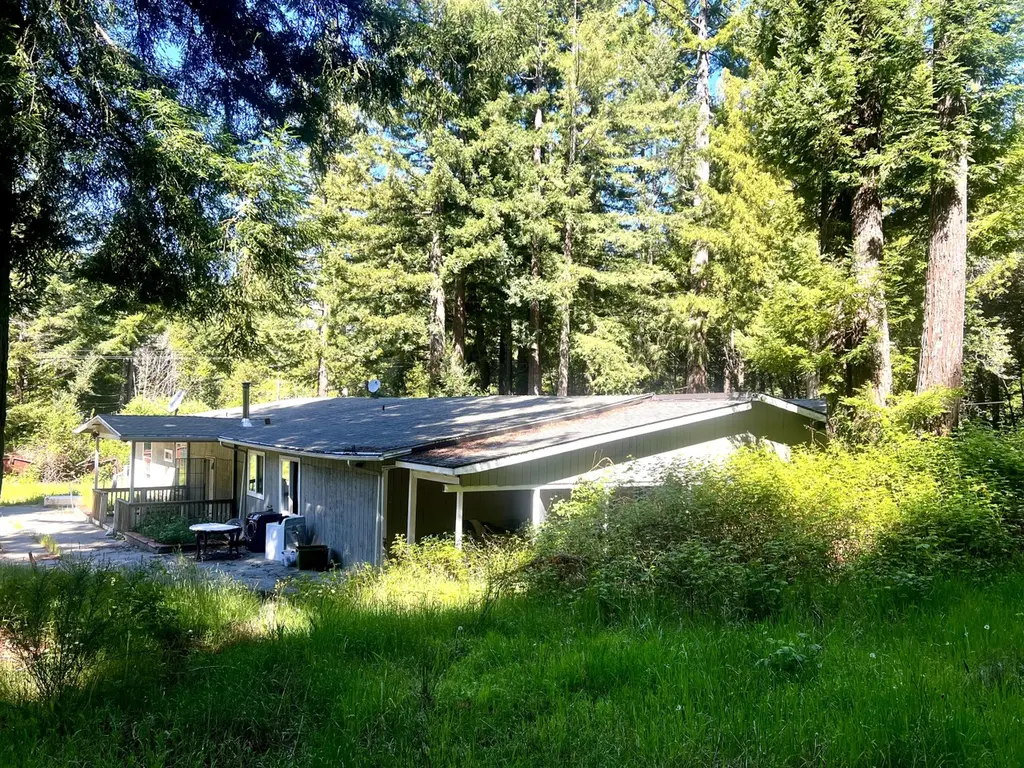
Listing remarks
Beautiful parcel with Redwood Trees. The modular home is large but not in good condition. There is a large shop attached to the back of the house that is pretty nice. It has about 1800 square feet. It could be a way for a family to get started at this price.
Key facts
- Redwood trees
- Large shop
- 1.9 acre lot
Tags
Property features AI
Exterior
- Parking: Gravel parking; RV access/parking
- Utilities: Private spring water source; Electricity connected; Private sewer
- Home design: Single-family residence; One story; Irregular-shaped lot; Facing direction not specified
- Construction: Wood siding; Shingle roof; Pillar/post/pier foundation; Built year not specified
- Exterior features: Partial fencing; Property has a view; Insulation (energy efficiency); Horses allowed; Road surfaces: concrete and gravel; Publicly maintained road access
Interior
- Bedrooms: 7 total rooms (bedroom count not specified)
- Flooring: Vinyl
- Heating & cooling: Wood stove heating
- Interior features: Cathedral ceilings; Vaulted ceilings; Double-pane windows
- Laundry & utility: Washer hookup
Neighborhood map
What this means for you Summary
Snapshot
- This is a 3-bed/2.0-bath single-family listed at $150k. Condition is rated fair.
Deal economics
- At list price, monthly cash flow is $240 ($3k/yr) — positive.
- The deal already cash-flows at list — no discount required.
- Meets the 1% rule at list price ($2k rent vs $150k).
- Recommended offer: $148k (1.5% below list) — sets the bar for market timing.
- Cap rate 8.2% vs local median 1.6% in Shelter Cove — top-decile yield for the area; either an underpriced asset or a hidden risk that comps aren't pricing in. Stress-test before assuming the spread holds.
Location & tenants
- Location reads 46/100 on livability (#1,268 in CA) — a working-class tenant base; expect higher turnover. Watch: health & safety C-, schools D+, housing D.
- Southern Humboldt Joint Unified (rural): math 28% / reading 41% proficiency, ranked #928 of 1,400 in CA (top 66%) — families likely to look elsewhere, expect single-tenant / working-renter base with shorter leases.
- Market conditions: 168 active listings in the ZIP; 188 units permitted in Humboldt County in 2024 (17 in 5+ unit buildings).
Forward outlook
- Local home prices are declining (-3.0%/yr); year-one equity from $1k of loan paydown is wiped out by about $4k of value loss. Plan a longer hold.
- Humboldt County population projected to shrink 4% by 2050 — rents likely to lag national; underwrite the cash flow, not the appreciation.
Negotiation context
- It's been on market 15 days — a 2% lower offer ($148k) is reasonable based on typical stale-listing flexibility.
Risks & watch-outs
- Climate carrying-cost: moderate wildfire risk — expect insurance premiums to compound above CPI over the hold.
Questions for the listing agent
- Have any recent inspections been done? Can we get a copy of the seller's disclosures and any deferred-maintenance estimates?
- Is there a deadline driving the sale (1031 exchange, divorce, estate, relocation)? That informs how much negotiation room exists.
- Schools are D-rated, which usually means shorter tenancies and higher turnover. Who's the typical renter profile here, and what's been the actual vacancy rate?
- Crime grade is F in this area — have there been break-ins, vandalism, or insurance claims at this property in the last 3 years? What carrier currently insures it and at what premium?
- What's the average days-on-market for RENTAL listings here right now (not sales)? A rising rental-DOM trend means longer vacancies and softer asking-rent achievability than the comps imply.
- What's the recent tenant-quality profile in this submarket — average credit score on applications, eviction rate, late-payment / NSF rate, and stable-employment percentage? A property-management company in the area should have these aggregated.
- How much new for-sale + rental construction is in the pipeline within 1–3 miles? Heavy new supply typically softens prices + rents 12–24 months out; constrained supply supports both.
Investment metrics
- 1% rule
- 1.08% ✓
- Cap rate
- 8.21%
- Cash-on-cash
- 6.86%
- DSCR
- 1.31
- GRM
- 7.7
CMA / ARV
- ARV (on-the-fly)
- $448,400
- Comps found
- 1
Show comp detail 1 sale within ~0.75 mi
| Address | Dist | Beds/Ba | Sqft | Sold | Price | $/sf | Match |
|---|---|---|---|---|---|---|---|
| 250 Gibson Creek Rd | 0.41mi | 3/2.0 | 1,800 (-5%) | 1mo | $425,000 | $236 | 71 |
Match score weights: distance 35% · size 25% · config 20% · recency 20%. Top-matched comps best support the ARV.
Projected returns pro-forma
-3.0% appreciation · 3.0% rent growth · sell at horizon
- IRR
- -5.8%
- Equity multiple
- 0.79×
- Total profit
- $-8,990
- Equity at exit
- $22,365
- IRR
- 3.9%
- Equity multiple
- 1.28×
- Total profit
- $11,961
- Equity at exit
- $12,969
Cash invested: $42,000 (down + closing). Projections, not guarantees.
Landlord ↔ Tenant lean methodology
- Overall (STATE)
- 18 Strongly Tenant-Friendly
- State California
- 18 Strongly Tenant-Friendly · D+13
- County
- — inherits STATE
- City
- — inherits STATE
ZIP-level market 95589
- Home prices YoY
- -34.2%
- Active inventory
- 168
- Price-to-rent
- 7.7×
Monthly cashflow live
- Estimated rent
- $1,616 medium interval (Pro) →
- Mortgage (P&I)
- −$787
- Tax est. 1.5%
- −$188 /mo · $2,250/yr
- Insurance
- −$62
- HOA
- −$0
- Vacancy / Maint / Mgmt
- −$339
- Net cashflow
- $240
Break-even live
UW: 25.0% down · 7.5% · 30yr · 1.5% tax · 5.0% vac · 8.0% maint · 8.0% mgmt
Financing live
Cash to close
- Down payment
- $37,500
- Closing costs
- $4,500
- Reserves months
- —
- Total cash needed
- —
Loan-product check · same deal, 3 products live
Conventional
25% down · 7.5% · 30yr
- Down + closing
- —
- Monthly P&I
- —
- Monthly cashflow
- —
- DSCR
- —
- Eligible?
- —
Personal DTI + credit; lowest rate.
DSCR
20% down · 8.5% · 30yr
- Down + closing
- —
- Monthly P&I
- —
- Monthly cashflow
- —
- DSCR
- —
- Eligible?
- —
No personal income docs; deal must DSCR.
Hard money
10% down · 12.0% · 12mo
- Down + closing
- —
- Monthly P&I
- —
- Monthly cashflow
- —
- DSCR
- —
- Eligible?
- —
Short-term bridge; refi at stabilization.
Listing history 6 events
-
2026-06-19days on market $150,000 Active 15 DOM
-
2026-06-18days on market $150,000 Active 14 DOM
-
2026-06-17days on market $150,000 Active 13 DOM
-
2026-06-17status $150,000 Active 12 DOM
-
2026-05-31statusdays on market $150,000 Pending 12 DOM
-
2026-05-18$150,000 Active
ⓘ Source: listings_history table (triggers on properties + properties_extension) + one-shot
backfill from property_details.listing_events for pre-trigger history.
Climate risk First Street
- Flood 1/10 Low FEMA zone X (unshaded) · 0% chance over 30 yrs
- Wildfire 5/10 Major
- Heat 3/10 Moderate 10 d/yr ≥84°F today · 26 d/yr by 30 yrs out
- Wind 1/10 Low
- Air quality 10/10 Extreme 22 unhealthy d/yr today · 25 by 30 yrs out
Nearby sold comps map
Loading sold comps map…
Walkable amenities ~0.75 mi
Loading nearby amenities…
Taxation est. · year 1
- Rental income
- $19,393
- − Mortgage interest
- −$8,402
- − Property taxes
- −$2,250
- − Insurance
- −$750
- − Repairs & maintenance
- −$1,551
- − Management
- −$1,551
- − Depreciation
- −$4,364
- Taxable income
- $524
- Est. tax owed @ 24.0%
- −$126
- After-tax cash flow
- $2,755/yr
For passive investors: Depreciation is non-cash, so a rental often shows a tax loss while cash-flowing — sheltering income. Rental losses are passive: they offset passive income freely, and up to $25,000/yr can offset ordinary (W-2) income if you actively participate and your MAGI is under $100k (phasing out to $0 by $150k); unused losses carry forward. On sale, claimed depreciation is recaptured at up to 25%, and gains may owe capital-gains tax (a 1031 exchange can defer both). Figures are a year-1 estimate at your 24.0% rate — not tax advice; consult a CPA.
Condition & rehab AI · 6 photos
The home is in fair condition with significant repairs and maintenance needed. The roof, exterior siding, flooring, interior walls, paint, HVAC, mechanical systems, foundation, and structure are all in poor condition. The landscaping and curb appeal are also poor. The highest-ROI updates would be to paint the exterior and interior, repair and replace the roof, HVAC and mechanical systems, landscape and maintain the property, repair and replace the flooring, foundation and structure, exterior siding, and interior walls and paint.
Repairs flagged
- Major roof — The roof appears to be in poor condition, with visible wear and tear.
- Major exterior siding — The exterior siding shows signs of weathering and discoloration.
- Major flooring — The flooring appears to be in poor condition, with visible wear and tear.
- Major interior walls/paint — The interior walls and paint show signs of wear and tear.
- Major landscaping/curb appeal — The landscaping and curb appeal are poor, with overgrown vegetation and a lack of maintenance.
- Major HVAC/mechanicals — The HVAC and mechanical systems appear to be in poor condition, with visible wear and tear.
- Major foundation/structure — The foundation and structure appear to be in poor condition, with visible wear and tear.
Value-add opportunities
- Both paint the exterior and interior — Painting the exterior and interior will improve the curb appeal and the overall condition of the home.
- Both repair and replace the roof — Repairing and replacing the roof will improve the structural integrity and the overall condition of the home.
- Both repair and replace the HVAC and mechanical systems — Repairing and replacing the HVAC and mechanical systems will improve the comfort and energy efficiency of the home.
- Both landscape and maintain the property — Landscape and maintain the property will improve the curb appeal and the overall condition of the home.
- Both repair and replace the flooring — Repairing and replacing the flooring will improve the comfort and the overall condition of the home.
- Both repair and replace the foundation and structure — Repairing and replacing the foundation and structure will improve the structural integrity and the overall condition of the home.
- Both repair and replace the exterior siding — Repairing and replacing the exterior siding will improve the curb appeal and the overall condition of the home.
- Both repair and replace the interior walls and paint — Repairing and replacing the interior walls and paint will improve the comfort and the overall condition of the home.
Renovation cost estimate screening
| Repair item | Severity | Est. cost |
|---|---|---|
| roof · The roof appears to be in poor condition, with visible wear and tear. | Major | $15,000–50,000 |
| exterior siding · The exterior siding shows signs of weathering and discoloration. | Major | $15,000–50,000 |
| flooring · The flooring appears to be in poor condition, with visible wear and tear. | Major | $15,000–50,000 |
| interior walls/paint · The interior walls and paint show signs of wear and tear. | Major | $15,000–50,000 |
| landscaping/curb appeal · The landscaping and curb appeal are poor, with overgrown vegetation and a lack of maintenance. | Major | $15,000–50,000 |
| HVAC/mechanicals · The HVAC and mechanical systems appear to be in poor condition, with visible wear and tear. | Major | $15,000–50,000 |
| foundation/structure · The foundation and structure appear to be in poor condition, with visible wear and tear. | Major | $15,000–50,000 |
| Total estimated repair cost · 7 items | $105,000–350,000 |
Value-add ROI direction
- Both paint the exterior and interior — Painting the exterior and interior will improve the curb appeal and the overall condition of the home. ↑
- Both repair and replace the roof — Repairing and replacing the roof will improve the structural integrity and the overall condition of the home. ↑
- Both repair and replace the HVAC and mechanical systems — Repairing and replacing the HVAC and mechanical systems will improve the comfort and energy efficiency of the home. ↑
- Both landscape and maintain the property — Landscape and maintain the property will improve the curb appeal and the overall condition of the home. ↑
- Both repair and replace the flooring — Repairing and replacing the flooring will improve the comfort and the overall condition of the home. ↑
- Both repair and replace the foundation and structure — Repairing and replacing the foundation and structure will improve the structural integrity and the overall condition of the home. ↑
- Both repair and replace the exterior siding — Repairing and replacing the exterior siding will improve the curb appeal and the overall condition of the home. ↑
- Both repair and replace the interior walls and paint — Repairing and replacing the interior walls and paint will improve the comfort and the overall condition of the home. ↑
ⓘ Cost ranges are severity-bucket heuristics (US national rule-of-thumb). Get contractor quotes + a written scope before underwriting a rehab budget.
Schools (NCES district)
- District
- Southern Humboldt Joint Unified
- NCES district ID
- 0637590
- Math proficiency
- 28% ▲ 1.00%
- Reading proficiency
- 41% ▲ 2.00%
- Median HH income
- $38,108
- Composite
- 31.43/100
- National rank
- #11197
- State rank
- #928 of 1400 in CA
Livability — Shelter Cove
- Score
- 46/100
- State rank
- #1268
- US rank
- #26424
Category grades
Schools grade is shown separately in the Schools card above.
Census & demographics
- Population (ZIP)
- 1,467
Population outlook (Humboldt County) Hauer SSP2
- Today (2025)
- 135,550 people
- By 2030
- 134,798 · -0.6%
- By 2040
- 132,222 · -2.5%
- By 2050
- 130,850 · -3.5%
- By 2075
- 128,656 · -5.1%
- By 2100
- 120,238 · -11.3%
Race, ethnicity, and origin ACS 2023
- Neighborhood character
- Predominantly White (77%)
- Race & ethnicity
- White 77% Hispanic / Latino 12% Two or more races 8% Black 3%
- Hispanic origin (detail)
- Mexican 11%
- Common ancestry
- Romanian 7% Italian 5% Serbian 1%
- Foreign-born
- 9% · Canada
- Languages at home
- 85% English-only · Spanish 10% Other Indo-European 5%
Political lean MEDSL · Humboldt
- 2024 margin
- Strong D (+28.4) · D 62.0% · R 33.6% · Other 4.5%
- 2008→2024 swing
- +0.2pp no change · 2008: 28.2pp · 2024: 28.4pp
- All cycles
- 2024: D+28.4 2020: D+33.4 2016: D+25.9 2012: D+26.2 2008: D+28.2
Not yet ingested
- Civics
- —
Market trends
- HPI YoY
- ▼ -55.58%
- Current HPI
- 107.0105
- Rent YoY
- —
- Metro
- —
- State GDP YoY
- ▲ 3.21%
- F500 in state
- 116
Industry mix (Fortune 500 HQ in CA)
| Industry | F500 HQs | Revenue |
|---|---|---|
| Technology | 27 | $1,492B |
|
||
| Financial Services | 3 | $174B |
|
||
| Retail | 3 | $44B |
|
||
| Insurance | 3 | $26B |
|
||
| Media / Entertainment | 2 | $115B |
|
||
| Pharmaceuticals / Biotech | 2 | $62B |
|
||
Price history
1 event — show timeline
- 2026-05-18 Listed $150,000 HAR
Cash-flow waterfall
monthlySold comps — $/sqft
last 12 mo · ≤1 miLoading sold comps…