 Multi-family
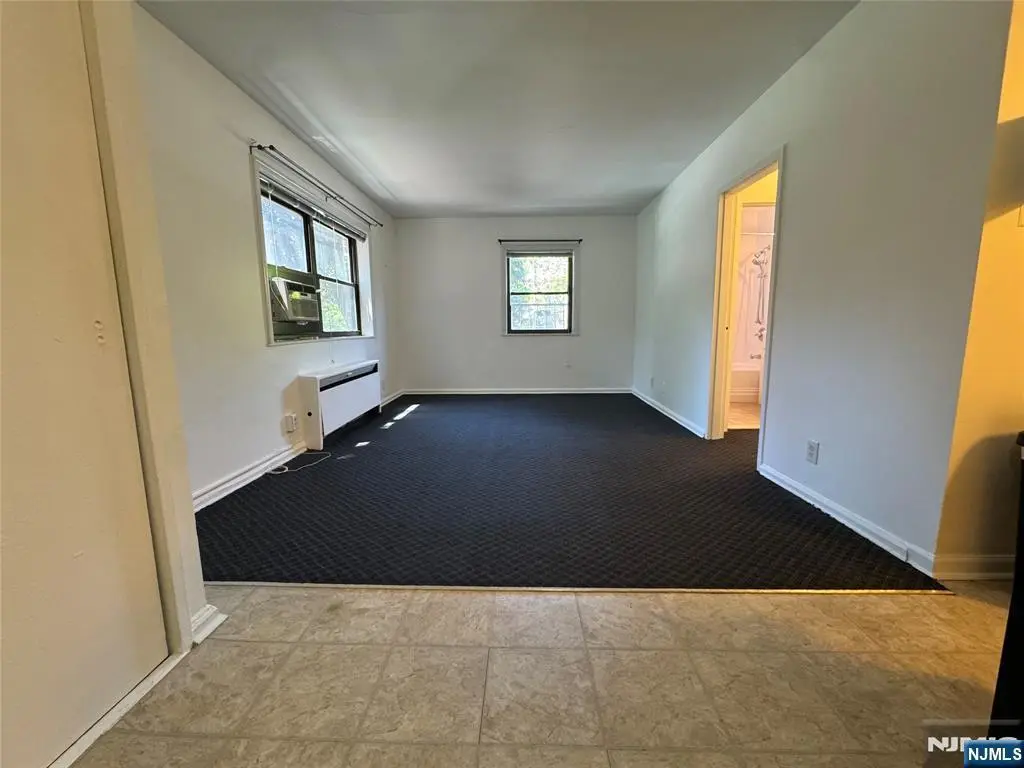
411 Park Pl Unit 2J · Fort Lee, NJ
Flood risk 1/10 · Minimal
- FEMA flood zone
- X (unshaded)
- Chance of flooding over 30 yrs
- 0.0%
- Est. flood insurance / yr
- $507 – $1,088
Fire risk 1/10 · Minimal
- Est. fire insurance / yr
- $526 – $976
Heat risk 6/10 · Moderate
- Hot days now (above 99°F)
- 6 days/yr
- Hot days in 30 yrs
- 13 days/yr
Wind risk 6/10 · Moderate
- Chance of severe wind over 30 yrs
- 27.0%
Air-quality risk 4/10 · Minor
- Unhealthy air days now
- 4 days/yr
- Unhealthy air days in 30 yrs
- 7 days/yr
Risk factors via First Street. Map © Google.
Why this score? — see what drove the B grade
The composite is a weighted blend of 9 inputs, each scored 0–100. Each bar is that input's sub-score; the figure is the points it added to the 100-point composite (weight × sub-score).
- Cash flow +30.0/30.0
- 1% rule +10.0/10.0
- DSCR +10.0/10.0
- ARV discount +7.5/15.0
- Schools +4.9/10.0
- Livability +4.5/5.0
- Condition / age +3.8/5.0
- Rent growth +2.7/5.0
- Appreciation +0.0/10.0
$135,000
🖨 Deal sheet 📄 Offer letter ✓ Due diligence
Multi-family units
County records classify this as Multi-Family (5+ Unit). Listing-text estimate: 1 unit. estimate disagrees with records
5+ unit building — per-unit beds/baths from public records are typically unavailable; the breakdown below (if shown) is an estimate from the listing text.
Listing remarks
Just minutes from NYC, this cozy 2nd floor corner unit in an elevator building comes equipt with an updated kitchen, bathroom and plenty of storage as well as laundry on site. Surrounded by abundant greenery, Linwood Park is the ideal community to enjoy the best of suburban living with easy access into Manhattan. With beautiful walking paths, near-by playgrounds, premier restaurants, boutique shops, top-rated schools and a commuter bus steps from the building, it's no wonder this has become one of the monst saught after neighborhoods. Heat, water, interent and cable included in the HOA. Parking lot spaces are available for an additional fee.
Key facts
- Plenty of storage
- Laundry on site
- Updated kitchen
Tags
Property features AI
Finance
- HOA & community: Homeowners association with a $405 monthly fee; Building name: Linwood Park
Exterior
- Home design: Residential cooperative (Stock Cooperative)
Interior
- Kitchen: Range; Oven; Refrigerator
- Bathrooms: 1 full bathroom
- Heating & cooling: Hot water heating
- Interior features: Elevator
- Laundry & utility: Common area laundry
Neighborhood map
What this means for you Summary
Snapshot
- This is a ?-bed/1.0-bath multifamily listed at $135k. Condition is rated good.
Deal economics
- At list price, monthly cash flow is $3k ($30k/yr) — positive.
- The deal already cash-flows at list — no discount required.
- Meets the 1% rule at list price ($5k rent vs $135k).
- Recommended offer: $133k (1.5% below list) — sets the bar for market timing.
- Cap rate 28.6% vs local median 1.5% in Fort Lee — top-decile yield for the area; either an underpriced asset or a hidden risk that comps aren't pricing in. Stress-test before assuming the spread holds.
Location & tenants
- Location reads 89/100 on livability (#2 in NJ, #139 nationally) — a professional / high-income tenant draw. Strengths: amenities A+, commute A+, employment A+; Watch: cost of living F.
- Fort Lee School District (suburban): math 46% / reading 63% proficiency, ranked #105 of 472 in NJ (top 22%) — acceptable for families but not a draw, mixed tenant base, ~2y average lease; only 12% free/reduced lunch — higher-income household profile.
- Zoned schools: Fort Lee High School (math 35% / reading 66%, grade D+, #101 of 399 statewide, top 26%, 1,160 students, 12% FRL) — zoned schools at 12% FRL track the district average.
- Market conditions: Rents flat; 202 active listings in the ZIP; 40 comparable units currently listed for rent nearby; rentals at typical pace (median 21d on market — plan ~3-4 weeks tenant-placement turnaround); solid renter incomes; 3,488 units permitted in Bergen County in 2024 (1,610 in 5+ unit buildings).
- At $4,873/mo this rent would consume 54% of the median local household income ($107k/yr) (locally 1963% of renters already pay >50% of income on rent) — very limited rent-growth headroom before tenants either downsize or default.
Forward outlook
- Local home prices are declining (-3.0%/yr); year-one equity from $933 of loan paydown is wiped out by about $4k of value loss. Plan a longer hold.
- Bergen County population projected at +20% by 2050 — long-run rental-demand tailwind backs the buy-and-hold thesis.
- At projected returns (-3.0% appreciation + 0.9% rent growth), your $38k cash investment doubles in ~2 years — after that, you're playing with house money.
Negotiation context
- It's been on market 18 days — a 2% lower offer ($133k) is reasonable based on typical stale-listing flexibility.
- 2 sale attempts since 2y ago with the ask held roughly flat each time — persistent listings suggest the price (not the market) is what's stuck; bring a comps-based counter.
Risks & watch-outs
- Climate carrying-cost: major wind risk, 27% chance of damaging wind over 30y; extreme-heat days projected 6→13/yr by 2055 (HVAC capex compounding) — expect insurance premiums to compound above CPI over the hold.
Questions for the listing agent
- What does the HOA fee cover, when was the last increase, and are there any pending special assessments or reserve-fund shortfalls?
- Is there a deadline driving the sale (1031 exchange, divorce, estate, relocation)? That informs how much negotiation room exists.
- Schools are A-rated — typically a magnet for longer-tenancy family renters. What's the average tenant stay here, and is there a school-zone premium baked into asking?
- What's the average days-on-market for RENTAL listings here right now (not sales)? A rising rental-DOM trend means longer vacancies and softer asking-rent achievability than the comps imply.
- What's the recent tenant-quality profile in this submarket — average credit score on applications, eviction rate, late-payment / NSF rate, and stable-employment percentage? A property-management company in the area should have these aggregated.
- How much new apartment / multifamily construction is in the pipeline within 1–3 miles? Heavy new supply (>2% of stock underway) typically softens rents 12–24 months out; light construction supports rent growth.
Investment metrics
- 1% rule
- 3.61% ✓
- Cap rate
- 28.62%
- Cash-on-cash
- 79.74%
- DSCR
- 4.55
- GRM
- 2.3
CMA / ARV
No comps found within radius.
Show comp detail 12 sales within ~0.75 mi
| Address | Dist | Beds/Ba | Sqft | Sold | Price | $/sf | Match |
|---|---|---|---|---|---|---|---|
| 422 Myrtle Ave | 0.22mi | 4/3.0 | — | 7mo | $999,000 | — | 64 |
| 2413 3rd St | 0.28mi | 7/3.0 | — | 12mo | $999,999 | — | 57 |
| 2278 Center Ave | 0.23mi | 3/2.0 | — | 20mo | $790,500 | — | 56 |
| 424 Myrtle Ave | 0.22mi | 6/5.0 | — | 7mo | $1,101,000 | — | 56 |
| 2179 Edwin Ave | 0.27mi | 4/3.0 | — | 15mo | $840,000 | — | 55 |
| 10 E Bayview Ave | 0.59mi | 3/2.5 | — | 0mo | $1,090,000 | — | 54 |
| 233 Myrtle Ave | 0.24mi | 6/4.0 | — | 12mo | $1,101,000 | — | 54 |
| 2460 1st St | 0.36mi | 7/5.0 | — | 6mo | $1,450,000 | — | 50 |
| 2414 3rd St | 0.30mi | 6/4.0 | — | 15mo | $800,000 | — | 50 |
| 2463 2nd St | 0.36mi | 7/5.0 | — | 13mo | $1,470,000 | — | 44 |
| 407 Jane St | 0.73mi | 6/4.0 | — | 3mo | $1,450,000 | — | 39 |
| 2450 7th St | 0.47mi | 6/5.0 | — | 14mo | $1,200,000 | — | 38 |
Match score weights: distance 35% · size 25% · config 20% · recency 20%. Top-matched comps best support the ARV.
Projected returns pro-forma
-3.0% appreciation · 0.95% rent growth · sell at horizon
- IRR
- 77.3%
- Equity multiple
- 4.40×
- Total profit
- $128,569
- Equity at exit
- $20,129
- IRR
- 80.4%
- Equity multiple
- 8.42×
- Total profit
- $280,465
- Equity at exit
- $11,672
Cash invested: $37,800 (down + closing). Projections, not guarantees.
Landlord ↔ Tenant lean methodology
- Overall (STATE)
- 21 Tenant-Leaning
- State New Jersey
- 21 Tenant-Leaning · D+6
- County
- — inherits STATE
- City
- — inherits STATE
ZIP-level market 07024
- Home prices YoY
- -19.8%
- Rents YoY
- 0.9%
- Active inventory
- 202
- Price-to-rent
- 4.6×
Monthly cashflow live
- Estimated rent
- $4,873 high interval (Pro) →
- Mortgage (P&I)
- −$708
- Tax est. 1.5%
- −$169 /mo · $2,025/yr
- Insurance
- −$56
- HOA
- −$405
- Vacancy / Maint / Mgmt
- −$1,023
- Net cashflow
- $2,512
Break-even live
2-unit breakdown (identical units grouped — click to expand)
| Units | Beds | Baths | Est. rent |
|---|---|---|---|
| 2× units | 1 | 1 | $4,872 |
| #1 | 1 | 1 | $2,436 |
| #2 | 1 | 1 | $2,436 |
| Total (2 units) | $4,873 | ||
UW: 25.0% down · 7.5% · 30yr · 1.5% tax · 5.0% vac · 8.0% maint · 8.0% mgmt
Financing live
Cash to close
- Down payment
- $33,750
- Closing costs
- $4,050
- Reserves months
- —
- Total cash needed
- —
Loan-product check · same deal, 3 products live
Conventional
25% down · 7.5% · 30yr
- Down + closing
- —
- Monthly P&I
- —
- Monthly cashflow
- —
- DSCR
- —
- Eligible?
- —
Personal DTI + credit; lowest rate.
DSCR
20% down · 8.5% · 30yr
- Down + closing
- —
- Monthly P&I
- —
- Monthly cashflow
- —
- DSCR
- —
- Eligible?
- —
No personal income docs; deal must DSCR.
Hard money
10% down · 12.0% · 12mo
- Down + closing
- —
- Monthly P&I
- —
- Monthly cashflow
- —
- DSCR
- —
- Eligible?
- —
Short-term bridge; refi at stabilization.
Rent comps 40 comps
| Address | Beds | Baths | Sqft | Rent | $/sqft | DOM | Units | Dist |
|---|---|---|---|---|---|---|---|---|
| 401 Park Pl Unit 3 F Fort Lee, NJ | 1.0 | 1.0 | — | $1,675 | — | 19d | 1 | 0.02mi |
| 2350 Linwood Ave Unit 2H Fort Lee, NJ | 2.0 | 1.0 | — | $2,400 | — | 4d | 1 | 0.06mi |
| 2345 Linwood Ave Fort Lee, NJ | 2.0 | 1.0 | — | $2,775 | — | 5d | 2 | 0.07mi |
| 2345 Linwood Ave Fort Lee, NJ | 1.0–2.0 | 1.0 | — | $2,700 | — | 20d | 2 | 0.07mi |
| 2345 Linwood Ave Unit 5F Fort Lee, NJ | 2.0 | 1.0 | — | $2,700 | — | 24d | 1 | 0.07mi |
| 2348 Linwood Ave Unit 3L Fort Lee, NJ | 1.0 | 1.0 | — | $2,400 | — | 24d | 1 | 0.11mi |
| 3071 Edwin Ave Unit 5G Fort Lee, NJ | 1.0 | 1.0 | — | $1,900 | — | 7d | 1 | 0.13mi |
| 3071 Edwin Ave Unit 5G Fort Lee, NJ | 1.0 | 1.0 | — | $2,000 | — | 24d | 1 | 0.13mi |
| 415 Westview Pl Fort Lee, NJ | 3.0 | 2.5 | — | $5,500 | — | 19d | 1 | 0.16mi |
| 427 Westview Pl Unit A Fort Lee, NJ | 3.0 | 2.5 | — | $6,500 | — | 22d | 1 | 0.18mi |
| 2244 Linwood Ave Unit 1 Fort Lee, NJ | 3.0 | 1.5 | — | $2,900 | — | 4d | 1 | 0.19mi |
| 2389 3rd St Fort Lee, NJ | 3.0 | 2.5 | — | $3,570 | — | 19d | 1 | 0.21mi |
| 438 Myrtle Ave Unit A Fort Lee, NJ | 3.0 | 3.5 | — | $3,800 | — | 2d | 1 | 0.22mi |
| 2301 Lemoine Ave #402 Fort Lee, NJ | 1.0 | 1.0 | — | $2,745 | — | 17d | 1 | 0.22mi |
| 440 Myrtle Ave Fort Lee, NJ | 3.0 | 2.0 | — | $3,200 | — | 24d | 1 | 0.22mi |
| 216A Washington Ave Fort Lee, NJ | 2.0 | 2.0 | — | $3,200 | — | 20d | 1 | 0.22mi |
| 900 Crest Ln Fort Lee, NJ | 1.0–3.0 | 1.0–2.0 | 1064 | $3,439 | $3.23 | 2d | 15 | 0.23mi |
| 330 New York Ave Unit B Fort Lee, NJ | 3.0 | 2.5 | — | $6,400 | — | 24d | 1 | 0.24mi |
| 2278 Center Ave Unit 2nd Floor Fort Lee, NJ | 1.0 | 1.0 | — | $2,200 | — | 24d | 1 | 0.24mi |
| 206 New York Ave Unit 2 Fort Lee, NJ | 3.0 | 2.0 | — | $3,500 | — | 7d | 1 | 0.25mi |
| 469 Westview Ave Englewood, NJ | 3.0 | 2.0 | — | $3,850 | — | 24d | 1 | 0.28mi |
| 224 Washington Ave Unit B Fort Lee, NJ | 2.0 | 2.0 | — | $3,050 | — | 24d | 1 | 0.28mi |
| 2217B Mackay Ave Unit B Fort Lee, NJ | 3.0 | 3.5 | — | $4,900 | — | 24d | 1 | 0.28mi |
| 2 Executive Dr Unit 915 Fort Lee, NJ | 1.0 | 1.0 | — | $2,700 | — | 22d | 1 | 0.29mi |
| 2 Executive Dr Unit 821 Fort Lee, NJ | 2.0 | 2.0 | — | $3,500 | — | 24d | 1 | 0.30mi |
| 2 Executive Dr Unit 918 Fort Lee, NJ | 1.0 | 1.0 | — | $2,700 | — | 24d | 1 | 0.30mi |
| 2205 Center Ave Unit B Fort Lee, NJ | 1.0 | 1.0 | — | $2,200 | — | 20d | 1 | 0.33mi |
| 2207 Center Ave Unit B Fort Lee, NJ | 1.0 | 1.0 | — | $2,000 | — | 7d | 1 | 0.34mi |
| 2197A Center Ave Unit 197B Fort Lee, NJ | 2.0 | 1.0 | — | $2,500 | — | 24d | 1 | 0.35mi |
| 2152 South St Unit 1st Fl Fort Lee, NJ | 2.0 | 1.0 | — | $3,200 | — | 12d | 1 | 0.36mi |
| 2148 South St Unit GROUND Fort Lee, NJ | 1.0 | 1.0 | — | $1,900 | — | 24d | 1 | 0.37mi |
| 2335 Hudson Ter Unit D6 Fort Lee, NJ | 2.0 | 1.0 | 800 | $2,555 | $3.19 | 6d | 1 | 0.41mi |
| 2335 Hudson Ter Unit C6 Fort Lee, NJ | 2.0 | 1.0 | — | $2,250 | — | 3d | 1 | 0.41mi |
| 2335 Hudson Ter Unit D6 Fort Lee, NJ | 2.0 | 1.0 | — | $2,545 | — | 20d | 1 | 0.41mi |
| 2329 Hudson Ter Unit E14 Fort Lee, NJ | 2.0 | 1.0 | 800 | $2,700 | $3.38 | 22d | 1 | 0.41mi |
| 2329 Hudson Ter Unit G2C Fort Lee, NJ | 2.0 | 1.0 | — | $1,850 | — | 24d | 1 | 0.41mi |
| 2339 Hudson Ter Unit D17 Fort Lee, NJ | 1.0 | 1.0 | 620 | $1,900 | $3.06 | 24d | 1 | 0.41mi |
| 2160 Center Ave Fort Lee, NJ | 1.0–2.0 | 1.0 | — | $2,400 | — | 13d | 2 | 0.42mi |
| 13 3rd St Englewood Cliffs, NJ | 3.0 | 1.0 | — | $3,800 | — | 24d | 1 | 0.42mi |
| 2160 Center Ave Unit 2L Fort Lee, NJ | 2.0 | 1.0 | — | $2,400 | — | 6d | 1 | 0.42mi |
HOA detail
- Monthly dues
- $405 · $4,860/yr
- Likely covers
- watercablelandscaping
Listing history 8 events
-
2026-06-04days on market $135,000 Active 18 DOM
-
2026-06-03days on market $135,000 Active 17 DOM
-
2026-06-02days on market $135,000 Active 16 DOM
-
2026-06-01days on market $135,000 Active 15 DOM
-
2026-05-31days on market $135,000 Active 14 DOM
-
2026-05-17$135,000 Active
-
2024-02-16historical $1,300
-
2024-01-16$1,300
ⓘ Source: listings_history table (triggers on properties + properties_extension) + one-shot
backfill from property_details.listing_events for pre-trigger history.
Climate risk First Street
- Flood 1/10 Low FEMA zone X (unshaded) · 0% chance over 30 yrs
- Wildfire 1/10 Low
- Heat 6/10 Major 6 d/yr ≥99°F today · 13 d/yr by 30 yrs out
- Wind 6/10 Major 27% chance of damaging wind over 30 yrs
- Air quality 4/10 Moderate 4 unhealthy d/yr today · 7 by 30 yrs out
Nearby sold comps map
Loading sold comps map…
Walkable amenities ~0.75 mi
Loading nearby amenities…
Taxation est. · year 1
- Rental income
- $58,476
- − Mortgage interest
- −$7,562
- − Property taxes
- −$2,025
- − Insurance
- −$675
- − Repairs & maintenance
- −$4,678
- − Management
- −$4,678
- − HOA
- −$4,860
- − Depreciation
- −$3,927
- Taxable income
- $30,070
- Est. tax owed @ 24.0%
- −$7,217
- After-tax cash flow
- $22,924/yr
For passive investors: Depreciation is non-cash, so a rental often shows a tax loss while cash-flowing — sheltering income. Rental losses are passive: they offset passive income freely, and up to $25,000/yr can offset ordinary (W-2) income if you actively participate and your MAGI is under $100k (phasing out to $0 by $150k); unused losses carry forward. On sale, claimed depreciation is recaptured at up to 25%, and gains may owe capital-gains tax (a 1031 exchange can defer both). Figures are a year-1 estimate at your 24.0% rate — not tax advice; consult a CPA.
Condition & rehab AI · 9 photos
This 2nd floor corner unit in an elevator building is in good condition with updated kitchen and bathroom. It offers a good investment opportunity with potential for value enhancement through minor cosmetic upgrades.
Value-add opportunities
- Both Painting the exterior and interior walls — Fresh paint can enhance curb appeal and interior aesthetics
- Both Upgrading the HVAC system — Modern HVAC can improve comfort and energy efficiency
- Both Landscaping improvements — Enhanced landscaping can boost curb appeal and property value
Renovation cost estimate screening
Value-add ROI direction
- Both Painting the exterior and interior walls — Fresh paint can enhance curb appeal and interior aesthetics ↑
- Both Upgrading the HVAC system — Modern HVAC can improve comfort and energy efficiency ↑
- Both Landscaping improvements — Enhanced landscaping can boost curb appeal and property value ↑
ⓘ Cost ranges are severity-bucket heuristics (US national rule-of-thumb). Get contractor quotes + a written scope before underwriting a rehab budget.
Schools (NCES district)
- District
- Fort Lee School District
- NCES district ID
- 3405310
- Math proficiency
- 46% ▼ -14.00%
- Reading proficiency
- 63% ▼ -11.00%
- Median HH income
- $71,442
- Composite
- 48.5/100
- National rank
- #2121
- State rank
- #105 of 472 in NJ
Livability — Fort Lee
- Score
- 89/100
- State rank
- #2
- US rank
- #139
Category grades
Schools grade is shown separately in the Schools card above.
Census & demographics
- Census place
- Fort Lee, NJ
- County
- Bergen County · 586,961 people
- City population
- 40,024
- Metro
- New York-Newark-Jersey City, NY-NJ-PA
- Population (ZIP)
- 40,024
- Household income
- $107,396
- Rent vs Own
- Severe rent burden
- 1963.0
Population outlook (Bergen County) Hauer SSP2
- Today (2025)
- 1,021,896 people
- By 2030
- 1,063,119 · +4.0%
- By 2040
- 1,146,566 · +12.2%
- By 2050
- 1,229,132 · +20.3%
- By 2075
- 1,429,694 · +39.9%
- By 2100
- 1,547,614 · +51.4%
Race, ethnicity, and origin ACS 2023
- Neighborhood character
- Diverse neighborhood (Simpson 0.65)
- Race & ethnicity
- Asian 44% White 38% Hispanic / Latino 12% Two or more races 9% Black 2%
- Hispanic origin (detail)
- Puerto Rican 2% Cuban 1% Dominican 4%
- Common ancestry
- Scotch-Irish 5% Romanian 3% Scandinavian 1%
- Foreign-born
- 50% · South Korea, China, Canada
- Languages at home
- 39% English-only · Korean 21% Spanish 10% Chinese 9%
Political lean MEDSL · Bergen
- 2024 margin
- Toss-up / Even · D 50.7% · R 47.3% · Other 2.0%
- 2008→2024 swing
- -6.1pp toward R · 2008: 9.5pp · 2024: 3.4pp
- All cycles
- 2024: D+3.4 2020: D+16.4 2016: D+12.0 2012: D+10.8 2008: D+9.5
Not yet ingested
- Civics
- —
Market trends
- HPI YoY
- ▼ -61.44%
- Current HPI
- 248.6123
- Rent YoY
- ▲ 0.95%
- Metro
- New York-Newark-Jersey City, NY-NJ-PA
- State GDP YoY
- ▲ 2.05%
- F500 in state
- 34
Industry mix (Fortune 500 HQ in NJ)
| Industry | F500 HQs | Revenue |
|---|---|---|
| Consumer Goods | 3 | $31B |
|
||
| Pharmaceuticals | 2 | $153B |
|
||
| Technology | 2 | $21B |
|
||
| Insurance | 2 | $20B |
|
||
| Healthcare | 2 | $19B |
|
||
| Financial Services | 1 | $70B |
|
||
Price history
+10284.6% since first listed3 events — show timeline
- 2026-05-17 Listed $135,000 NJMLS
- 2024-02-16 Rental Removed $1,300 NJMLS
- 2024-01-16 Listed for Rent $1,300 NJMLS
Cash-flow waterfall
monthlySold comps — $/sqft
last 12 mo · ≤1 miLoading sold comps…